
DXY:
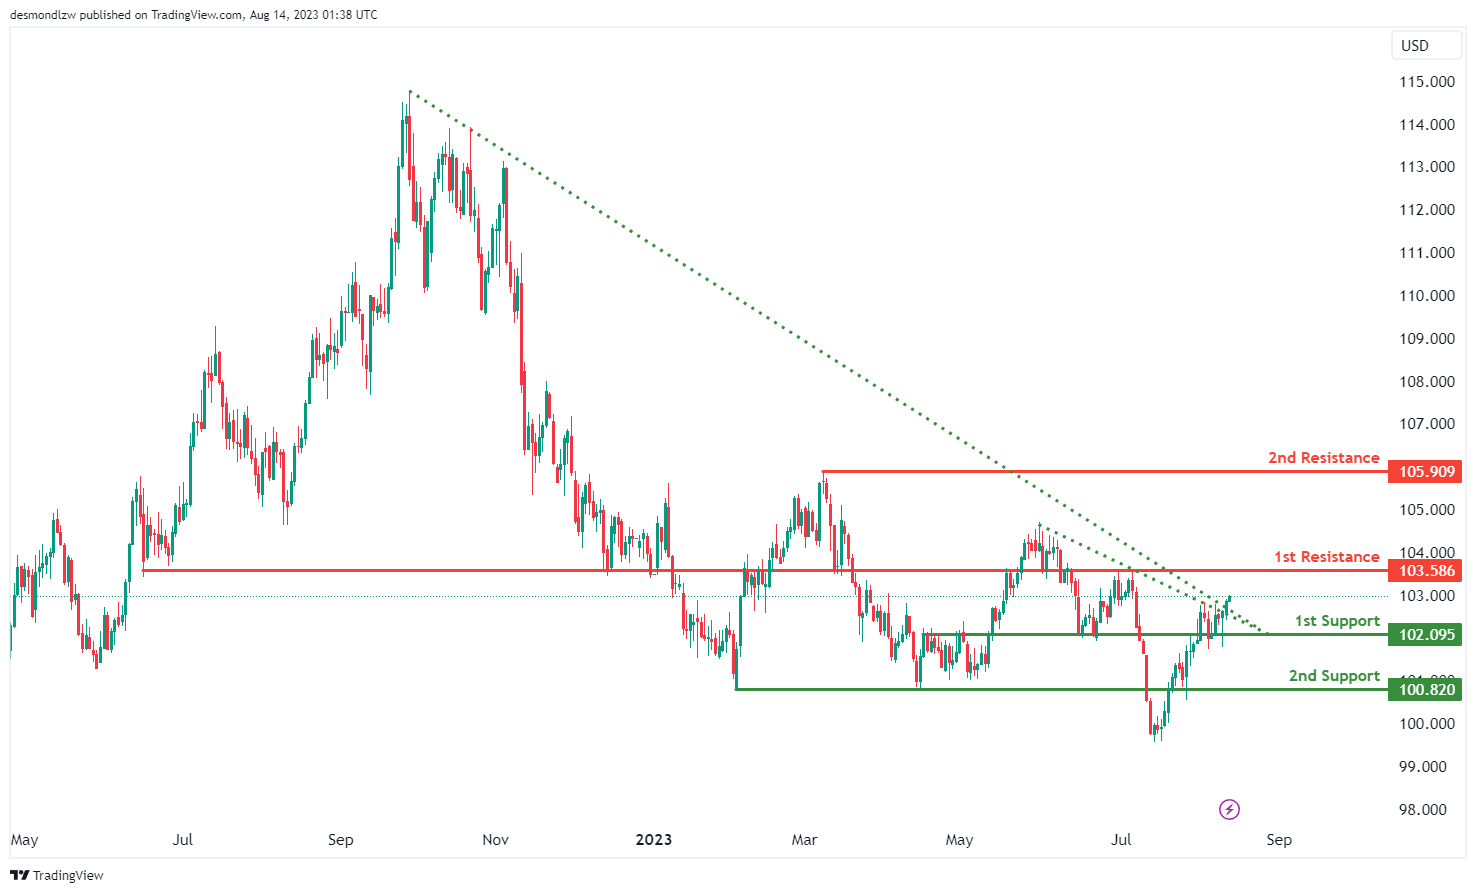
The DXY chart is currently exhibiting a bullish momentum driven by the price breaking above a descending resistance line, indicating a potential upward trend.
With this bullish sentiment, there is a possibility that the price could continue its upward movement towards the 1st resistance level at 103.58.
The significance of the 1st support level at 102.09 lies in its identification as an overlap support, while the 2nd support at 100.82 is reinforced by being a swing low support.
On the other hand, the 1st resistance level at 103.58 is noteworthy as an overlap resistance, and a 2nd resistance at 105.90 is identified as a swing high resistance, adding to its potential as a resistance level.
EUR/USD:
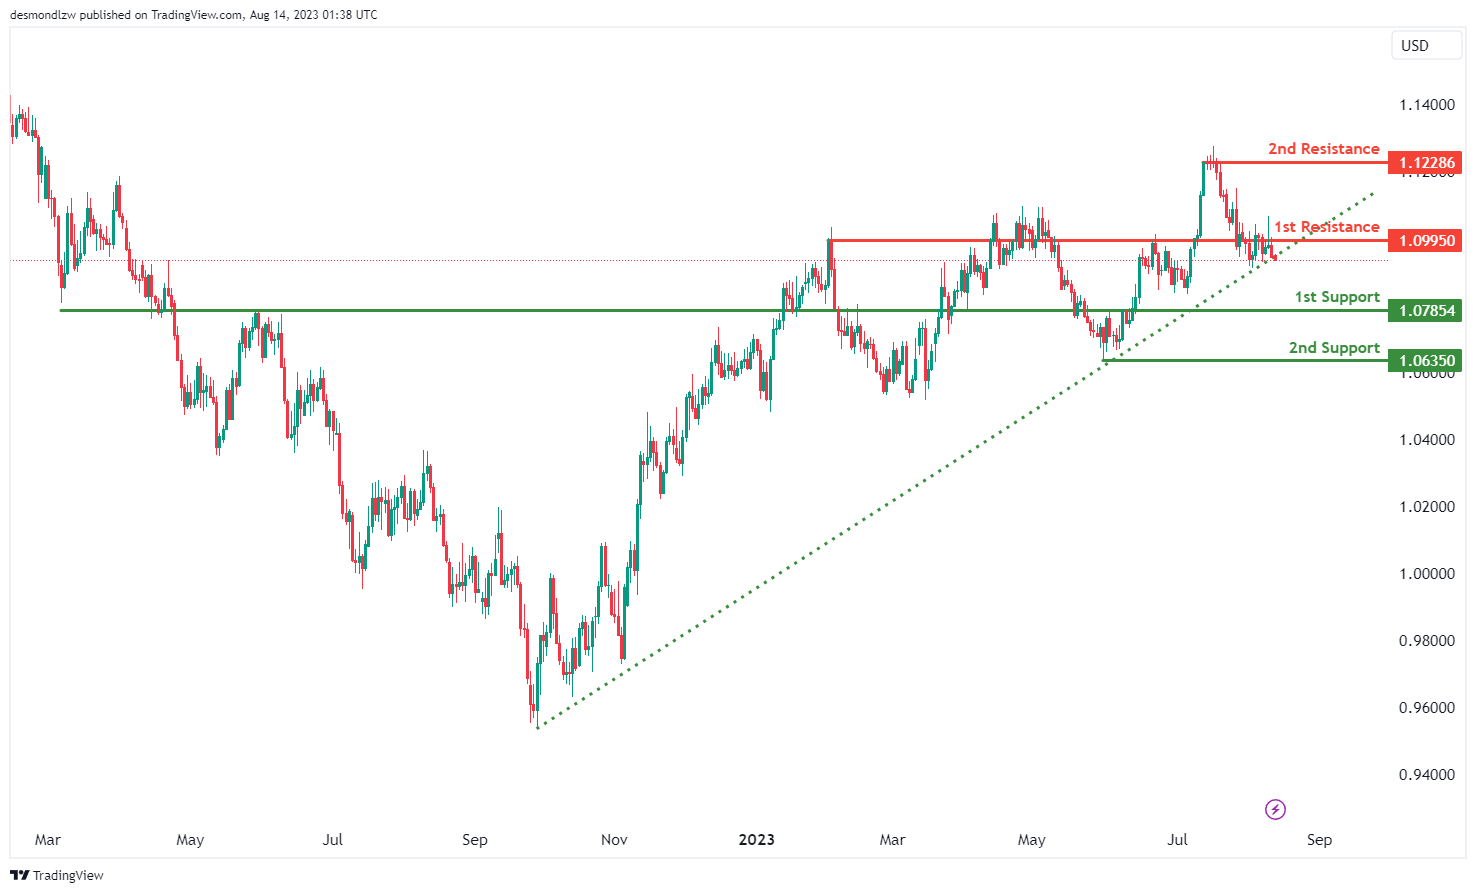
The EUR/USD chart currently exhibits a bearish momentum, indicating a predominant downward trend.
This bearish sentiment is driven by the price breaking below an ascending support line, suggesting the possibility of a further downward movement.
The potential scenario involves the price continuing its bearish trend towards the 1st support level at 1.0785.
The significance of the 1st support level at 1.0785 is due to its function as a pullback support, while the 2nd support at 1.0635 is further supported as a swing low support.
On the other hand, the 1st resistance level at 1.0995 holds importance as an overlap resistance, and a 2nd resistance at 1.1228 is identified as a multi-swing high resistance.
EUR/JPY:
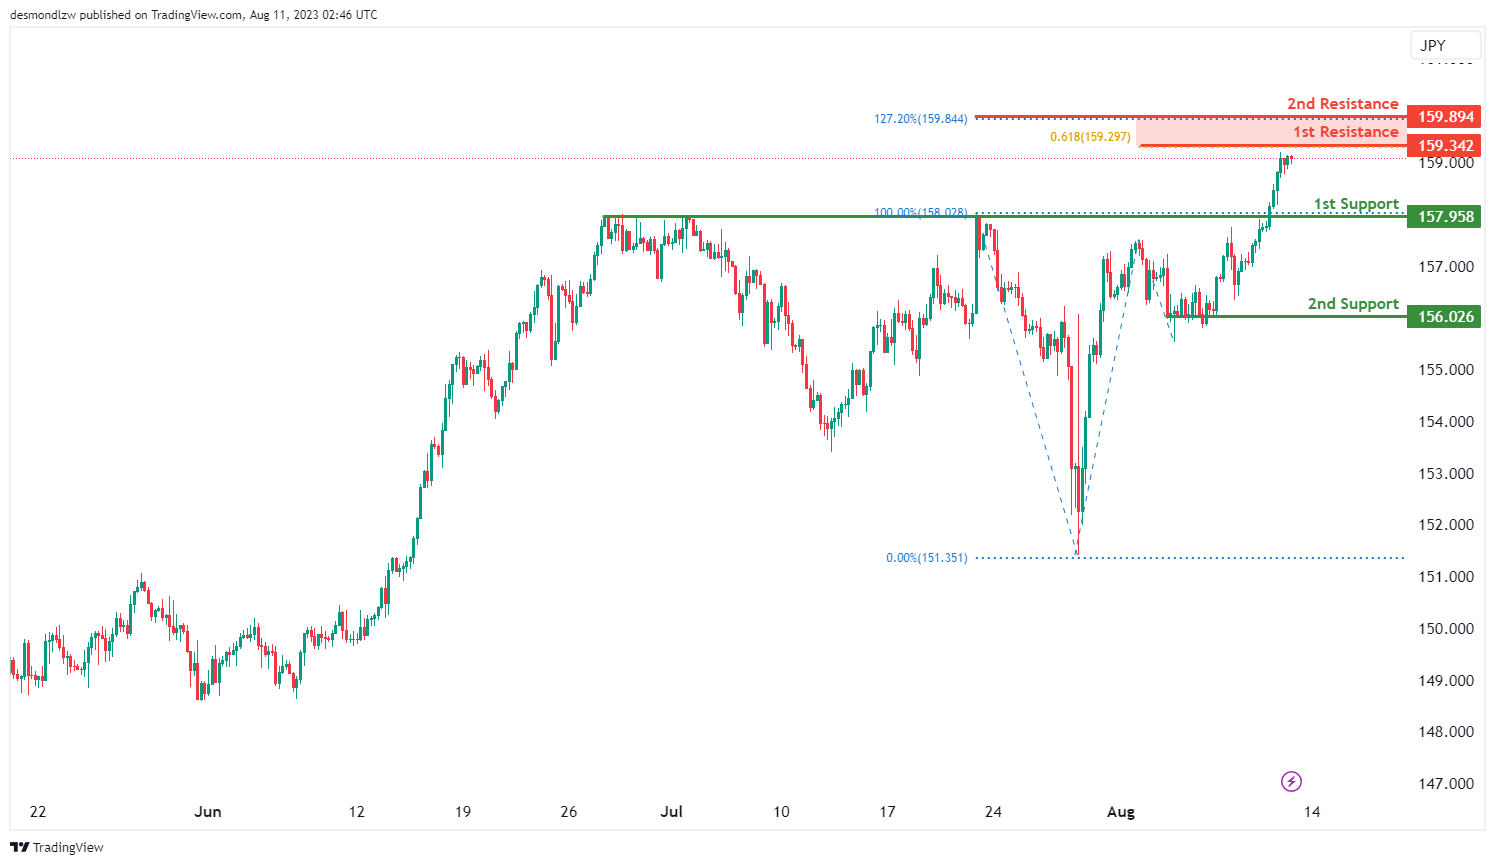
The current trend on the EUR/JPY chart indicates a bullish momentum, suggesting a prevailing upward movement. Within this context, there’s a potential for the price to continue its bullish trend towards the resistance level.
The significance of the support at 157.95 is in its capacity as a pullback support, while the 2nd support at 156.02 is identified as a support level during multiple swing lows.
On the other hand, the resistance at 159.34 gains importance due to its association with a 61.80% Fibonacci Projection.
Further indication of potential resistance is provided by the presence of a 2nd resistance at 159.89, which aligns with a 127.20% Fibonacci Extension.
EUR/GBP:
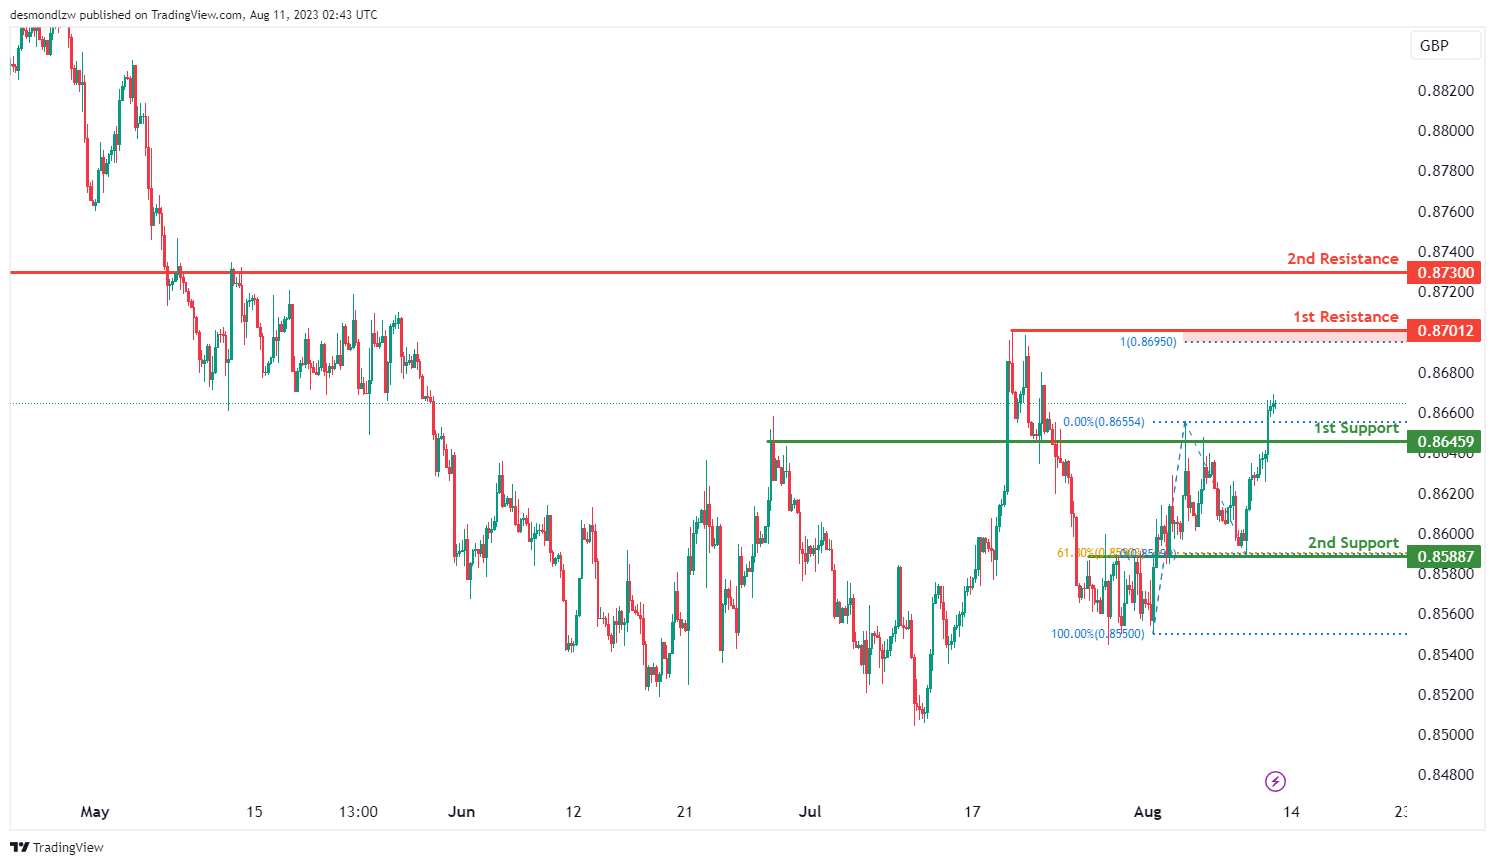
The EUR/GBP chart currently indicates a bullish momentum, suggesting an ongoing upward trend. In light of this bullish sentiment, there is potential for the price to continue its bullish movement towards the resistance level.
The support level at 0.8645 is noted as a pullback support, and there is an additional 2nd support at 0.8588, identified as a pullback support aligned with a 61.80% Fibonacci Retracement.
Conversely, the resistance level at 0.8701 is significant as it acts as a swing high resistance with the reinforcement of a 100% Fibonacci Projection.
Further reinforcement for potential resistance is provided by a 2nd resistance level at 0.8730, characterized as a pullback resistance.
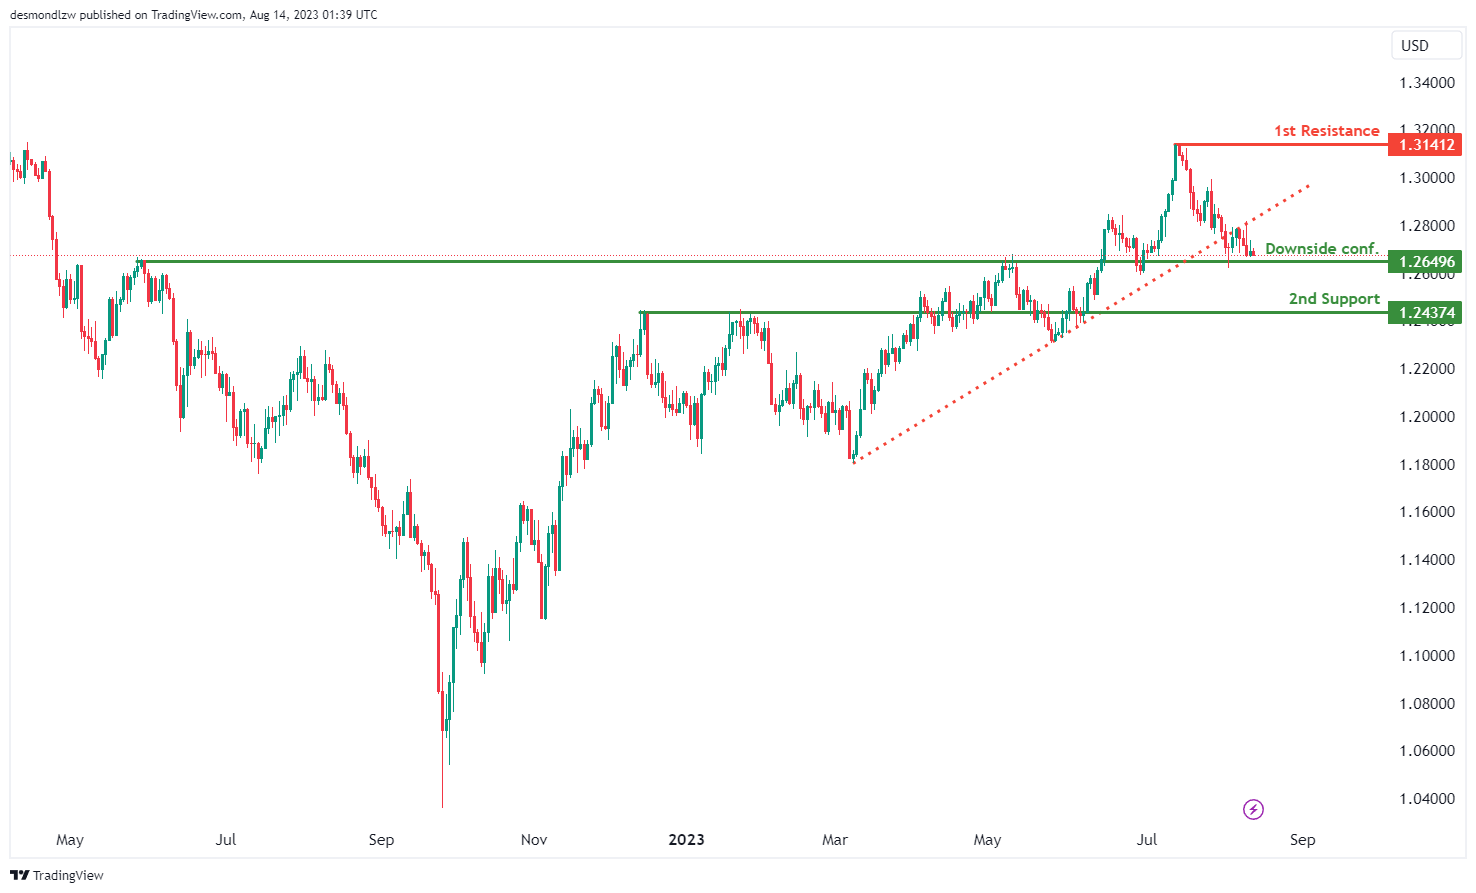
GBP/USD:
The GBP/USD chart currently exhibits a bearish momentum, indicating a prevailing downward trend.
This bearish momentum is supported by the price breaking below an ascending support line, suggesting the potential for a continued downward movement.
In the near term, there is a possibility for the price to experience a temporary rise towards the 1st resistance level at 1.3141 before reversing its direction and moving downward again.
The significance of the 1st support level at 1.2649 is due to its role as an overlap support, while the 2nd support at 1.2437 is reinforced as a pullback support. Conversely, the 1st resistance level at 1.3141 is noted as a swing high resistance.
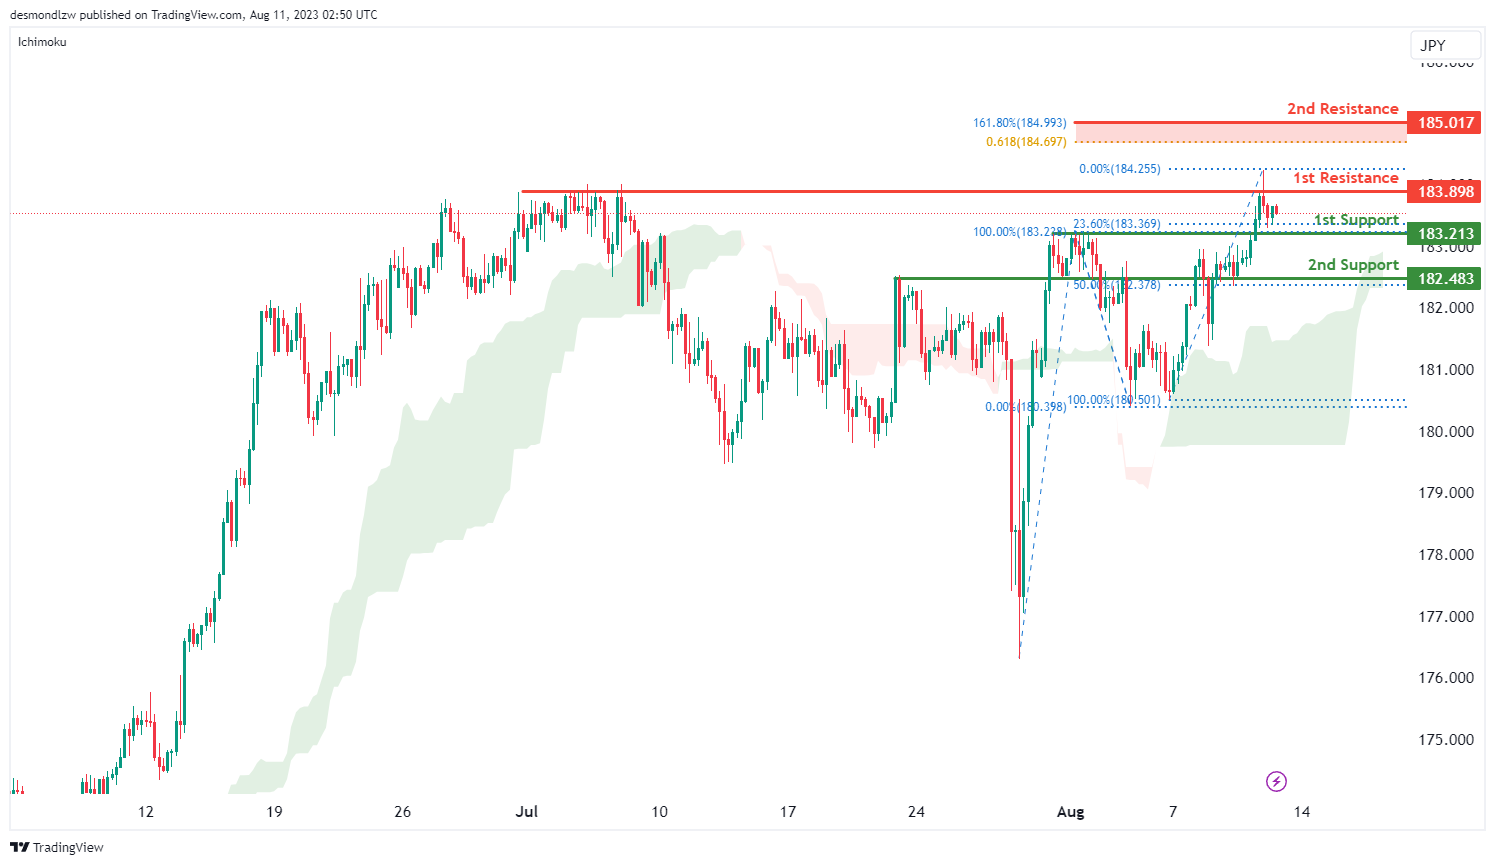
GBP/JPY:
The current momentum of the GBP/JPY chart is bullish, indicating a predominant upward trend. This sentiment is supported by the fact that the price is currently trading above the bullish Ichimoku cloud.
In light of this bullish outlook, there is a potential opportunity for the price to continue its upward movement towards the resistance level at 183.89.
The support level at 183.21 holds importance as it serves as a pullback support, with additional reinforcement coming from a 2nd support level at 182.48.
Conversely, the resistance level at 183.89 is noteworthy as it is a multi-swing high resistance, which could potentially hinder further upward advancement.
The presence of a 2nd resistance level at 185.01, identified as a pullback resistance, adds further weight to the potential resistance areas on the chart.
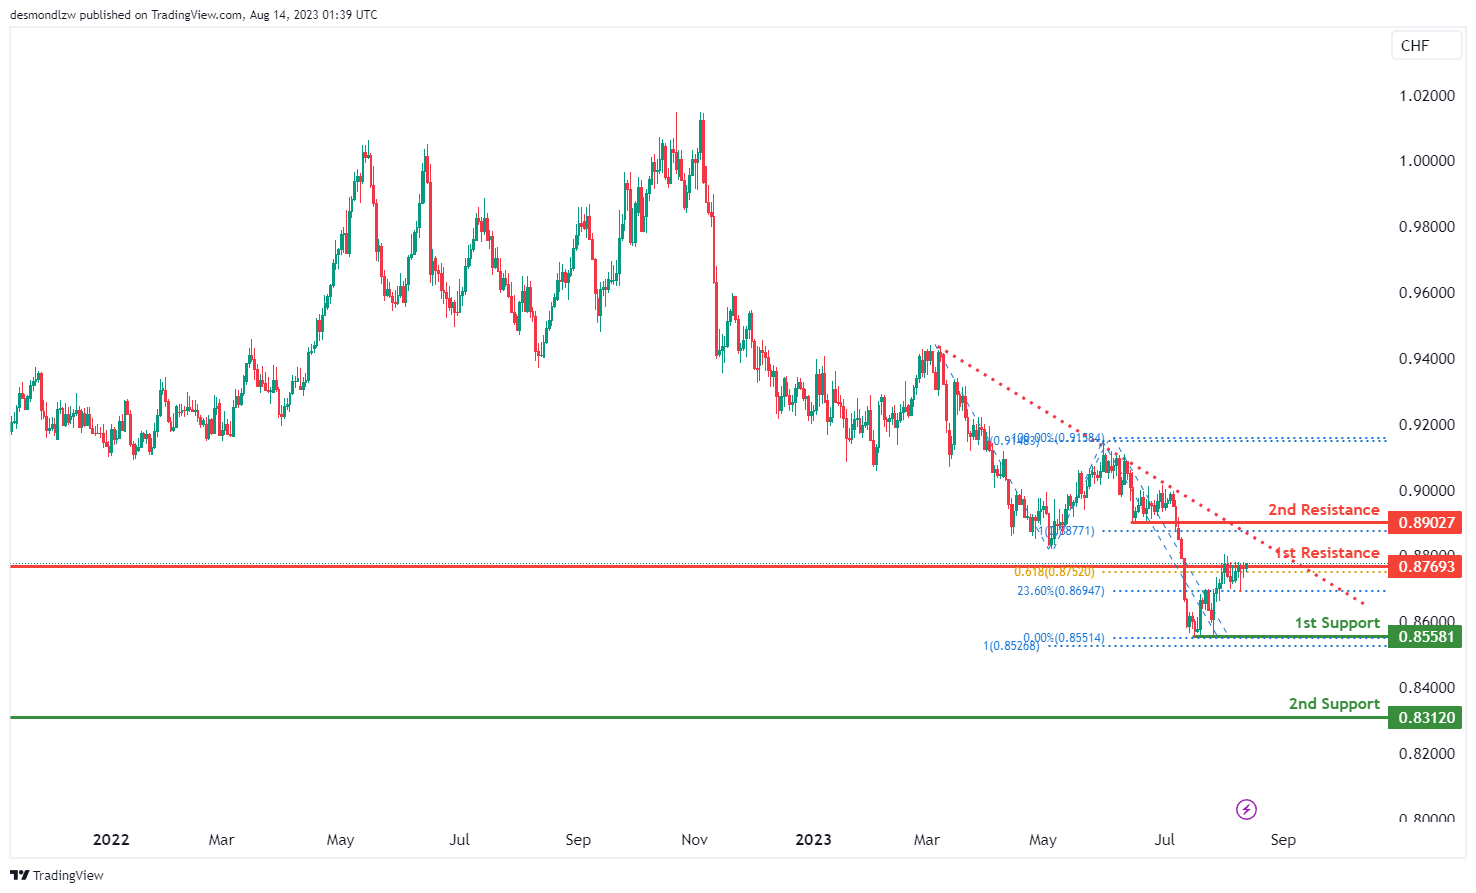
USD/CHF:
The USD/CHF chart currently reflects a bearish momentum, indicating a predominant downward trend.
Considering this bearish sentiment, there’s a possibility for the price to exhibit a bearish reaction upon reaching the 1st resistance level, leading to a potential decline towards the 1st support level.
The significance of the 1st support at 0.8558 lies in its role as a multi-swing low support. Additionally, a 2ndary support at 0.8312 reinforces the support structure.
Conversely, the 1st resistance level at 0.8769 is highlighted as an overlap resistance.
Moreover, a 2nd resistance at 0.8902 is identified as a pullback resistance, further contributing to the potential for resistance against upward movement.
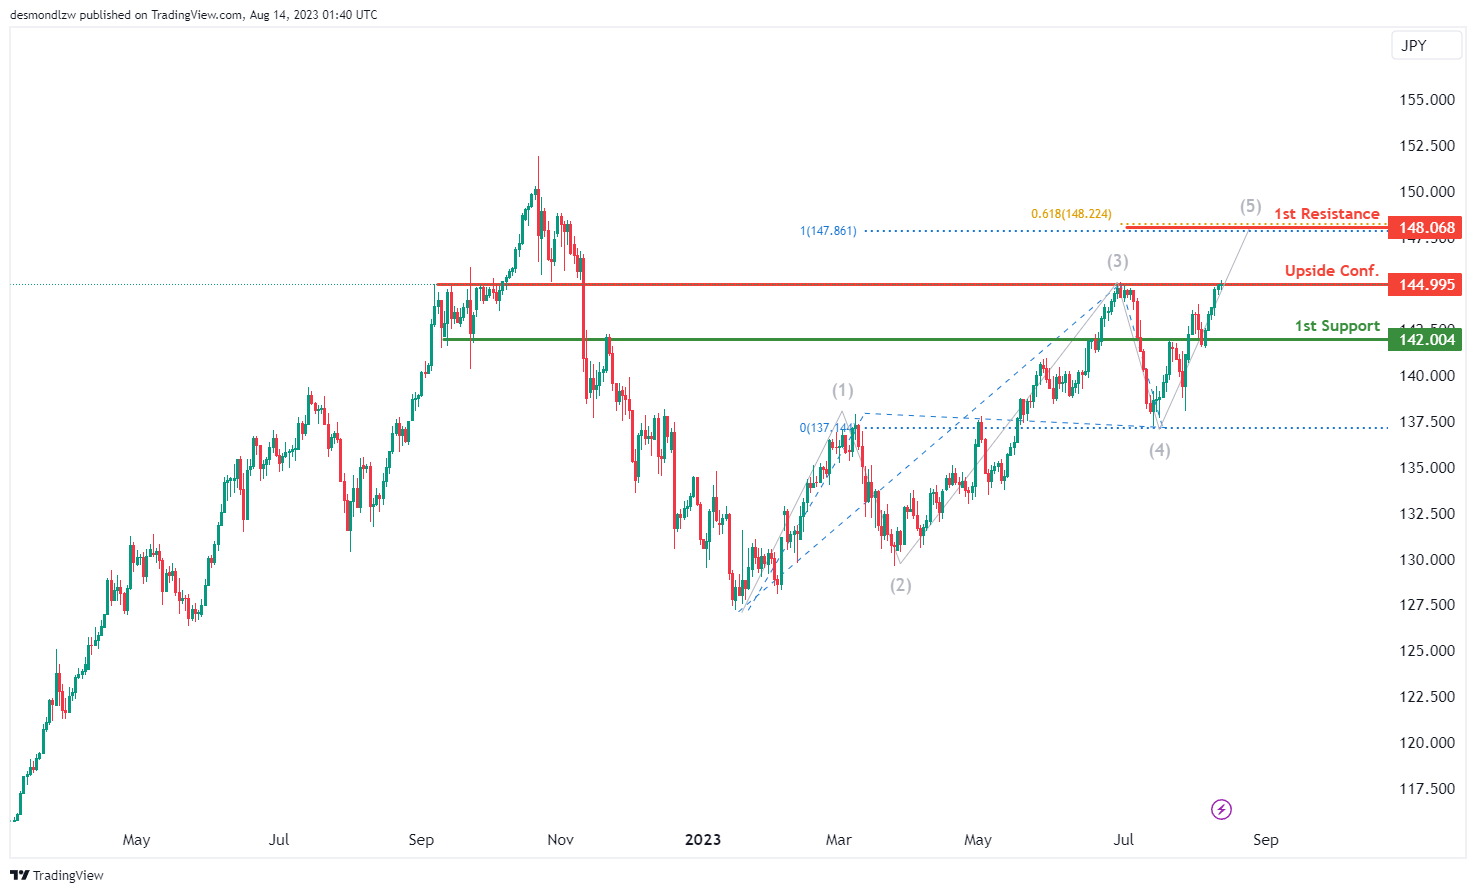
USD/JPY:
The current momentum of the USD/JPY chart suggests a bearish trend, indicating a potential downward movement. In this context, there is a potential scenario where the price reacts bearishly upon reaching the 1st resistance level and drops towards the 1st support.
The 1st support level at 142.00 holds significance as an overlap support.
On the other hand, the 1st resistance level at 148.06 is important due to its alignment with both a 100% Fibonacci Projection and a 61.80% Fibonacci Projection, which indicates a possible Fibonacci confluence.
Waiting for upside confirmation at 144.99 highlights this level as an overlap resistance, suggesting a potential reversal point.
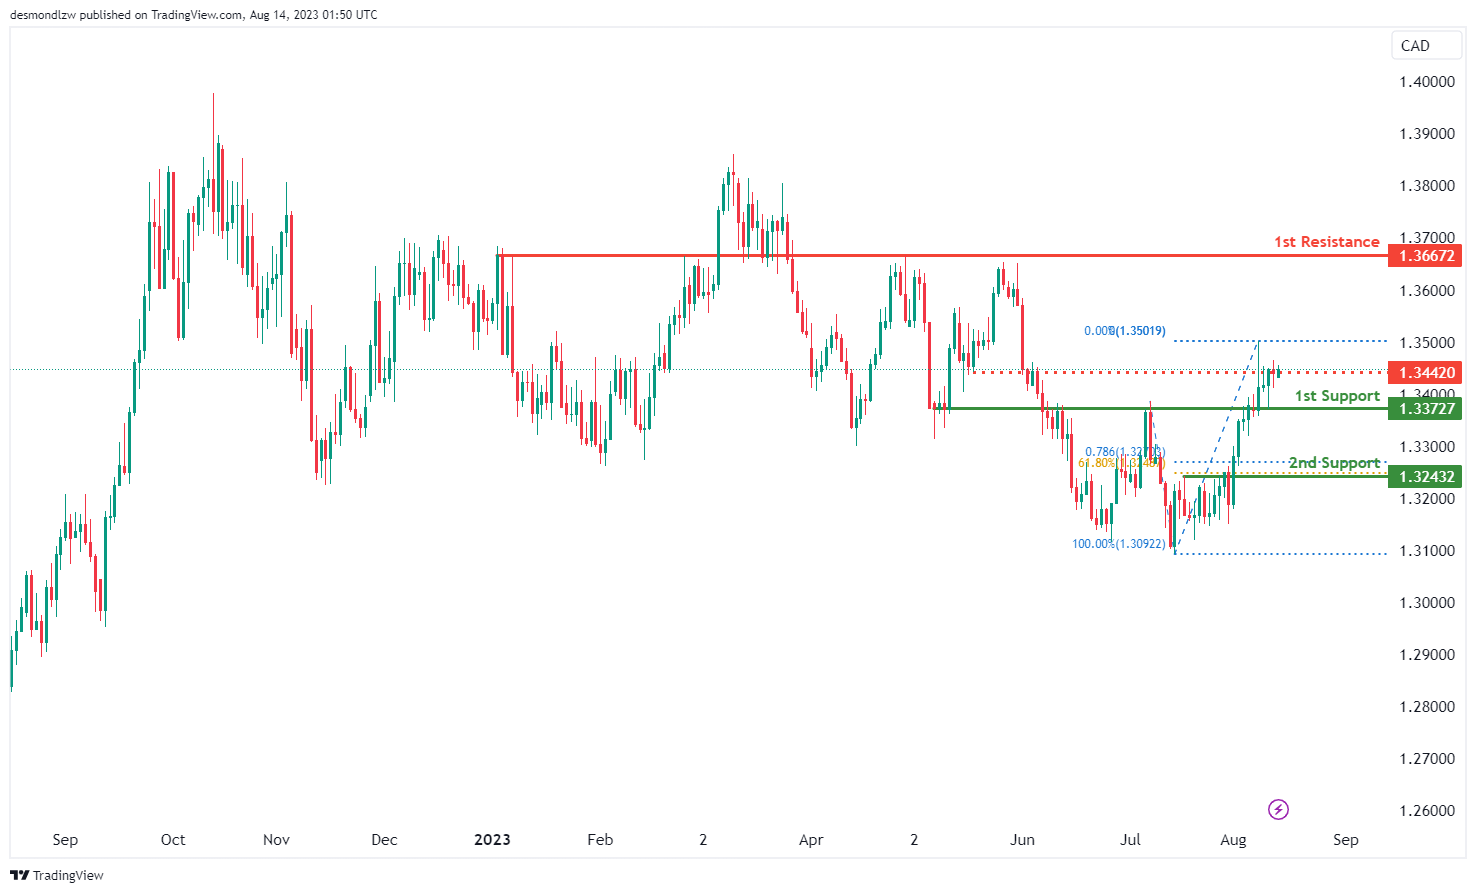
USD/CAD:
The current momentum of the USD/CAD chart indicates a bullish trend, suggesting a potential for further upward movement should price break through the intermediate resistance.
The intermediate resistance level at 1.3442 is recognized as a pullback resistance while the 1st resistance level at 1.3668 is recognized as an overlap resistance.
To the downside, the 1st support at 1.3373 is recognized as an overlap support level. The 2nd support level at 1.3243 is recognized as a pullback support that aligns with the 61.80% Fibonacci retracement and 78.60% Fibonacci projection levels, indicating a confluence of Fibonacci levels.
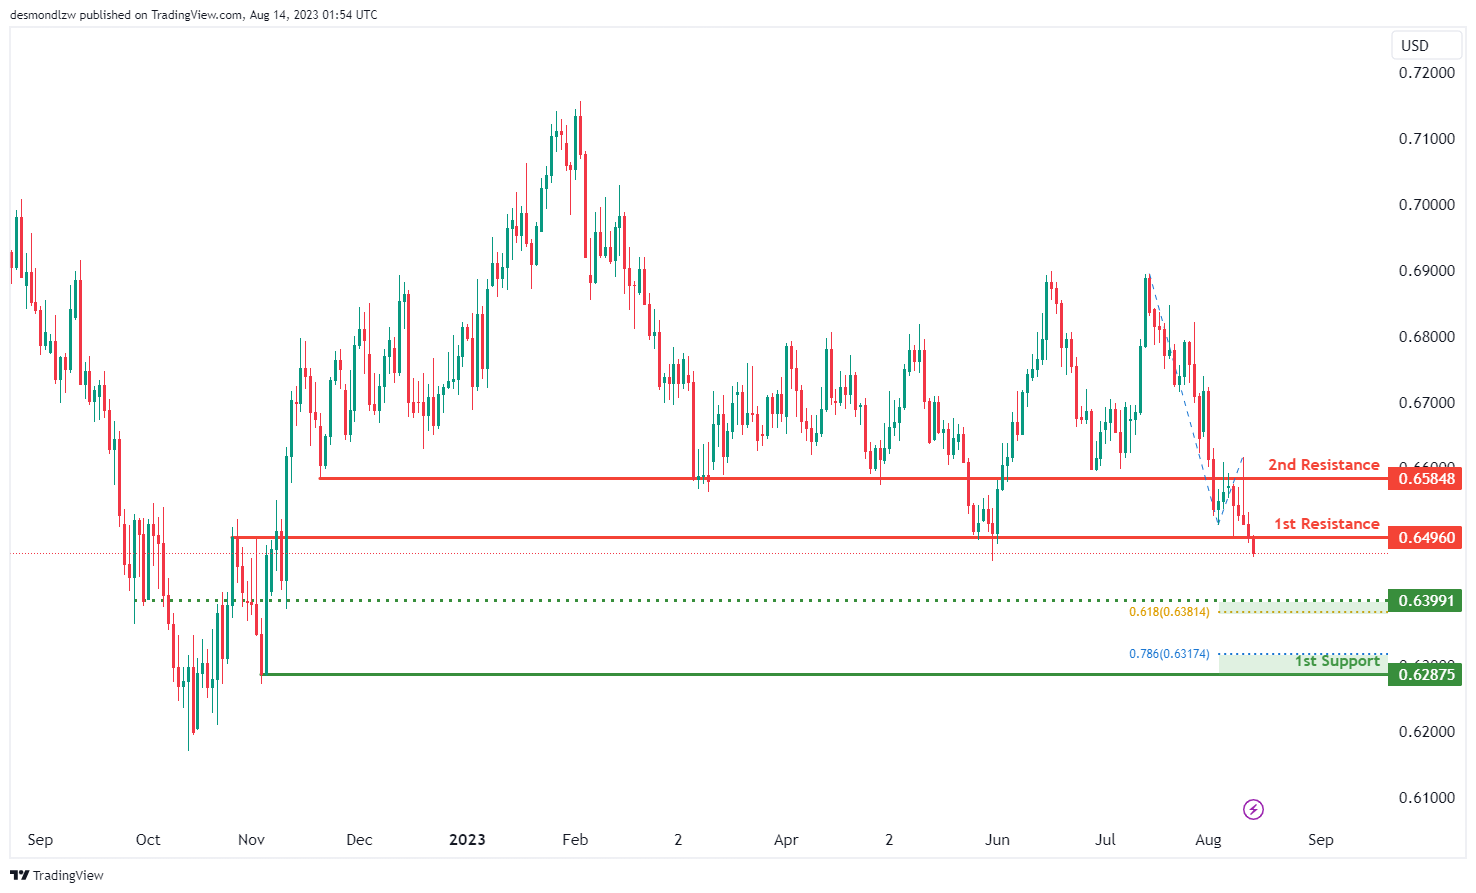
AUD/USD:
The current state of the AUD/USD chart indicates a bearish momentum, implying a downward movement towards the intermediate support level.
The intermediate support level at 0.6399 is supported by an overlap support that aligns closely with the 61.80% Fibonacci projection level. Further below, the 2nd support at 0.6288 is also recognized as a pullback support that is further reinforced by its alignment with the 78.60% Fibonacci projection level.
To the upside, the 1st resistance level at 0.6496 is marked by an overlap resistance. An additional barrier of resistance is observed at the 2nd resistance level of 0.6585 which is also identified as an overlap resistance.
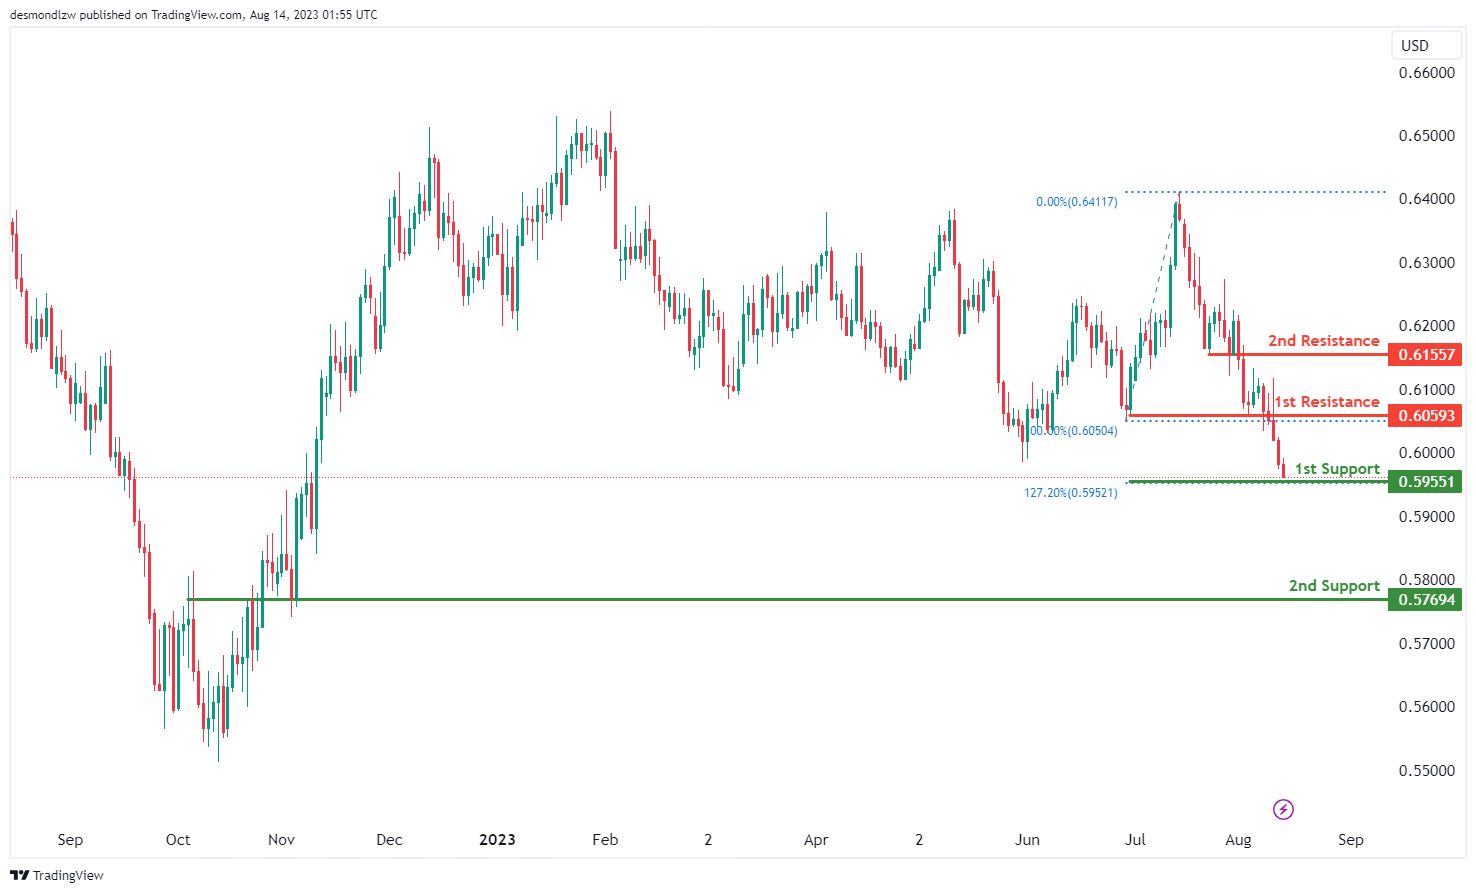
NZD/USD
The current trend of the NZD/USD chart indicates a bearish momentum, implying a downward movement. In this context, there is potential for the price to continue its bearish movement, targeting the 1st support level.
The 1st support level at 0.5955 is a support level that aligns with the 127.20% Fibonacci extension level. Additionally, the 2nd support is found at 0.5769 which is identified as a pullback support level.
To the upside, the 1st resistance level at 0.6059 is noteworthy as an overlap resistance. Furthermore, a 2nd resistance at 0.6156 is identified as a pullback resistance, acting as an additional barrier to upward price movement.
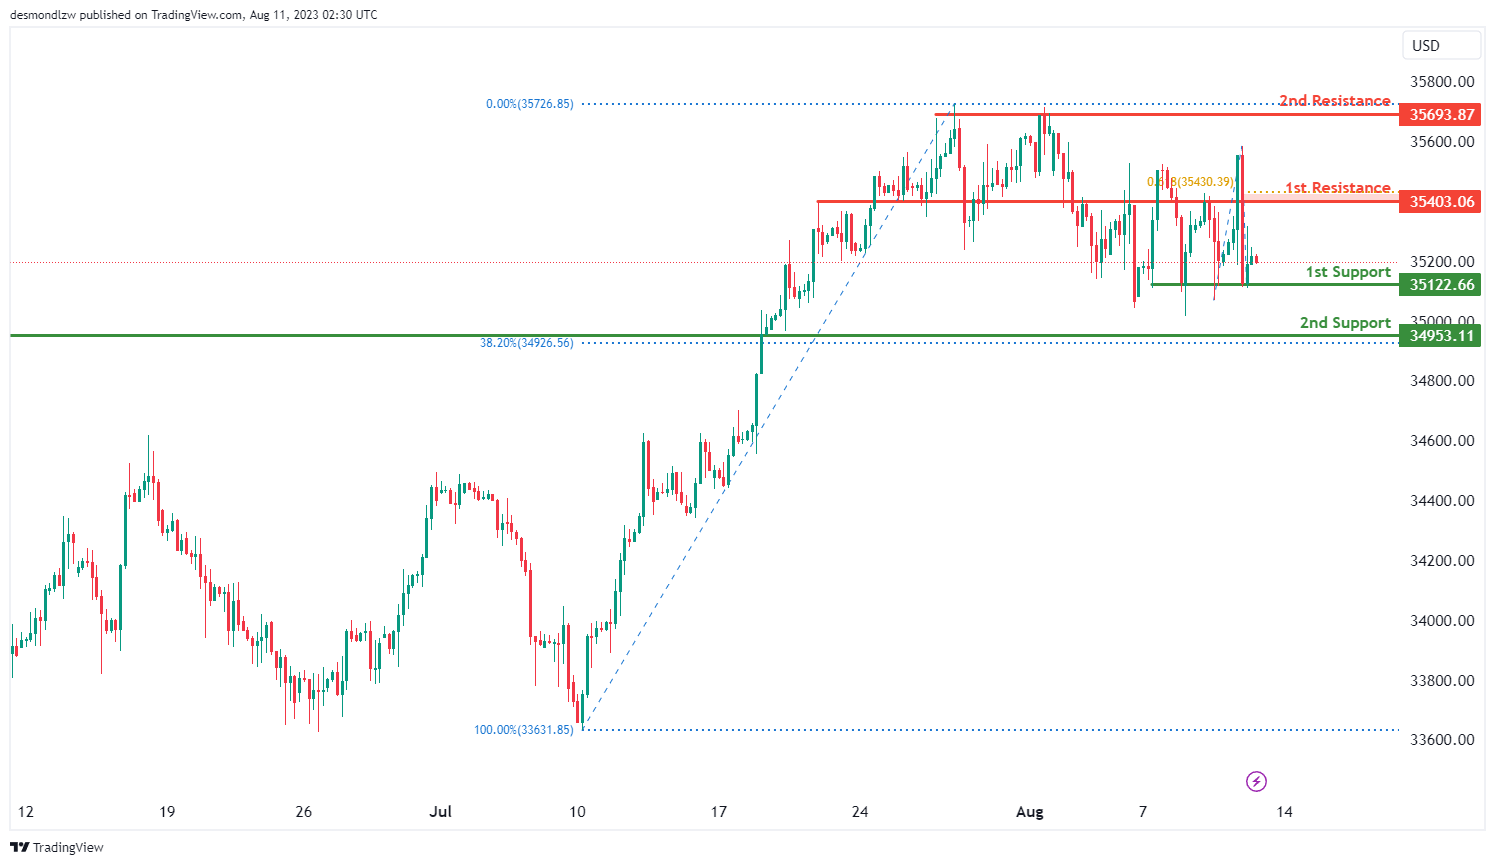
DJ30:
The current momentum of the DJ30 chart indicates a bearish direction, implying a prevailing downward trend.
In light of this bearish sentiment, the potential exists for the price to continue its bearish movement towards the support level at 35122.66, supported by multiple instances of swing low points. An additional support at 34953.11 is reinforced by pullback dynamics and a 38.20% Fibonacci retracement level.
On the flip side, the resistance at 35403.06 is notable for its overlap resistance and a 61.80% Fibonacci retracement level. Additionally, the presence of a 2nd resistance at 35693.87 gains importance due to its alignment with multiple instances of swing high resistance points.
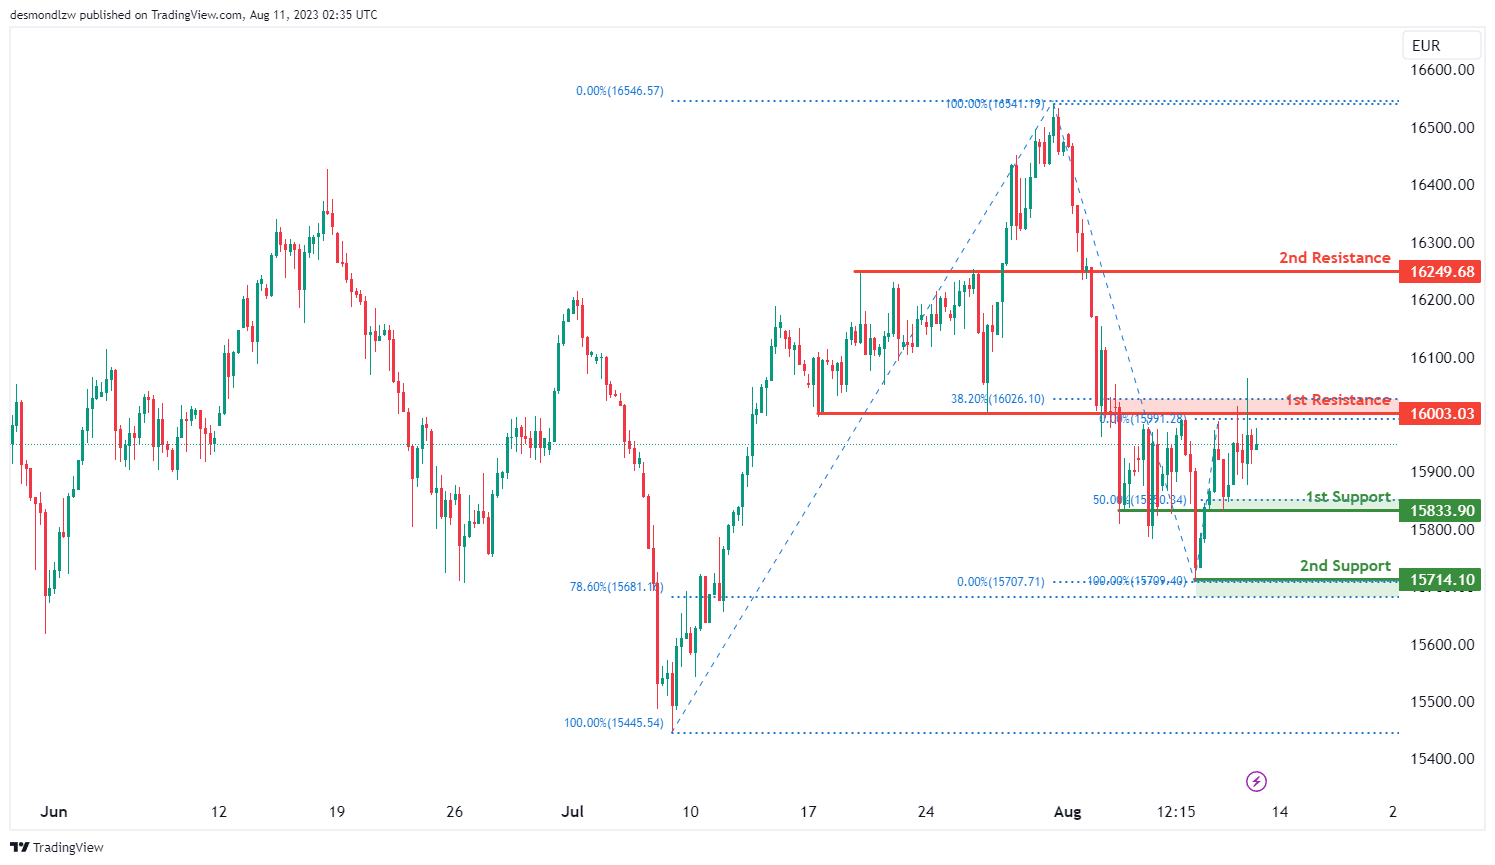
GER30:
The GER30 chart currently displays a bullish momentum, suggesting an ongoing upward trend.
In line with this bullish sentiment, there is potential for the price to continue its bullish movement towards the resistance level.
The support level at 15833.90 holds significance as it is marked by both an overlap support and a 50% Fibonacci retracement level. Further reinforcing the support structure, a 2ndary support is identified at 15714.10, characterized by its alignment with a 78.60% Fibonacci retracement level.
On the other hand, the resistance level at 16003.03 gains importance as it is associated with a pullback resistance and a 38.20% Fibonacci retracement level. Additionally, a 2nd resistance level at 16240.68 is notable for its overlap resistance, further contributing to its potential impact on price movements.
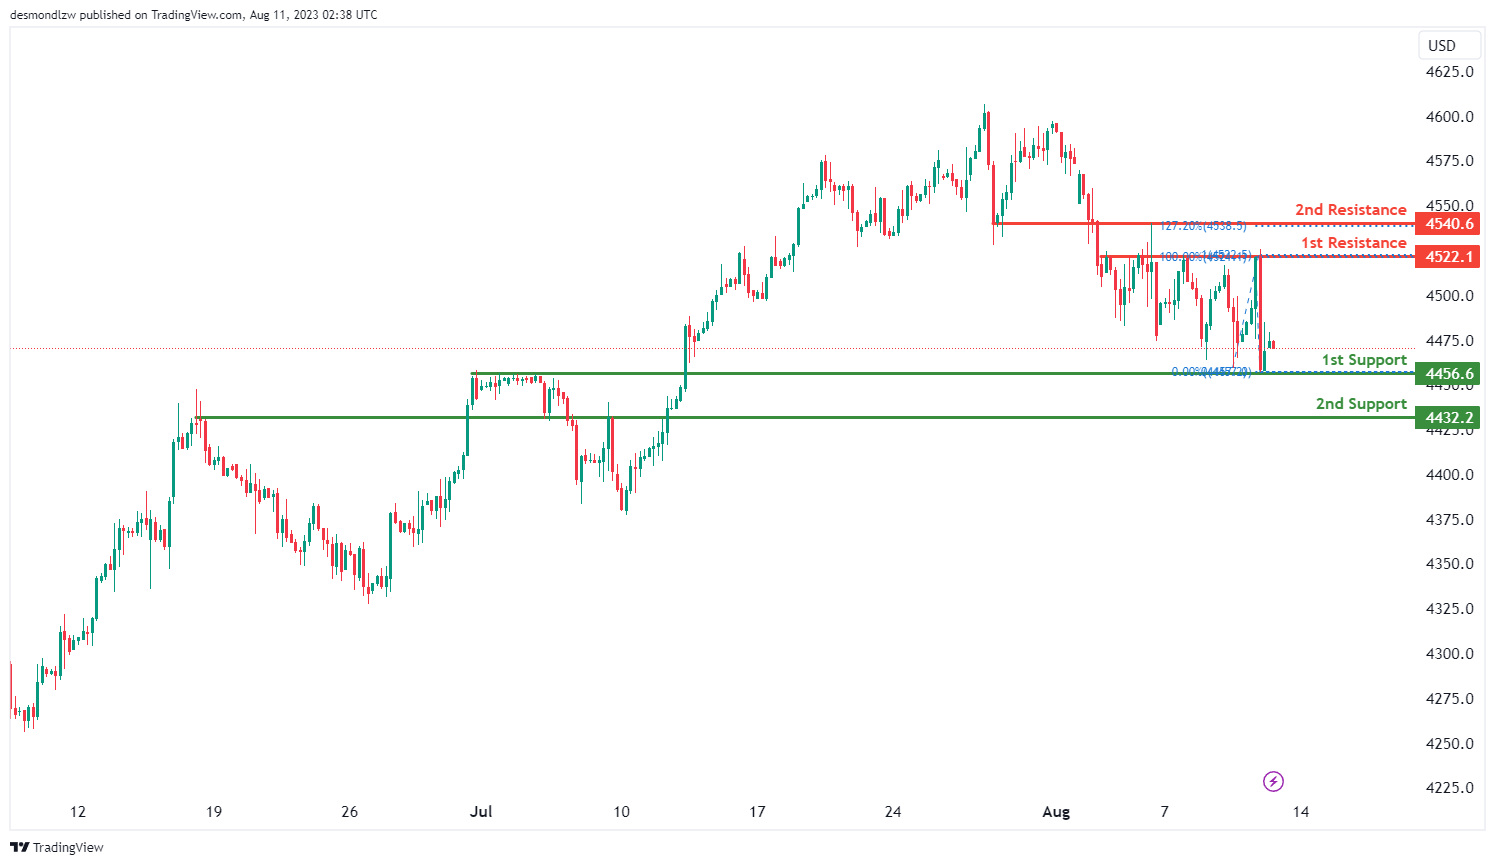
US500
The US500 chart currently exhibits a bullish momentum, indicating an ongoing upward trend. Given this bullish sentiment, there is potential for the price to continue its bullish movement towards the resistance level.
The support level at 4456.6 is highlighted as a pullback support. Additionally, there is a 2ndary support at 4432.2, identified as an overlap support.
On the other hand, the resistance level at 4522.1 holds significance as a multi-swing high resistance, reinforced by a 100% Fibonacci Projection.
Furthermore, a 2nd resistance level at 4540.6 is identified as a pullback resistance, which adds to its potential impact on potential price movement.
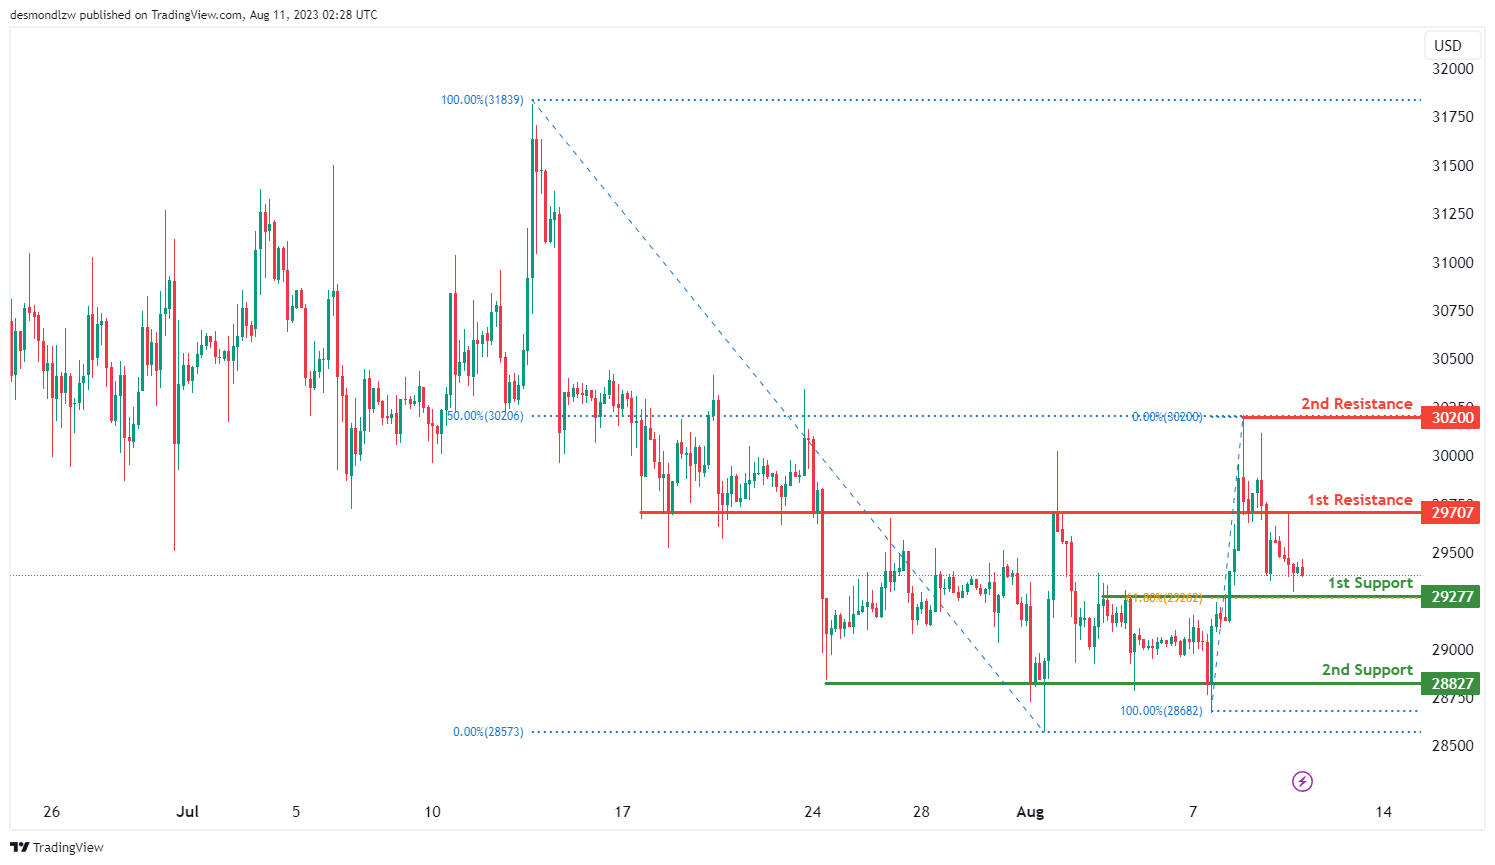
BTC/USD:
The BTC/USD chart shows a bearish overall momentum. There is a potential for a bearish continuation towards the 1st support level.
The 1st support is positioned at 29277 and is considered advantageous due to its pullback support and a 61.80% Fibonacci retracement. Furthermore, the 2nd support at 28827 is also seen as a valuable level because of its multi-swing low support characteristics.
On the resistance side, the 1st resistance level at 29707 is considered noteworthy as it represents an overlap resistance. Additionally, the 2nd resistance at 30200 is significant due to its swing high resistance and a 50% Fibonacci retracement.
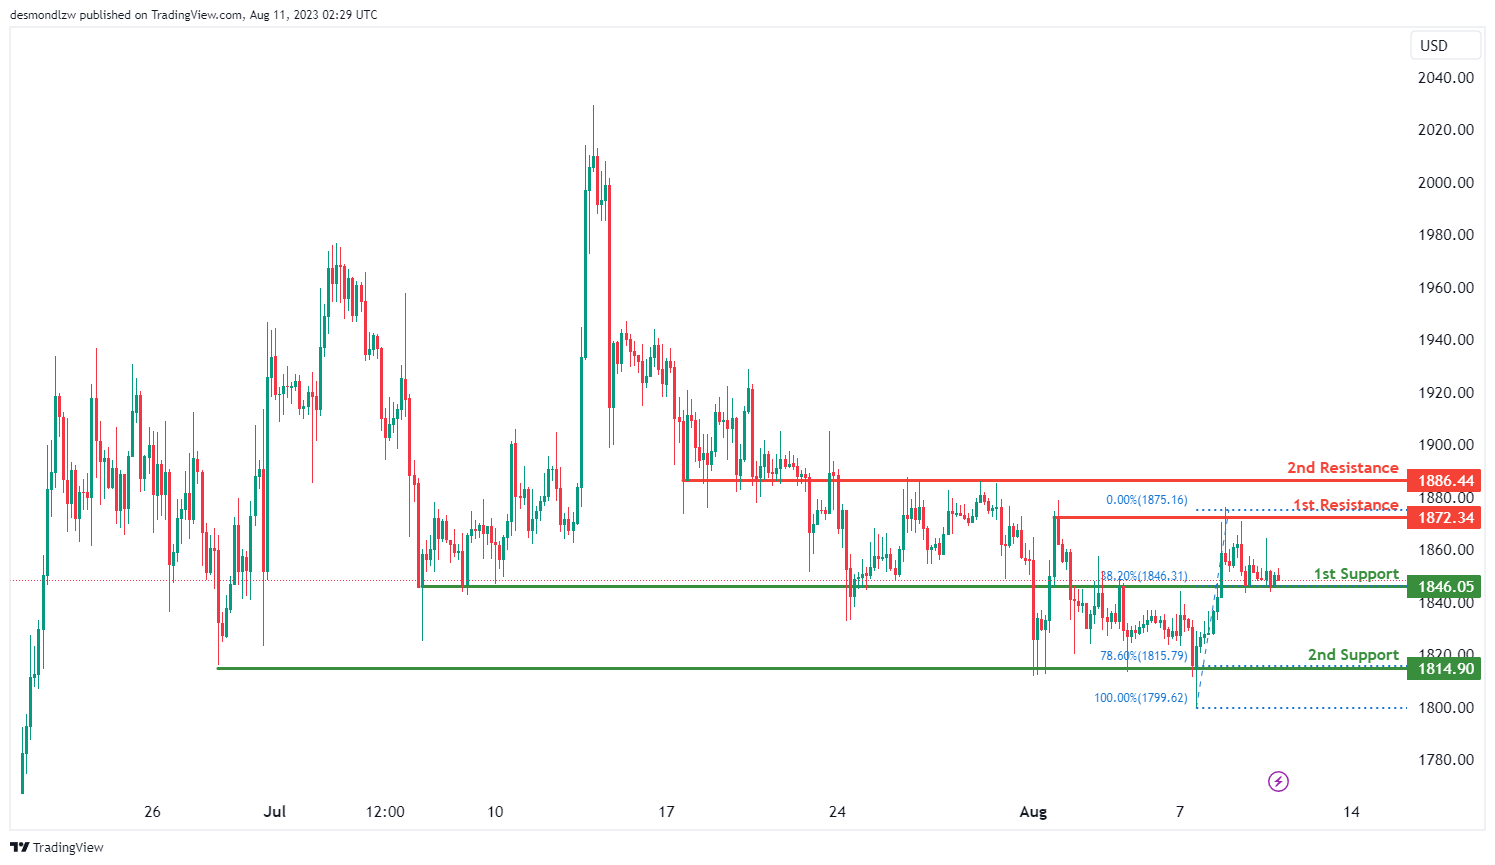
ETH/USD:
The ETH/USD chart indicates a bearish overall momentum. There is a potential for a bearish continuation towards the 1st support level.
The 1st support is located at 1816.05 and is considered favorable due to its overlap support and a 38.20% Fibonacci retracement. Additionally, the 2nd support at 1814.90 is also seen as a valuable level because of its multi-swing low support and a 78.60% Fibonacci retracement.
On the resistance side, the 1st resistance level at 1872.34 is noteworthy as it represents a multi-swing high resistance. Furthermore, the 2nd resistance at 1886.44 is considered significant due to its overlap resistance characteristics.
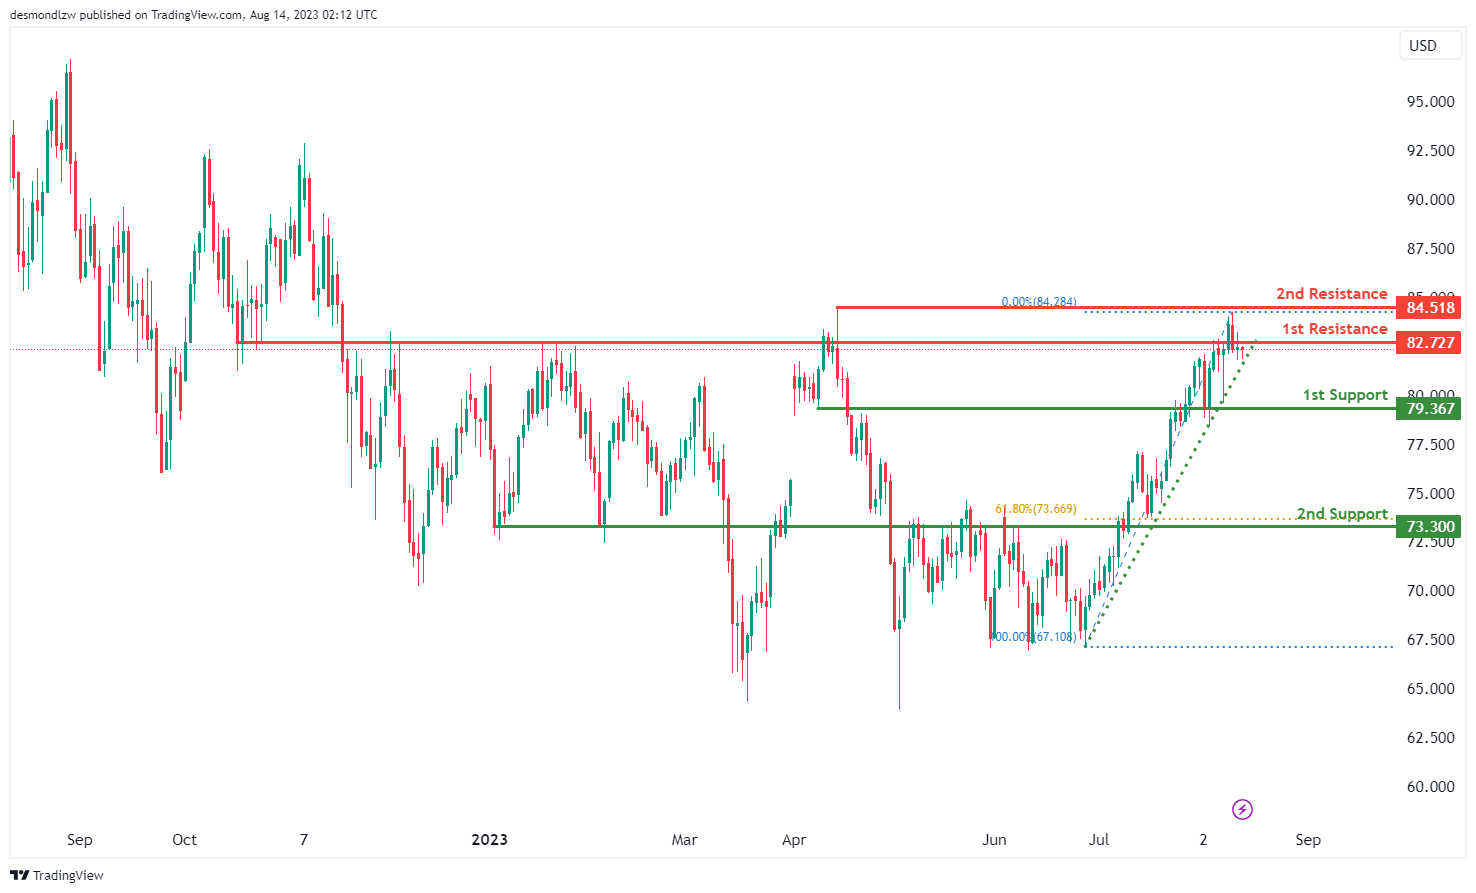
WTI/USD:
The current trend in the WTI/USD chart illustrates a weak bearish momentum, indicating a potential downward movement in the market. With this weak bearish sentiment, there is potential for the price to react off the 1st resistance and continue its downward momentum towards the 1st support level should the ascending trendline be broken.
The 1st support level at 79.37 is significant due to its alignment with a pullback support. Additionally, the 2nd support level at 73.30 is identified as an overlap support that aligns with the 61.80% Fibonacci retracement level.
To the upside, the 1st resistance level at 82.73 represents an overlap resistance. Furthermore, the presence of a 2nd resistance level at 84.52 represents a multi-swing high resistance.
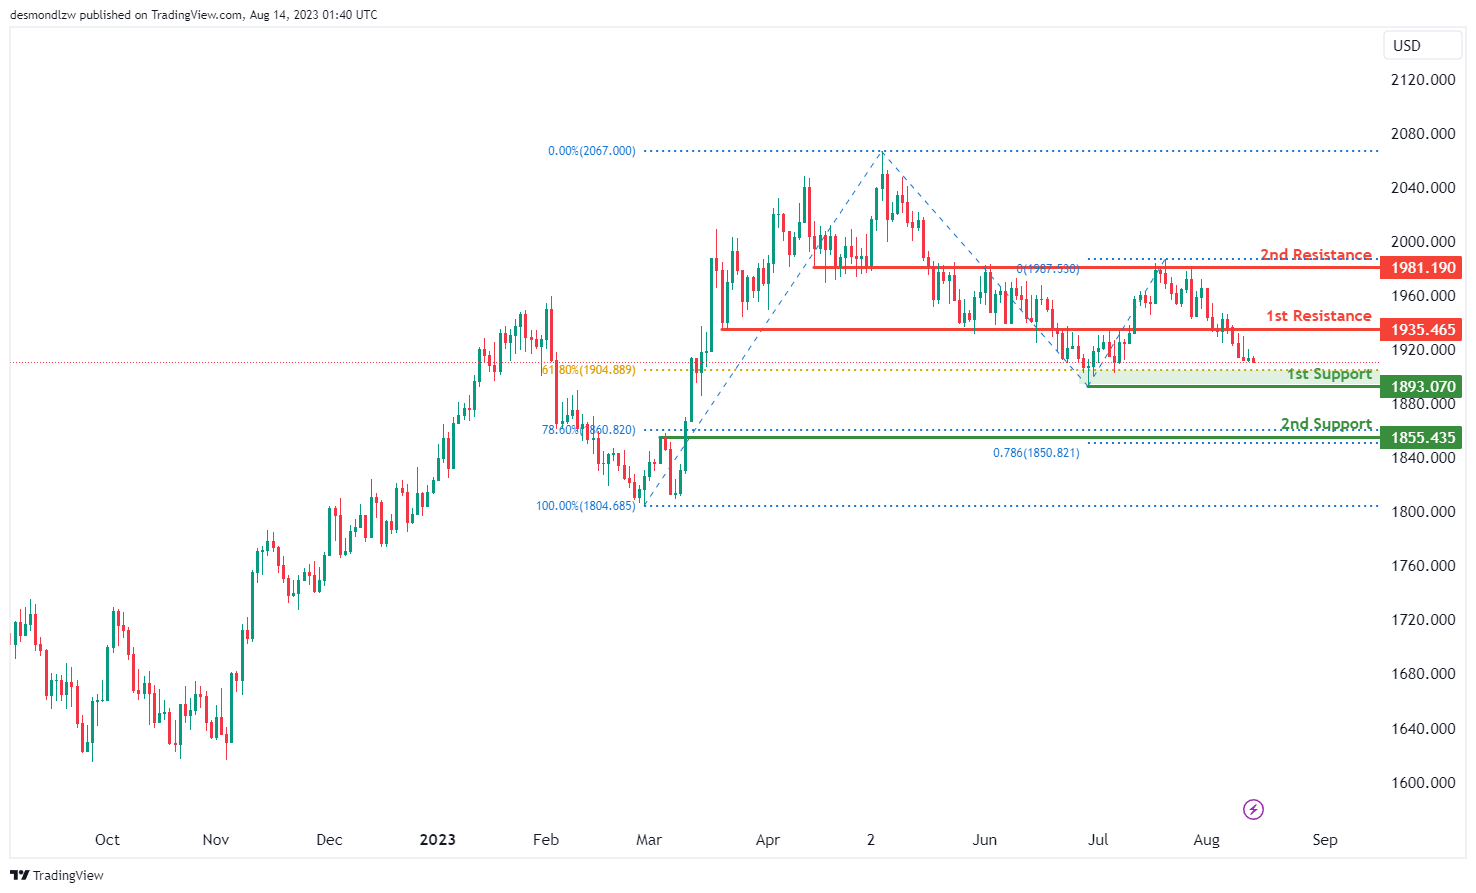
XAU/USD (GOLD):
The XAU/USD chart currently displays a bullish momentum, indicating a prevailing upward trend. This momentum suggests the possibility of a bullish bounce off the 1st support level, leading to a potential movement towards the 1st resistance.
The significance of the 1st support at 1893.07 is reinforced by its alignment with a 61.80% Fibonacci Retracement, reflecting a strong support level. Additionally, a 2nd support at 1855.43 further strengthens the potential for a bounce, as it coincides with both a 78.60% Fibonacci Retracement and a 78.60% Fibonacci Projection, demonstrating a notable Fibonacci confluence.
In contrast, the 1st resistance level at 1935.46 gains importance as a pullback resistance.
Moreover, another resistance level at 1981.19 is identified as an overlap resistance, enhancing its potential to influence future price movement.


