
- Last Friday’s price actions of spot Gold (XAU/USD) have managed to find support again at the 200-day moving average ahead of the US CPI data release & ECB monetary policy decision this week.
- The recent -5.15 % decline seen in Gold from its 20 July 2023 swing high of US$$1,987.53 has started to see some signs of short-term bullish reversal elements since 21 August 2023.
- The up-trending 10-year US Treasury real yield has also started to consolidate between 1.95% to 2.00% level which may negate the bearish tone on Gold at least in the short-term.
- US$1,910 support and US$1,932 resistance are the two key short-term technical levels to watch.
Since its 20 July 2023 swing high of US$1,987.53, spot Gold (XAU/USD) has declined by -5.15% to print a low of US$1,885 on 17 August 2023 in line with a rising longer-term 10-year US Treasury real yield which increased the opportunity costs of holding gold as it is a non-interest yielding asset.
Major uptrend remains intact
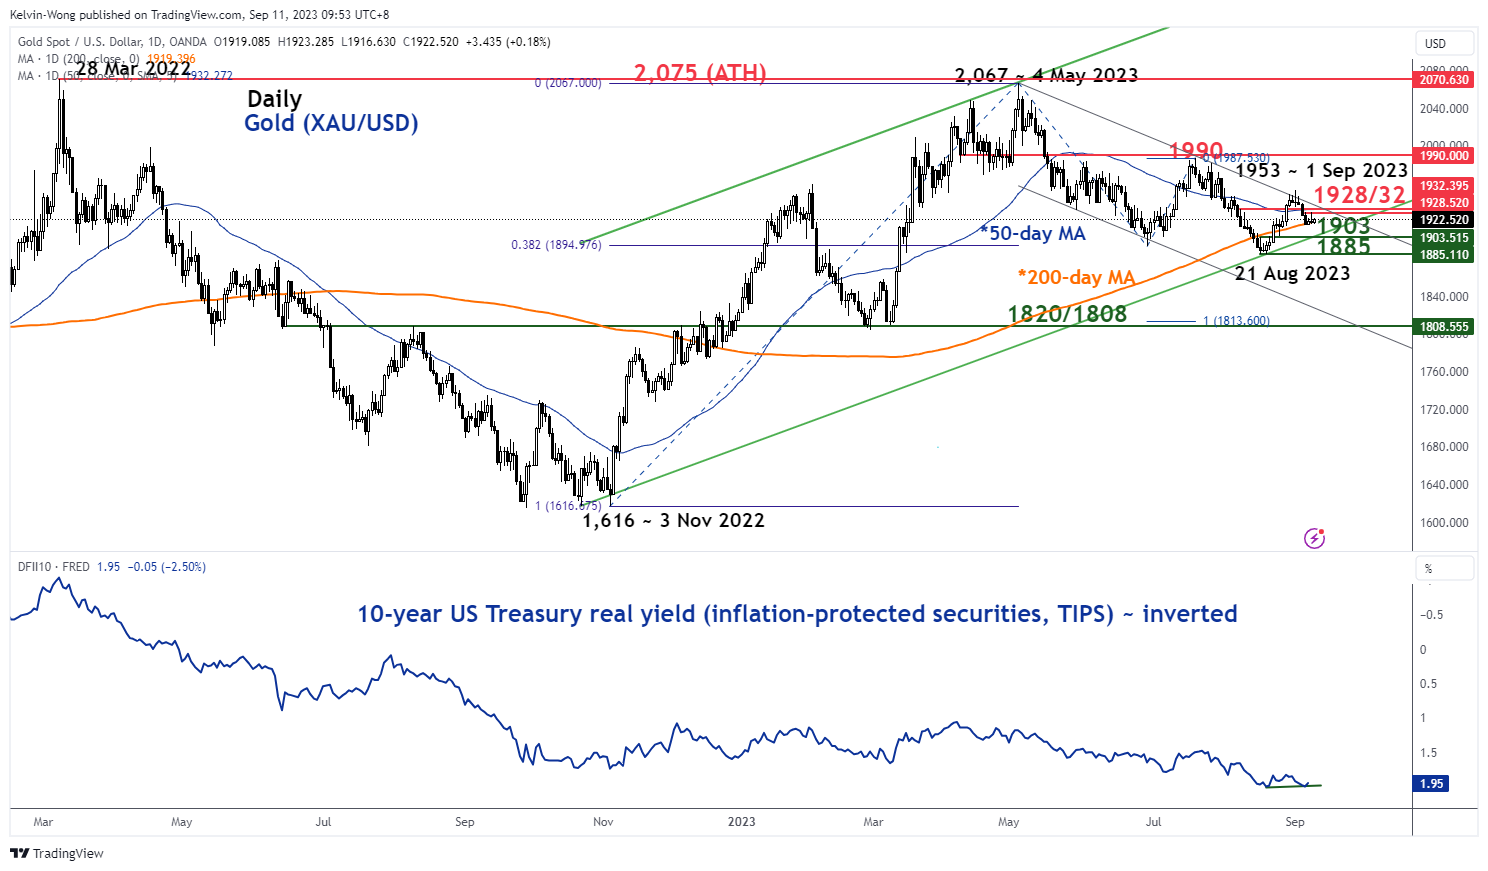
Fig 1: Gold (XAU/USD) major trend as of 11 Sep 2023 (Source: TradingView, click to enlarge chart)
Despite the underperformance of Gold seen in the past five weeks, its major uptrend phase in place since the 3 November 2022 low of US$1,616 remains intact as the -5.15% fall from the 20 July 2023 high of US$1,987.15 has managed to stall at the lower boundary of a major ascending channel from its 3 November 2022 major swing low and close to the 38.2% Fibonacci retracement of the prior major uptrend phase from 3 November 2022 low to 4 May 2023 high (see daily chair).
Also, the up-trending 10-year US Treasury real yield (derived via the inflation-protected securities, TIPS of the same duration) has started to consolidate at the 1.95% to 2.00% level which may negate the bearish tone on Gold at this juncture.
Short-term momentum has tilted toward the bullish camp
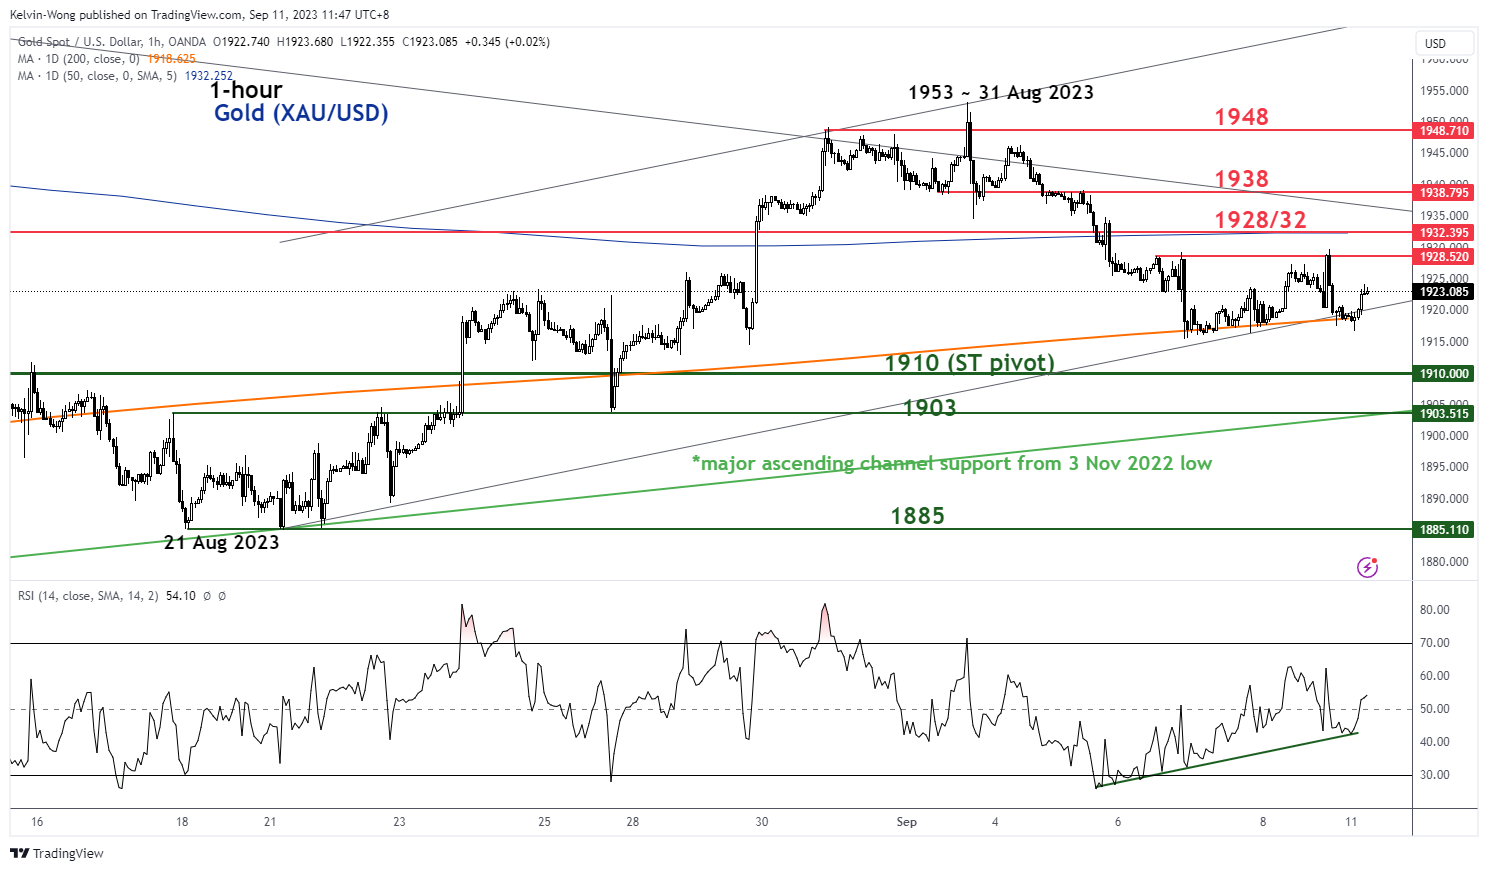
Fig 2: Gold (XAU/USD) minor short-term uptrend as of 11 Sep 2023 (Source: TradingView, click to enlarge chart)
Since 26 August 2023, the price actions of Gold (XAU/USD) have reintegrated back above the key 200-day moving average and its recent slide from its US$1,953 minor swing high of 1 September 2023 has managed to find support at the 200-day moving after a retest on it on last week, the lower boundary of a minor ascending channel from 21 August 2023 low and close to the 50% Fibonacci retracement of the recent minor uptrend from 21 August 2023 low to 1 September 2023 high.
In addition, the hourly RSI oscillator, a gauge of short-term momentum shaped a bullish divergence condition on 7 September 2023 and continued to trace out a series of “higher lows” thereafter.
These observations indicate a revival of short-term bullish momentum conditions that in turn advocates another round of minor potential up leg in Gold. Watch the US$1,910 key short-term pivotal support and a break above the intermediate resistance at US$1,932 (also the 50-day moving average) may see a further push-up for the next resistances to come in at US$1,938 and US$1,949.
On the other hand, failure to hold at US$1,910 invalidates the bullish scenario for a further slide to expose the major support at US$1,903.


 has declined by -5.15% to print a low of US$1,885 on 17 August 2023 in line with a rising longer-term 10-year US Treasury real yield which increased the opportunity costs of holding gold as it is a non-interest yielding asset.)