
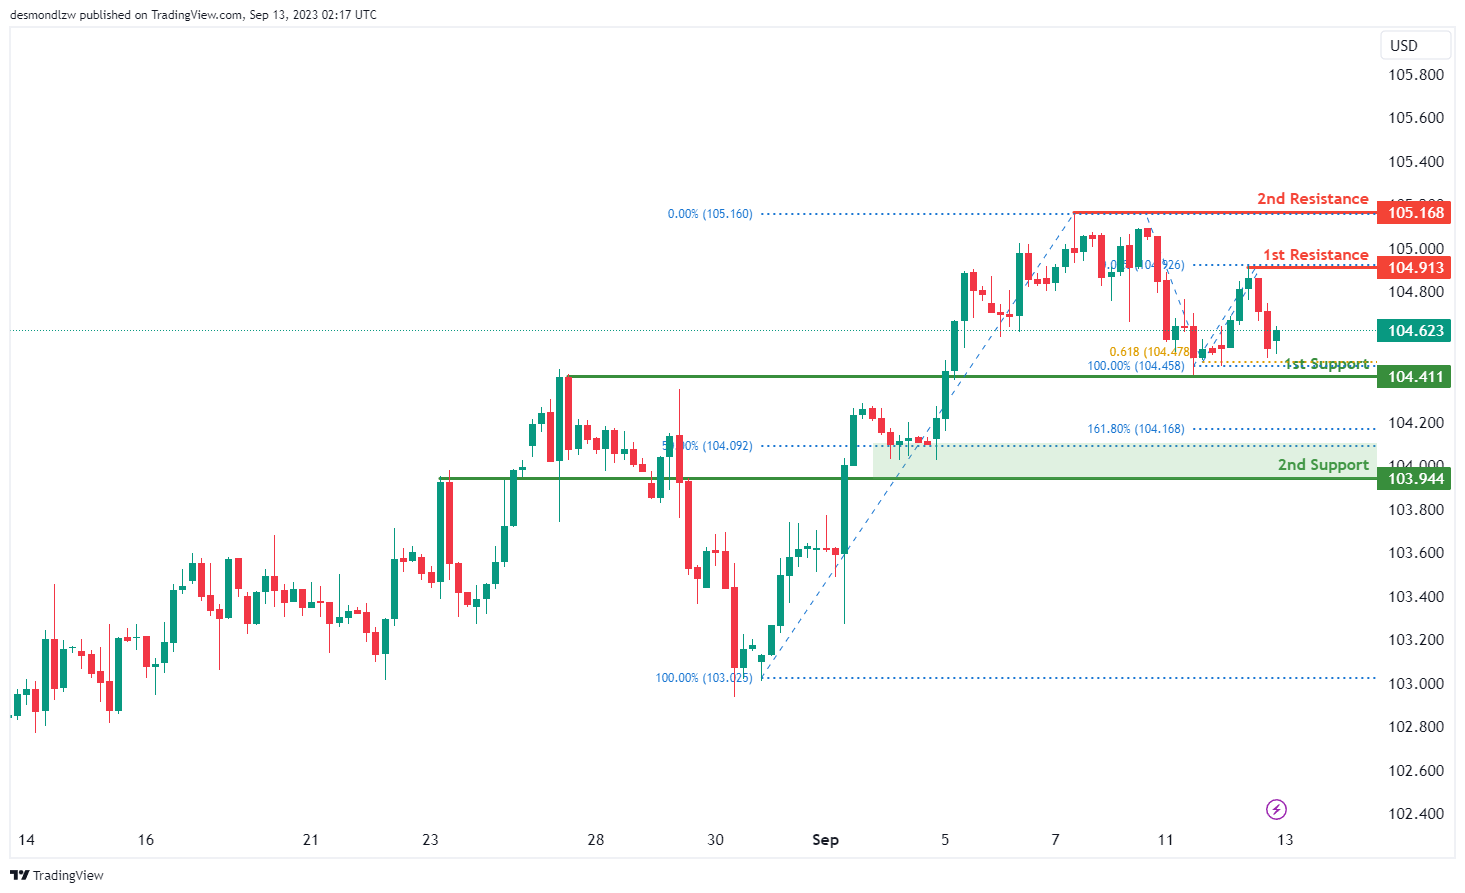
DXY:
The DXY (US Dollar Index) chart currently demonstrates a bullish momentum, indicating a potential upward trend in price movement. There’s a possibility of a bullish rebound from the 1st support level at 104.41, which is an overlap support. The 2nd support at 103.94 also reinforces the support zone as it aligns with a 50% Fibonacci Retracement level.
On the upside, the 1st resistance at 105.09 represents a multi-swing high resistance, indicating a level where price might face hurdles. Additionally, the 2nd resistance at 105.61, marked as the 161.80% Fibonacci Retracement level, further adds to the potential resistance.
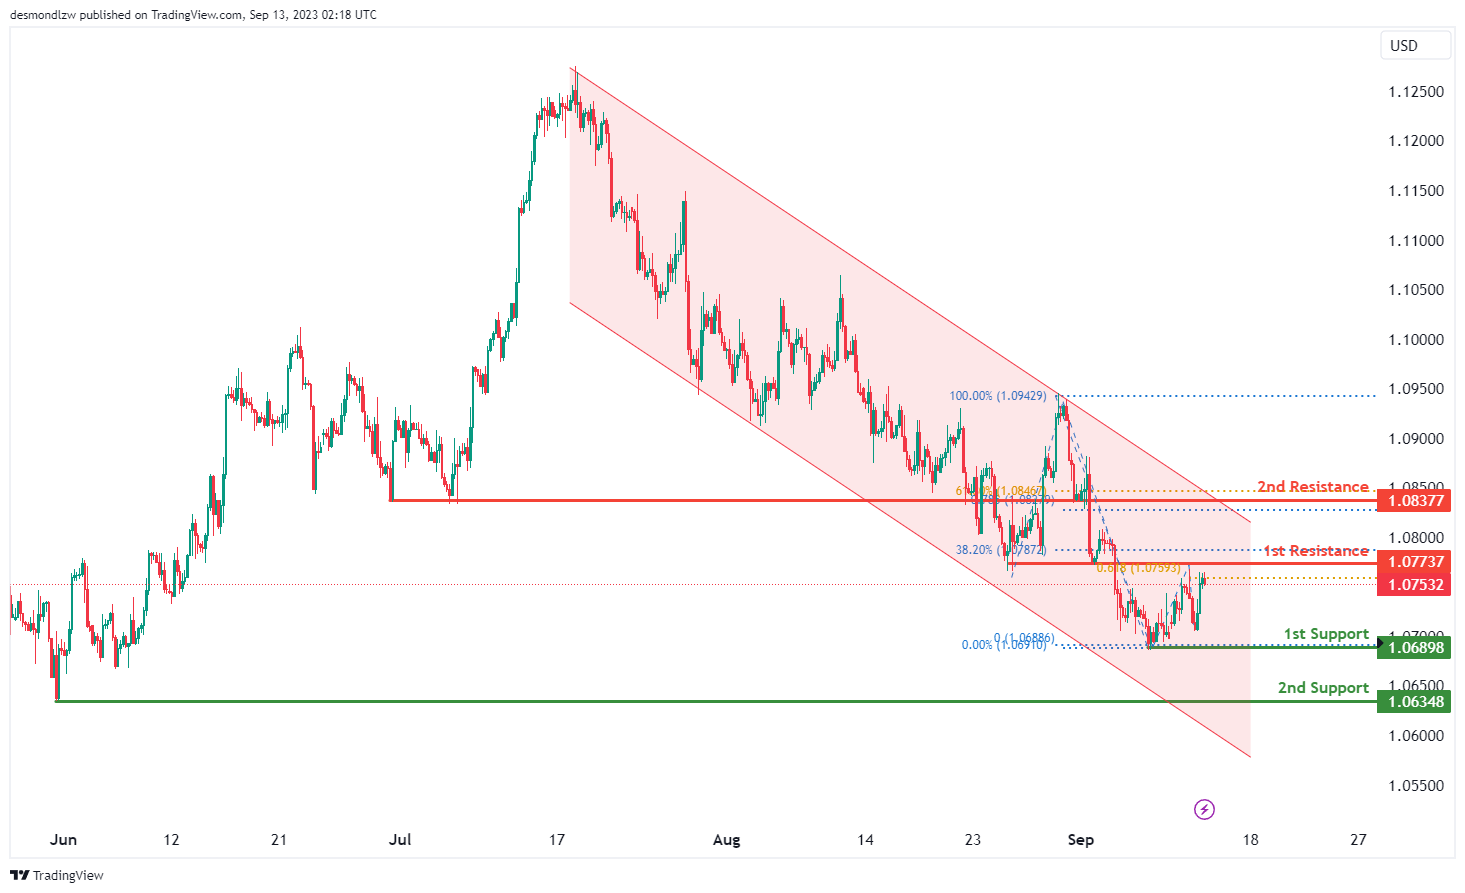
EUR/USD:
The EUR/USD chart currently maintains a bearish momentum, primarily driven by its movement within a bearish descending channel. This sets the stage for a potential bearish reaction at the 1st resistance level of 1.0773, which holds significance as an overlap resistance. This level aligns with both the 38.20% Fibonacci Retracement and the 61.80% Fibonacci Projection, signifying Fibonacci confluence.
On the downside, the 1st support at 1.0689 serves as a critical level for potential price rebounds, being a swing low support. Additionally, the 2nd support at 1.0634, also corresponding to a swing low support, reinforces its potential as a support zone.
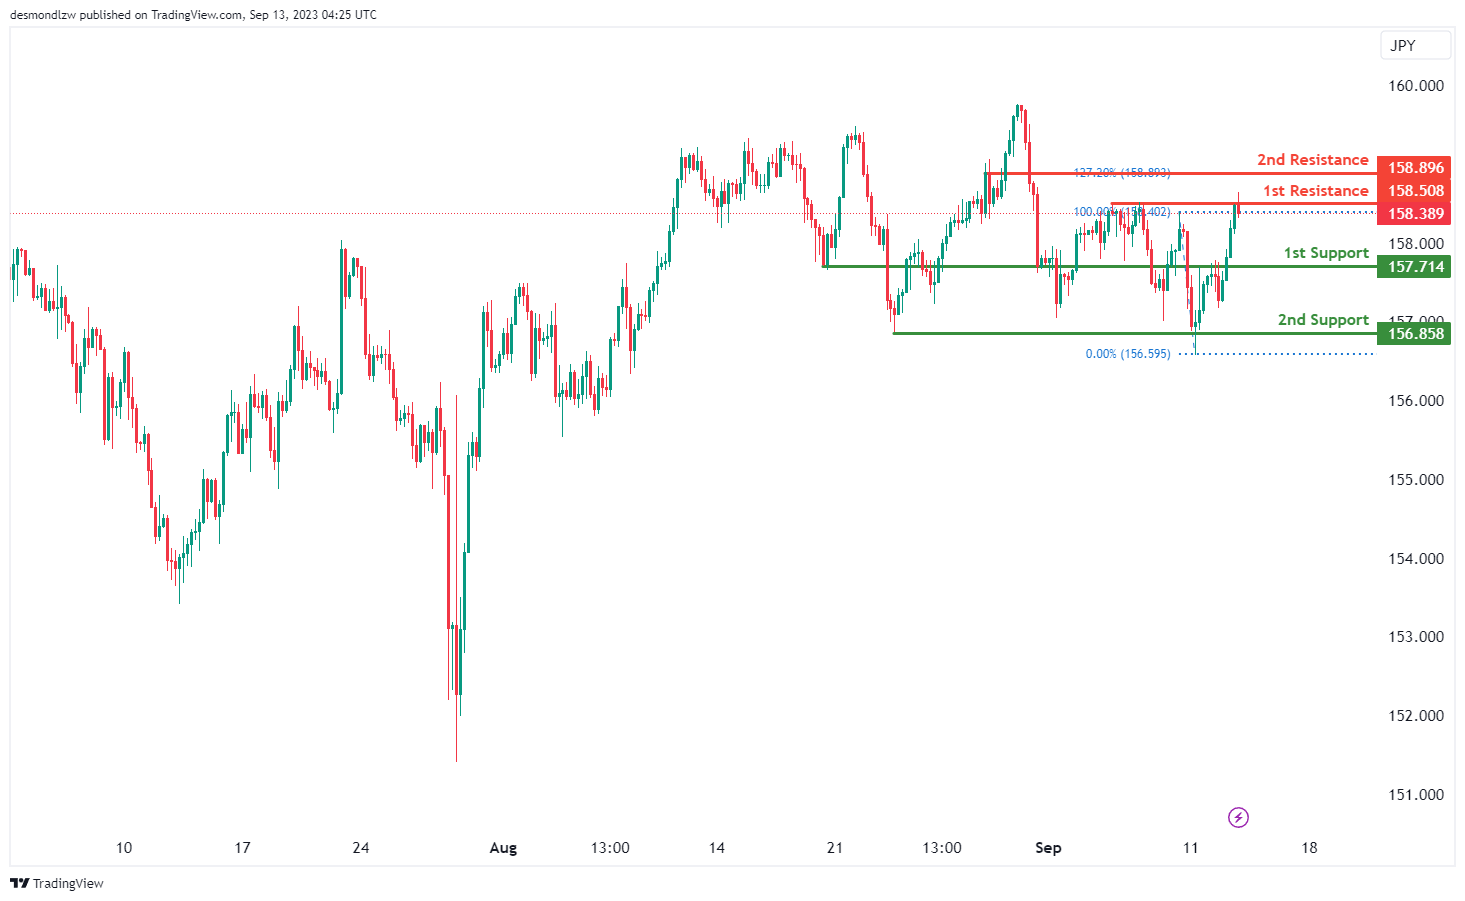
EUR/JPY:
For EUR/JPY, the overall momentum of the chart is currently bearish, indicating a downward trend.
There is potential for the price to have a bearish reaction off the 1st resistance level at 158.50 and drop to the 1st support at 157.71.
The 1st support at 157.71 is considered significant because it represents a pullback support, suggesting potential stability and support at this level.
In case of a more substantial decline, the 2nd support level at 156.85 is also noteworthy, representing multi-swing low support, offering additional reinforcement for the price.
On the upper side, the 1st resistance at 158.50 is considered important due to its characteristics as multi-swing high resistance.
Further upward movement could face resistance at the 2nd resistance level of 158.89, characterized as pullback resistance and aligned with the 127.20% Fibonacci Extension, potentially posing a significant barrier to the bullish momentum within the observed range.
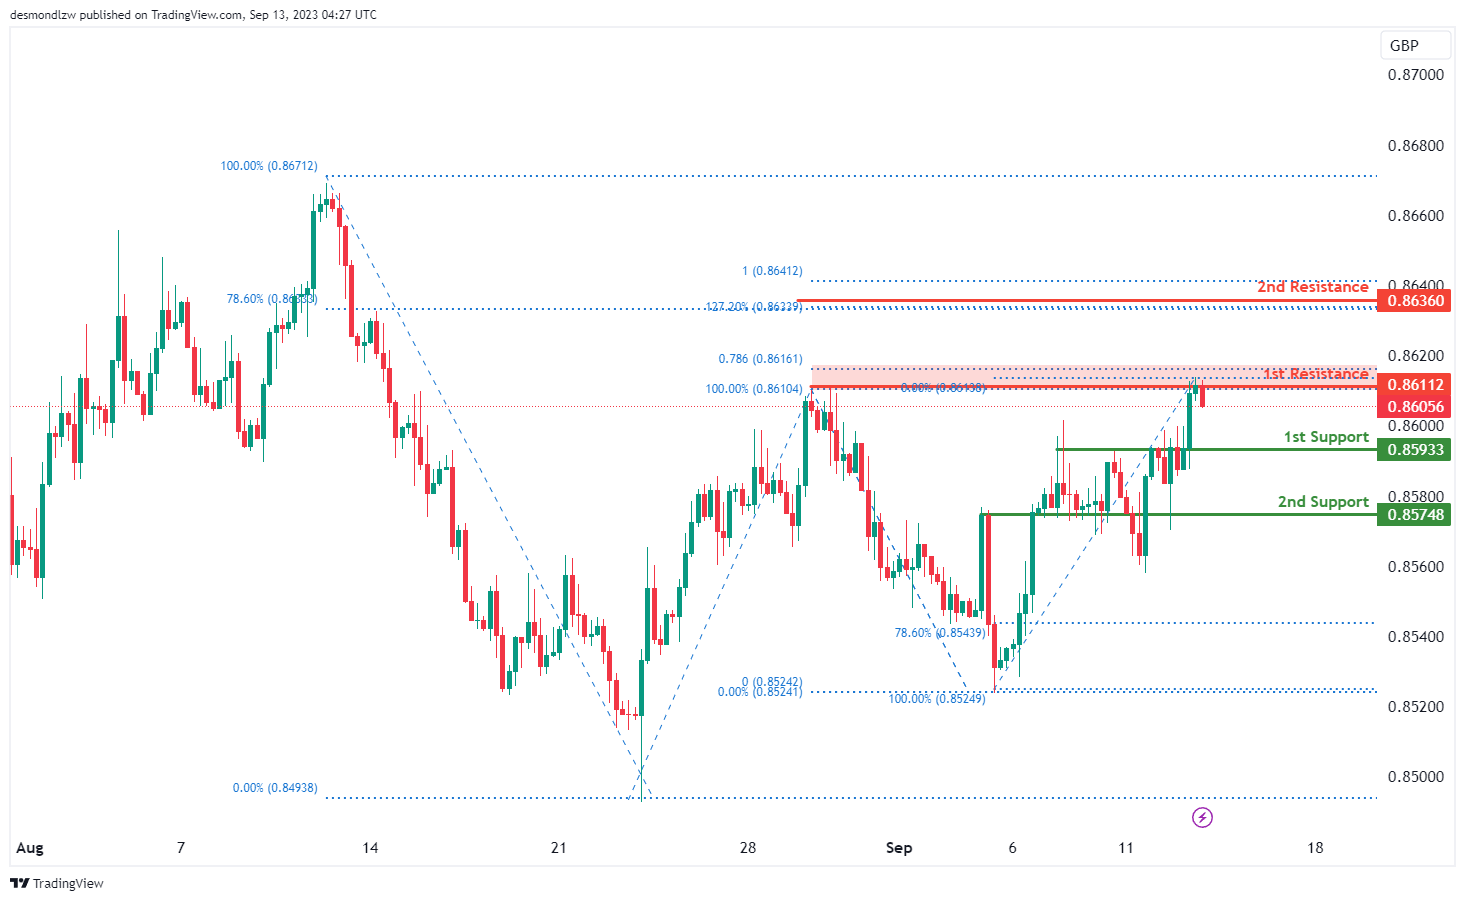
EUR/GBP:
For EUR/GBP, the overall momentum of the chart is currently bearish, indicating a downward trend.
There is potential for the price to continue its bearish movement towards the 1st support level at 0.8593. This 1st support is considered significant because it represents pullback support and aligns with the 23.60% Fibonacci Retracement, indicating potential stability and support at this level.
In case of a more substantial decline, the 2nd support level at 0.8574 is also noteworthy, as it represents an overlap support.
On the upper side, if there’s a reversal in the price, it may face resistance at the 1st resistance level of 0.8611, which is characterized as multi-swing high resistance and is supported by the 78.60% Fibonacci Projection.
Further upward movement could encounter resistance at the 2nd resistance level of 0.8636. This level is notable because it aligns with both the 127.20% Fibonacci Extension and the 78.60% Fibonacci Retracement, indicating strong potential resistance due to Fibonacci confluence.
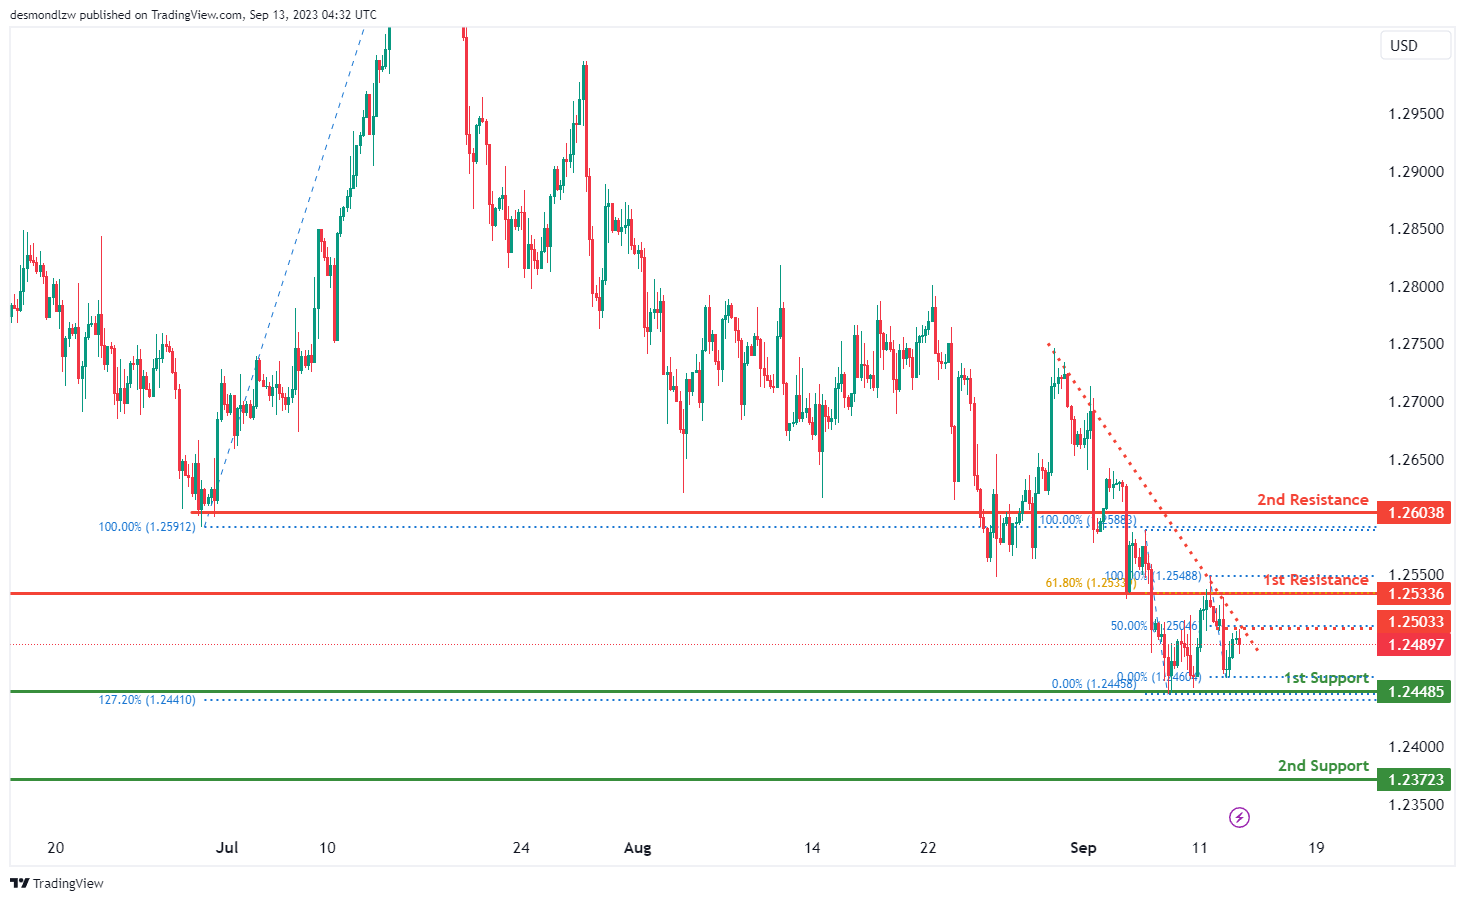
GBP/USD:
The GBP/USD chart currently displays a bearish overall momentum, with one significant contributing factor being its position below a major descending trendline, which suggests the potential for further bearish movement. In this scenario, there’s the likelihood of a bearish continuation towards the 1st support level at 1.2448, which is marked as an overlap support and is associated with the 127.20% Fibonacci Expansion. Additionally, the 2nd support at 1.2372 is also identified as an overlap support.
On the resistance side, the 1st resistance at 1.2533 serves as an overlap resistance, coinciding with the 61.80% Fibonacci Retracement, which adds to its significance. Similarly, the 2nd resistance at 1.2603 is characterized as an overlap resistance.
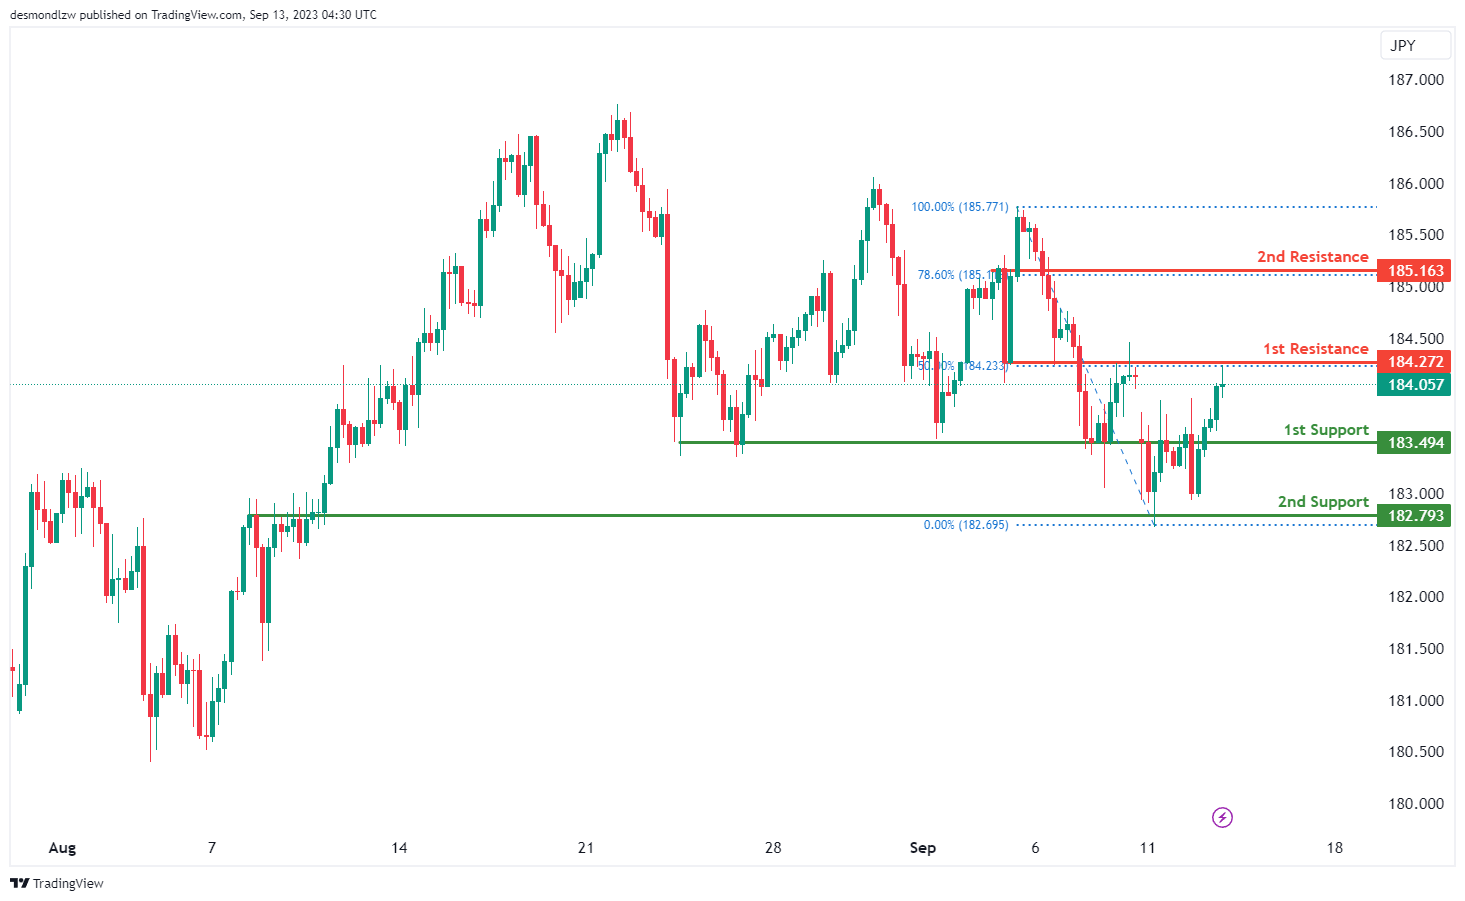
GBP/JPY:
For GBP/JPY, the overall momentum of the chart is currently bearish, indicating a downward trend.
There is potential for the price to have a bearish reaction off the 1st resistance level at 184.27 and drop to the 1st support at 183.49.
The 1st support at 183.49 is considered significant because it represents a pullback support.
In case of a more substantial decline, the 2nd support level at 182.79 is also noteworthy, representing an overlap support.
On the upper side, the 1st resistance at 184.27 is considered important due to its characteristics as an overlap resistance and its alignment with the 50% Fibonacci Retracement level.
Further upward movement could face resistance at the 2nd resistance level of 185.16, characterized as pullback resistance and aligned with the 78.60% Fibonacci Retracement, potentially posing a significant barrier to the bullish momentum within the observed range.
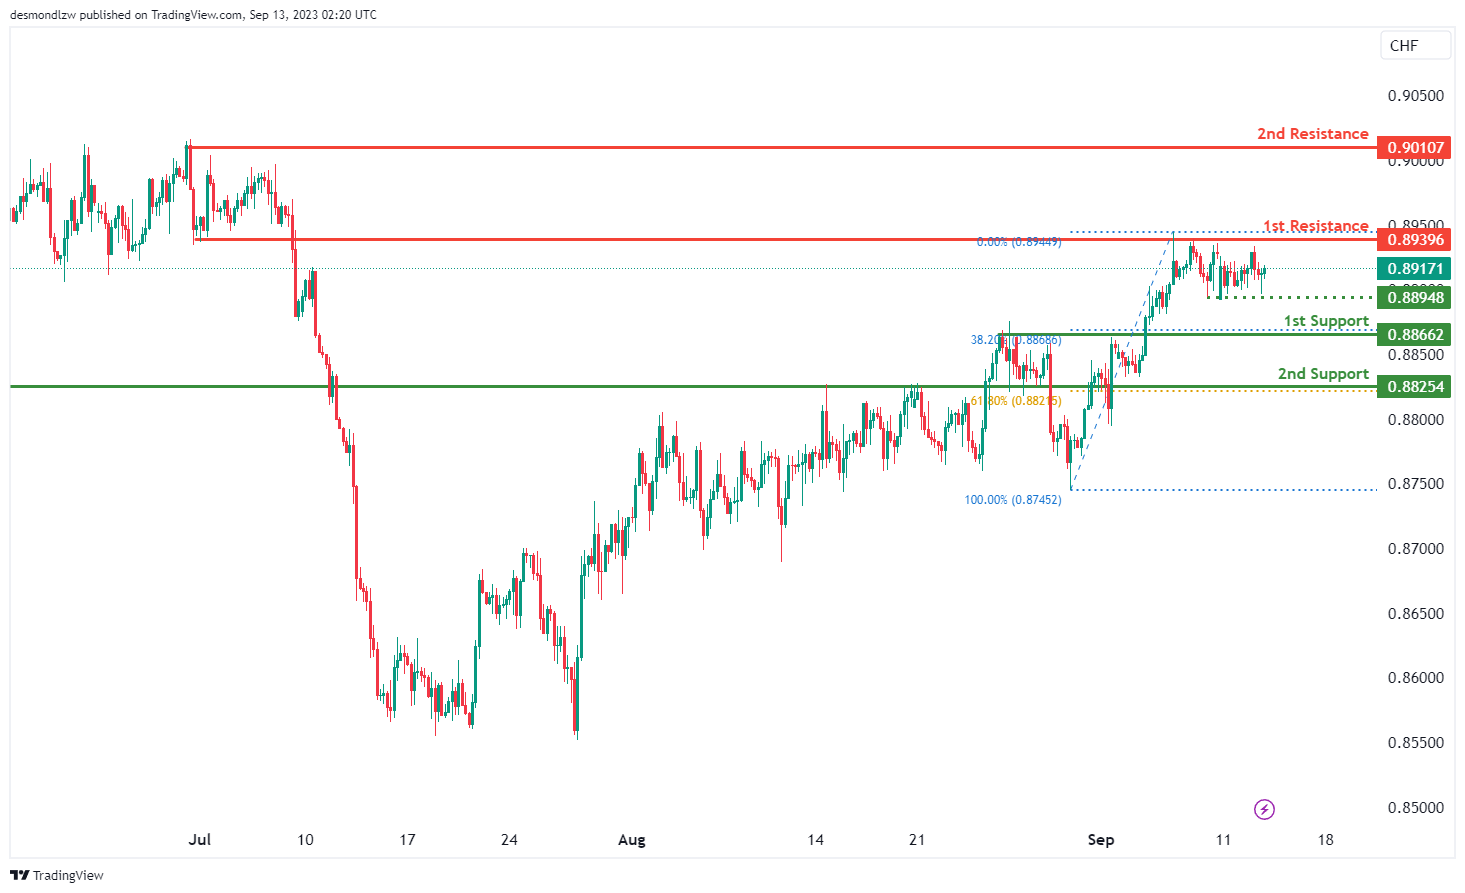
USD/CHF:
The USD/CHF chart currently exhibits a neutral overall momentum, indicating a lack of a clear bullish or bearish trend. In this context, there’s potential for price to fluctuate between the 1st support and 1st resistance levels.
The 1st support at 0.8866 is identified as a pullback support, while the 2nd support at 0.8825 also serves as a pullback support.
On the upside, the 1st resistance at 0.8939 is noted as an overlap resistance, and the 2nd resistance at 0.9010 is characterized as a swing high resistance.
Furthermore, there’s an intermediate support level at 0.8866, which is considered a multi-swing low support.
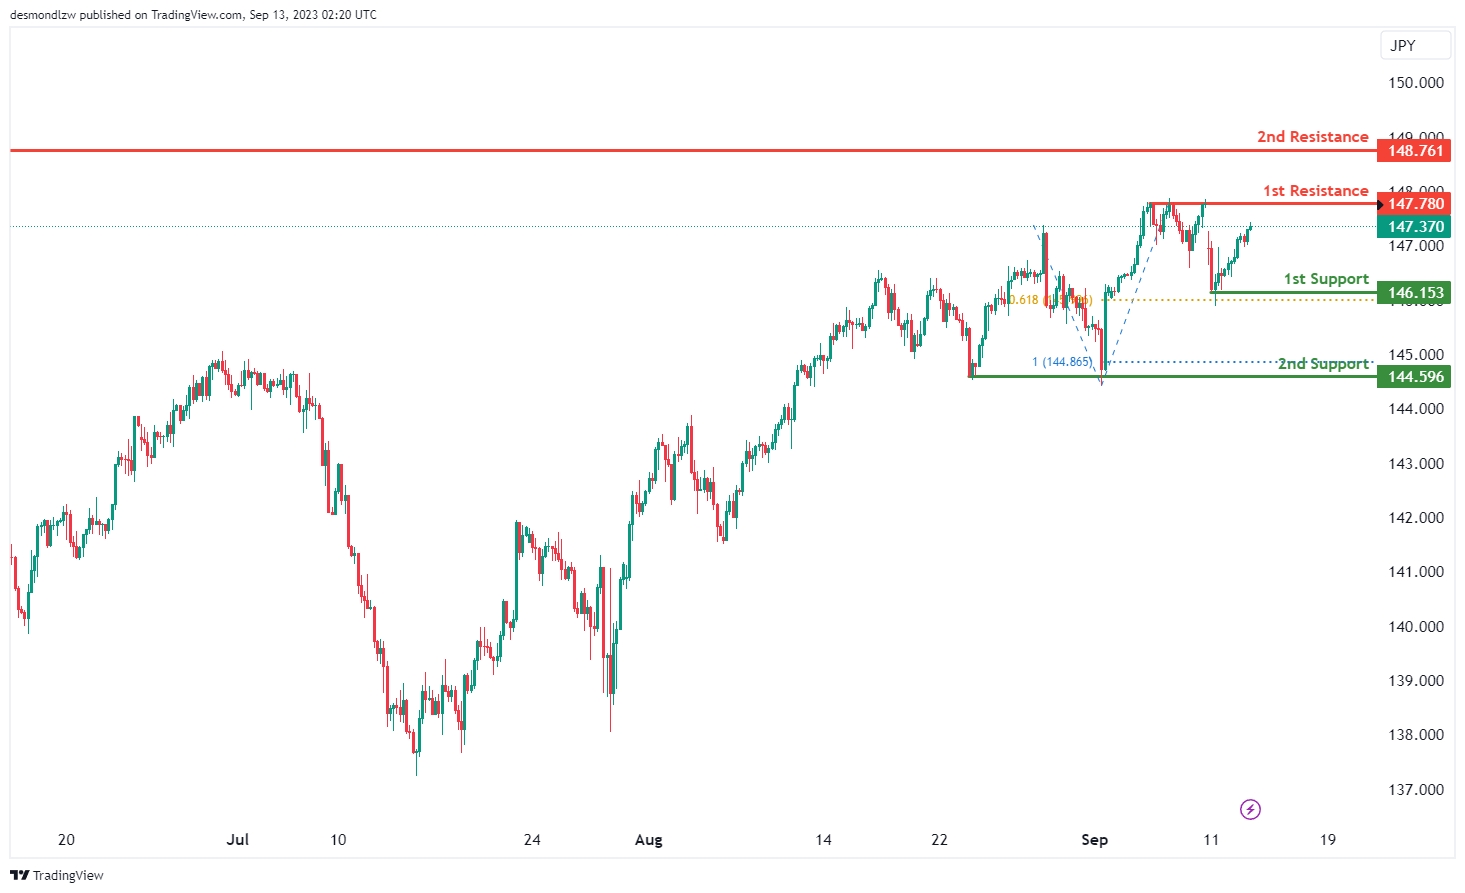
USD/JPY:
The USD/JPY chart currently demonstrates a neutral overall momentum, indicating a lack of a clear bullish or bearish trend. In this context, there’s potential for price to fluctuate between the 1st support and 1st resistance levels.
The 1st support at 146.15 is identified as a swing low support and aligns with the 61.80% Fibonacci Projection. Additionally, the 2nd support at 144.59 is characterized as a multi-swing low support, coinciding with the 100% Fibonacci Projection.
On the upside, the 1st resistance at 147.78 represents a multi-swing high resistance, while the 2nd resistance at 148.76 is marked as a swing high resistance.
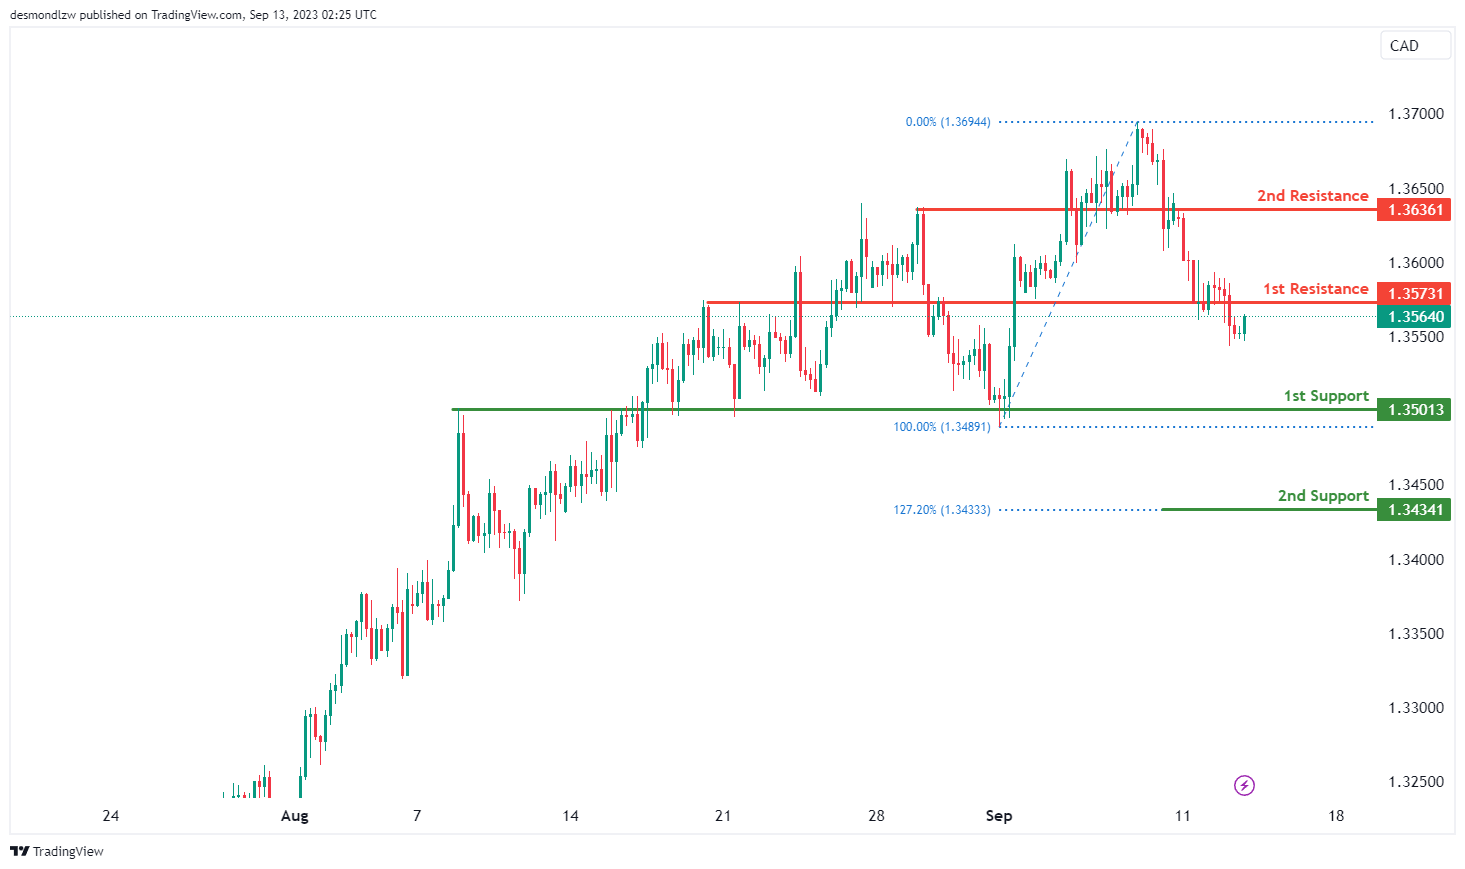
USD/CAD:
The USD/CAD chart currently displays an overall bullish momentum, suggesting a potential upward trend in price movement towards the 1st resistance.
The 1st resistance level at 1.3573 is identified as an overlap resistance while the 2nd resistance level at 1.3636 is also identified as an overlap resistance, indicating its significance as a potential barrier to further bullish movements.
To the downside, the 1st support level at 1.3501 is identified as an overlap support. Additionally, the 2nd support level at 1.3434 is marked as a pullback support that aligns with the 127.20% Fibonacci extension level, reinforcing its potential role as a support level.
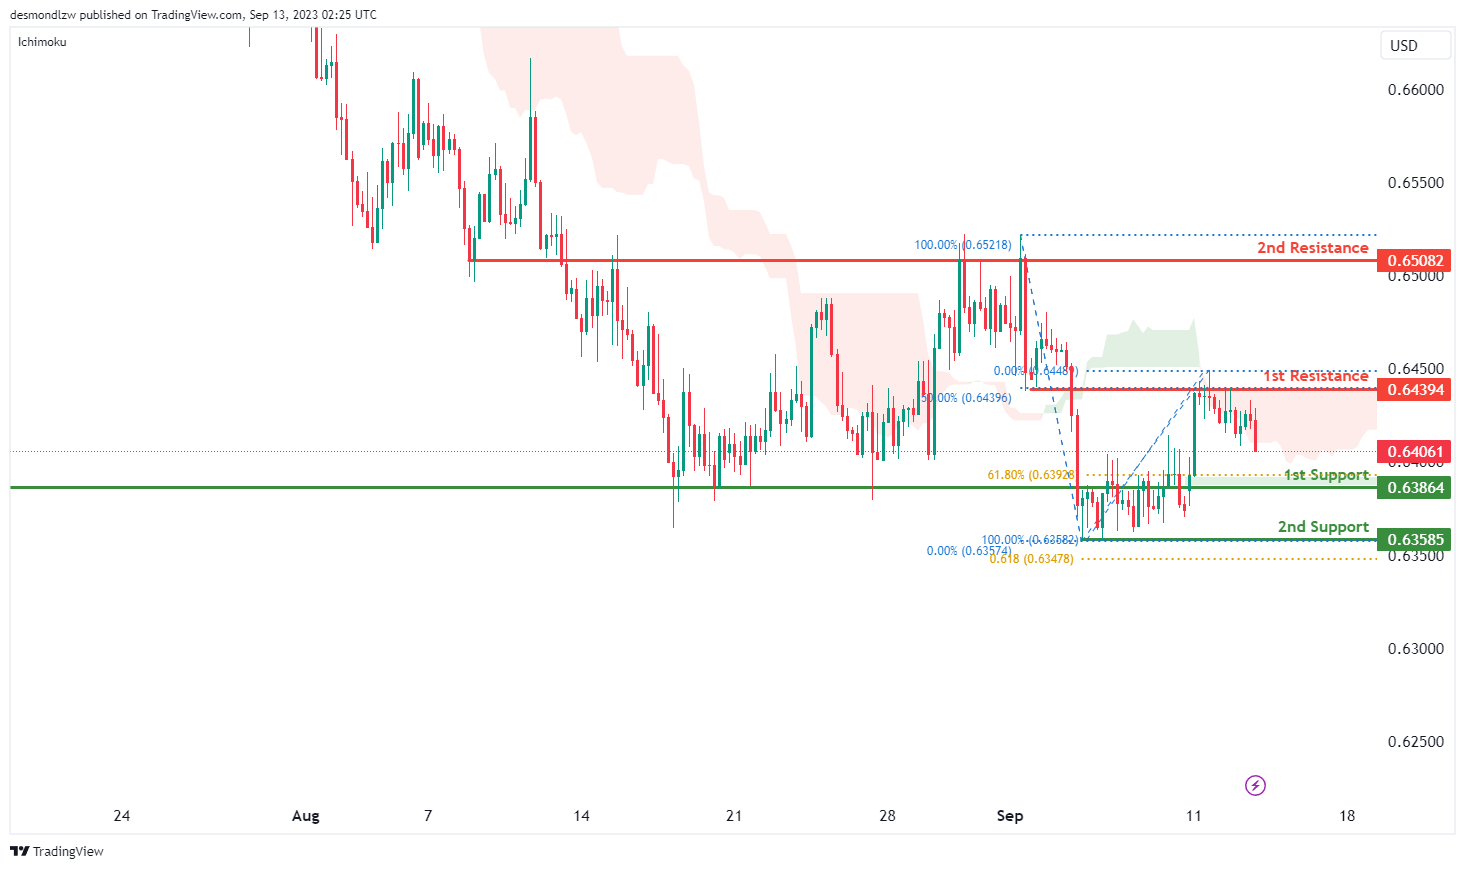
AUD/USD:
The AUD/USD chart currently exhibits an overall bearish momentum, driven by its position below the bearish Ichimoku cloud. There is a potential for a bearish continuation towards the 1st support level.
The 1st support level at 0.6386 is identified as an overlap support that aligns with the 61.80% Fibonacci retracement level. Furthermore, the 2nd support level at 0.6359 is marked as a pullback support that aligns with the 61.80% Fibonacci projection level, reinforcing its potential as a support level.
To the upside, the 1st resistance level at 0.6439 is identified as an overlap resistance that aligns with the 50.00% Fibonacci retracement level. Additionally, the 2nd resistance level at 0.6508 is also marked as an overlap resistance, indicating its significance as a potential barrier to further bullish movements.
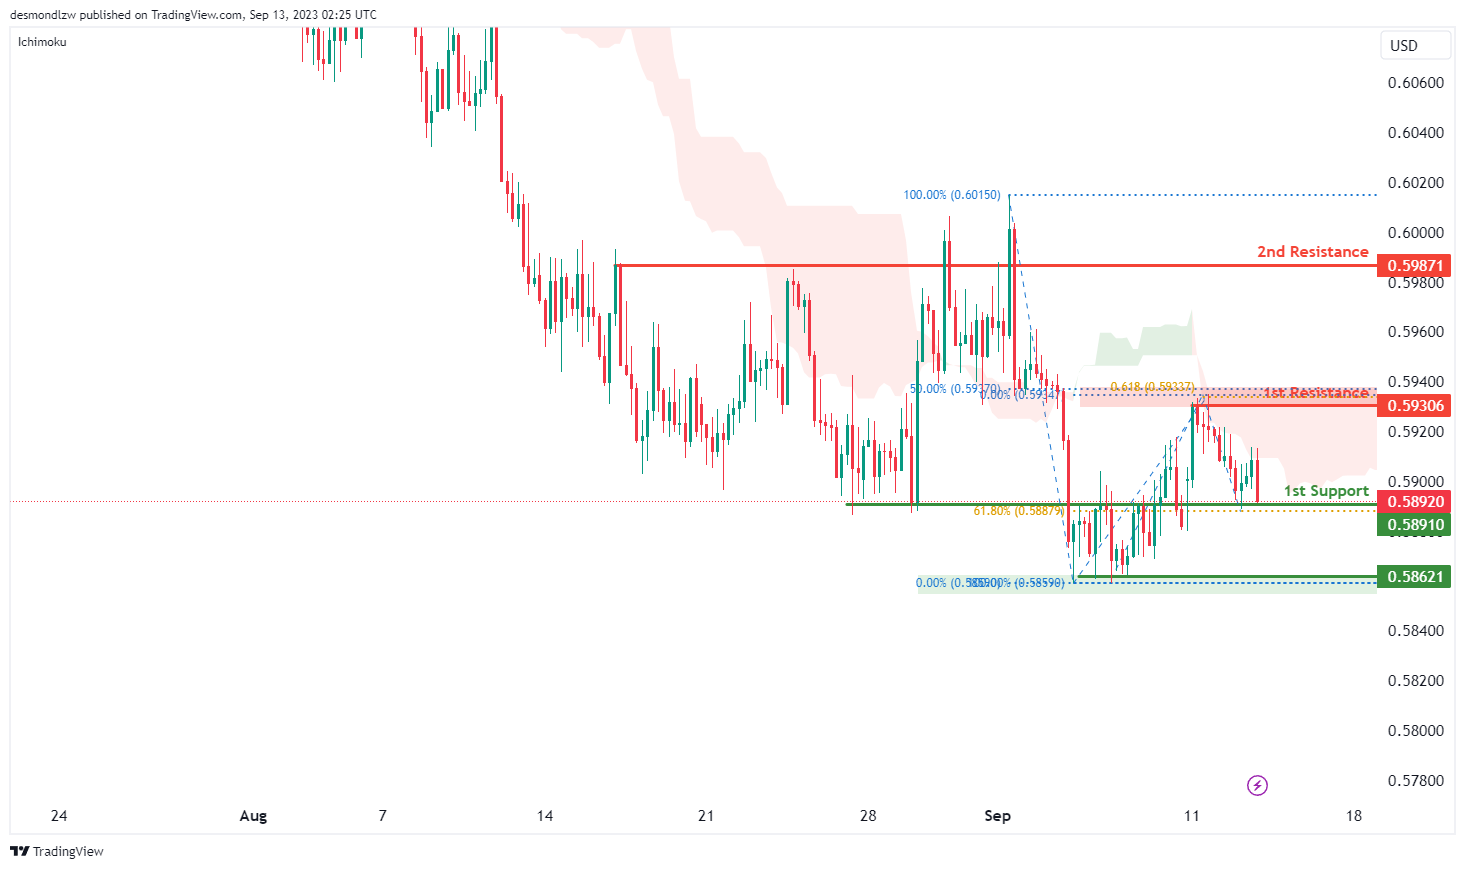
NZD/USD
The NZD/USD chart currently indicates an overall bearish momentum, supported by its position below the bearish Ichimoku cloud. There is a potential for price to experience a bearish breakout through the 1st support level to drop towards the 2nd support level.
The 1st support level at 0.5891 is identified as an overlap support that coincides with the 61.80% Fibonacci retracement level while the 2nd support level at 0.5862 is marked as a pullback support.
To the upside, the 1st resistance level at 0.5931 is identified as an overlap resistance that aligns with a confluence of Fibonacci levels i.e. the 50.00% retracement and the 50% projection levels, indicating a potential area of resistance. Additionally, the 2nd resistance level at 0.5987 is noted as an overlap resistance.
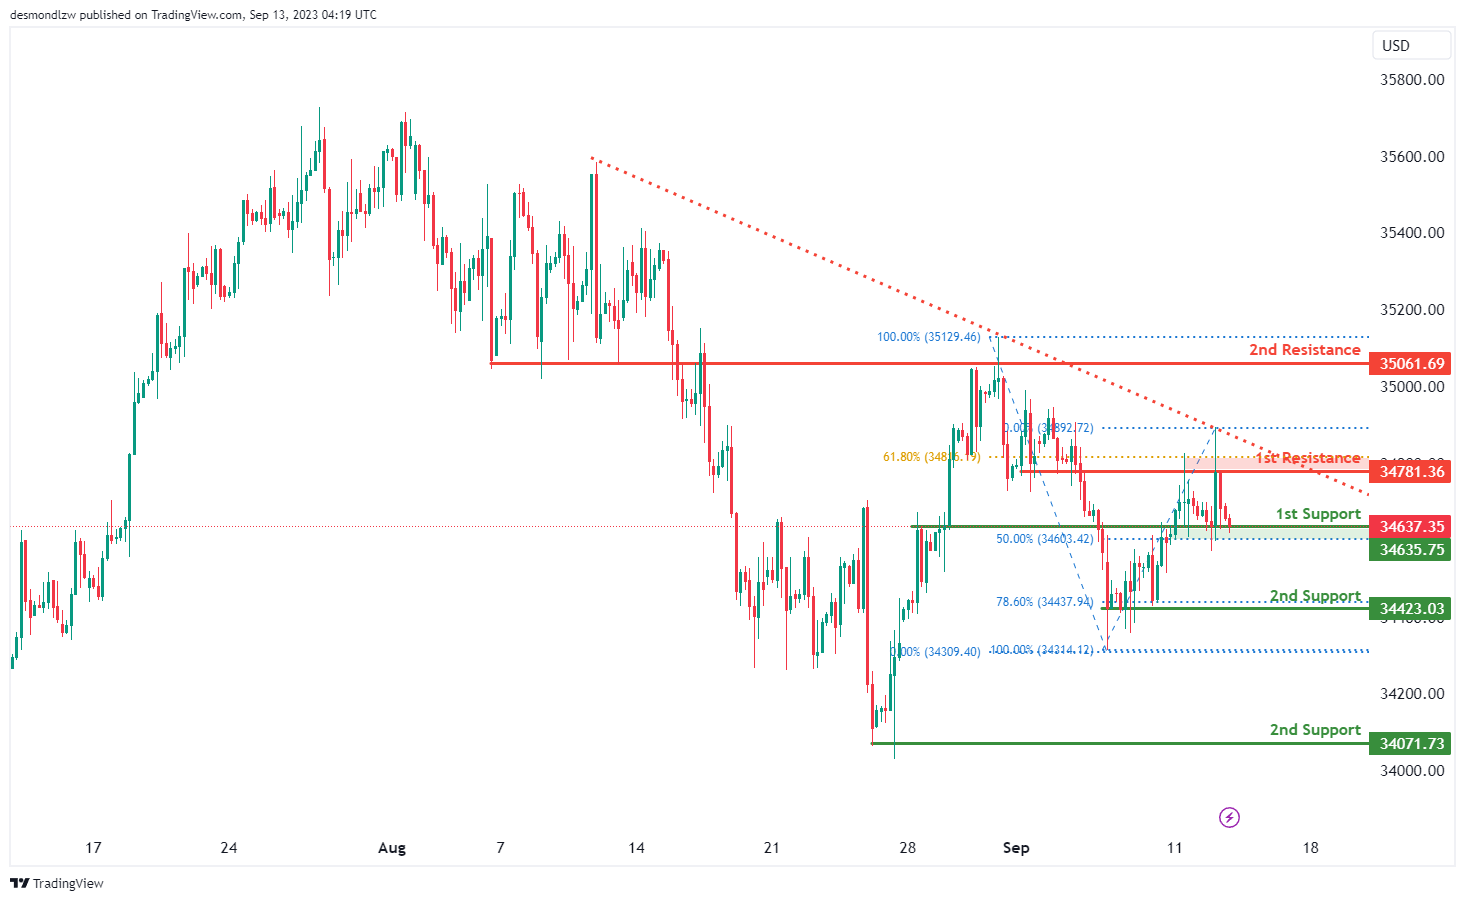
DJ30:
For DJ30, the overall momentum of the chart is currently bullish, indicating an upward trend.
There is potential for the price to make a bullish move by bouncing off the 1st support level at 34635.75 and heading towards the 1st resistance at 34781.36.
The 1st support at 34635.75 is considered significant because it represents an overlap support and aligns with the 50% Fibonacci Retracement level, suggesting potential stability and support at this level.
In case of a more substantial retracement, the 2nd support level at 34423.03 is also noteworthy, as it represents multi-swing low support and aligns with the 78.60% Fibonacci Retracement, offering additional reinforcement for the price.
On the upper side, the 1st resistance at 34781.36 is considered important due to its characteristics as an overlap resistance and its alignment with the 61.80% Fibonacci Retracement level. This level may act as a barrier to downward movement.
Further upward movement could face resistance at the 2nd resistance level of 35061.69, characterized as an overlap resistance, which could pose a significant challenge to the bearish momentum within the observed range.
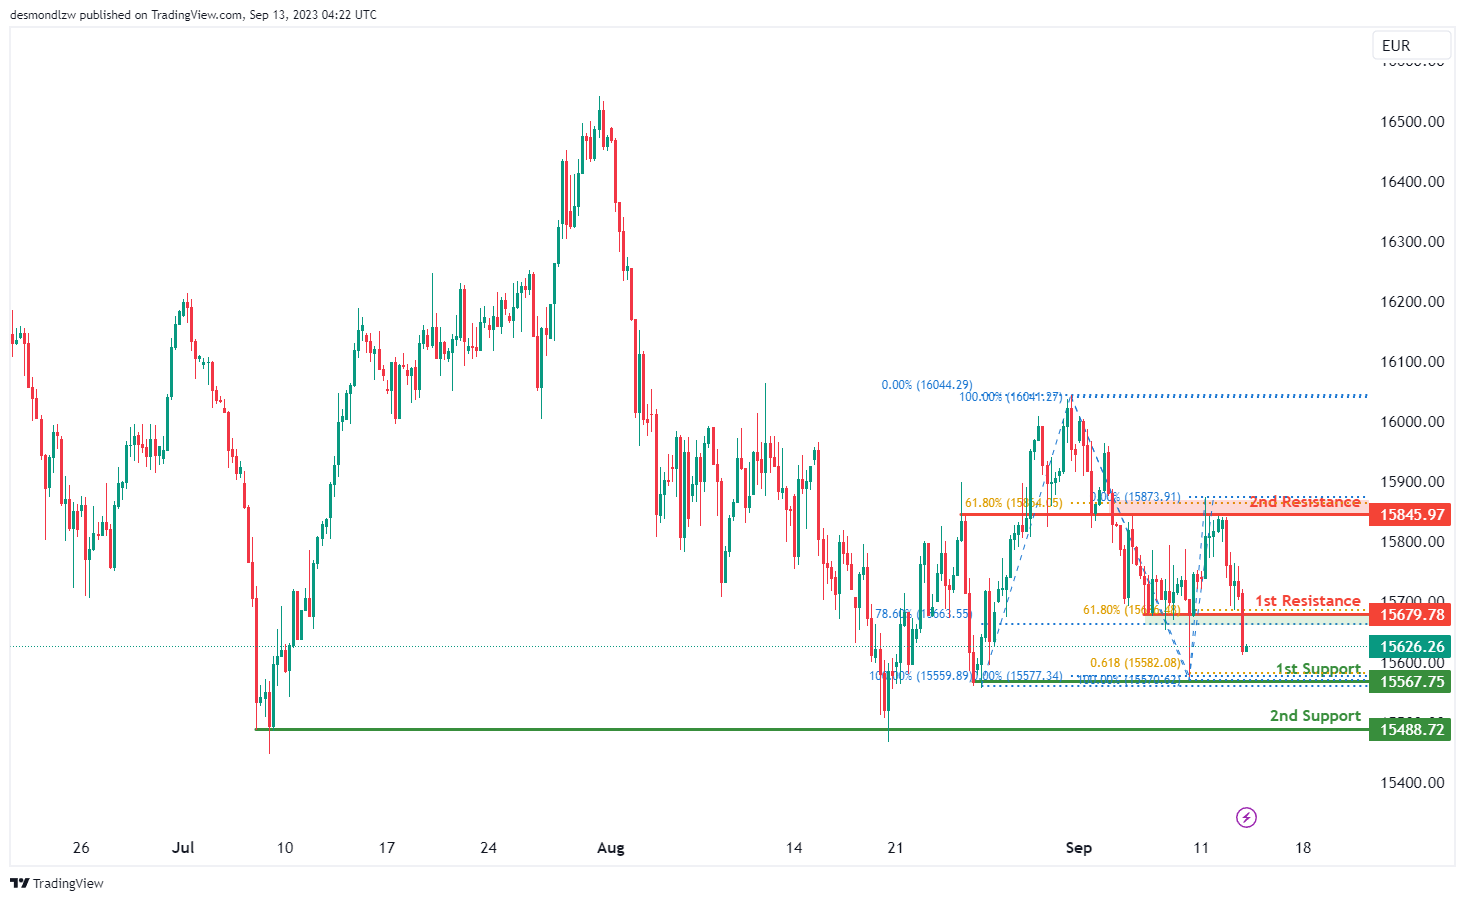
GER30:
For GER30, the overall momentum of the chart is currently bearish, indicating a downward trend.
There is potential for the price to continue its bearish movement towards the 1st support level at 15567.75. This 1st support is considered significant because it represents multi-swing low support and aligns with the 61.80% Fibonacci Projection, indicating potential stability and support at this level.
In case of a more substantial decline, the 2nd support level at 15488.72 is also noteworthy as it represents a swing low support, offering additional reinforcement for the price.
On the upper side, if there’s a reversal in the price, it may face resistance at the 1st resistance level of 15679.78. This 1st resistance is considered important because it represents pullback resistance and aligns with the 61.80% Fibonacci Retracement.
Further upward movement may encounter resistance at the 2nd resistance level of 15845.97, characterized as multi-swing high resistance and aligned with the 61.80% Fibonacci Retracement, potentially posing a significant obstacle to the bullish momentum.
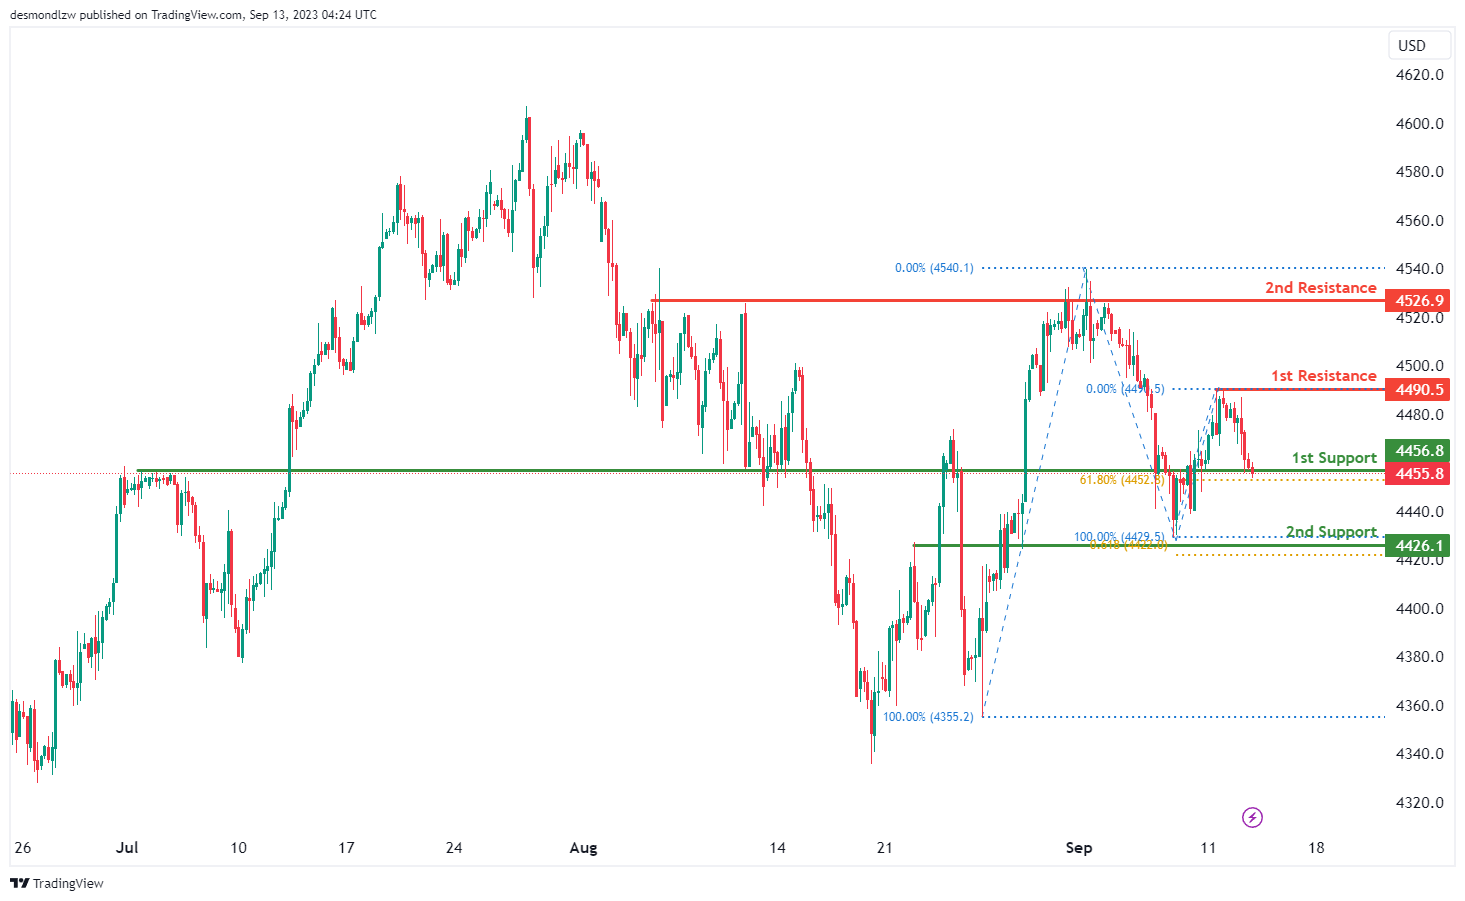
US500
For US500, the overall momentum of the chart is currently bearish, indicating a downward trend.
There is potential for the price to make a bearish move by breaking below the 1st support level at 4456.8 and dropping towards the 2nd support level at 4426.1.
The 1st support at 4456.8 is considered significant because it represents an overlap support and aligns with the 61.80% Fibonacci Retracement level, suggesting potential stability and support at this level.
In case of a more substantial decline, the 2nd support level at 4426.1 is also noteworthy, representing an overlap support and aligning with the 61.80% Fibonacci Projection, providing additional reinforcement for this level.
On the upper side, if there’s a reversal in the price, it may face resistance at the 1st resistance level of 4490.5, which is identified as a swing high resistance.
Further upward movement could encounter resistance at the 2nd resistance level of 4526.9, characterized as multi-swing high resistance, potentially acting as a barrier to the bullish momentum within the observed range.
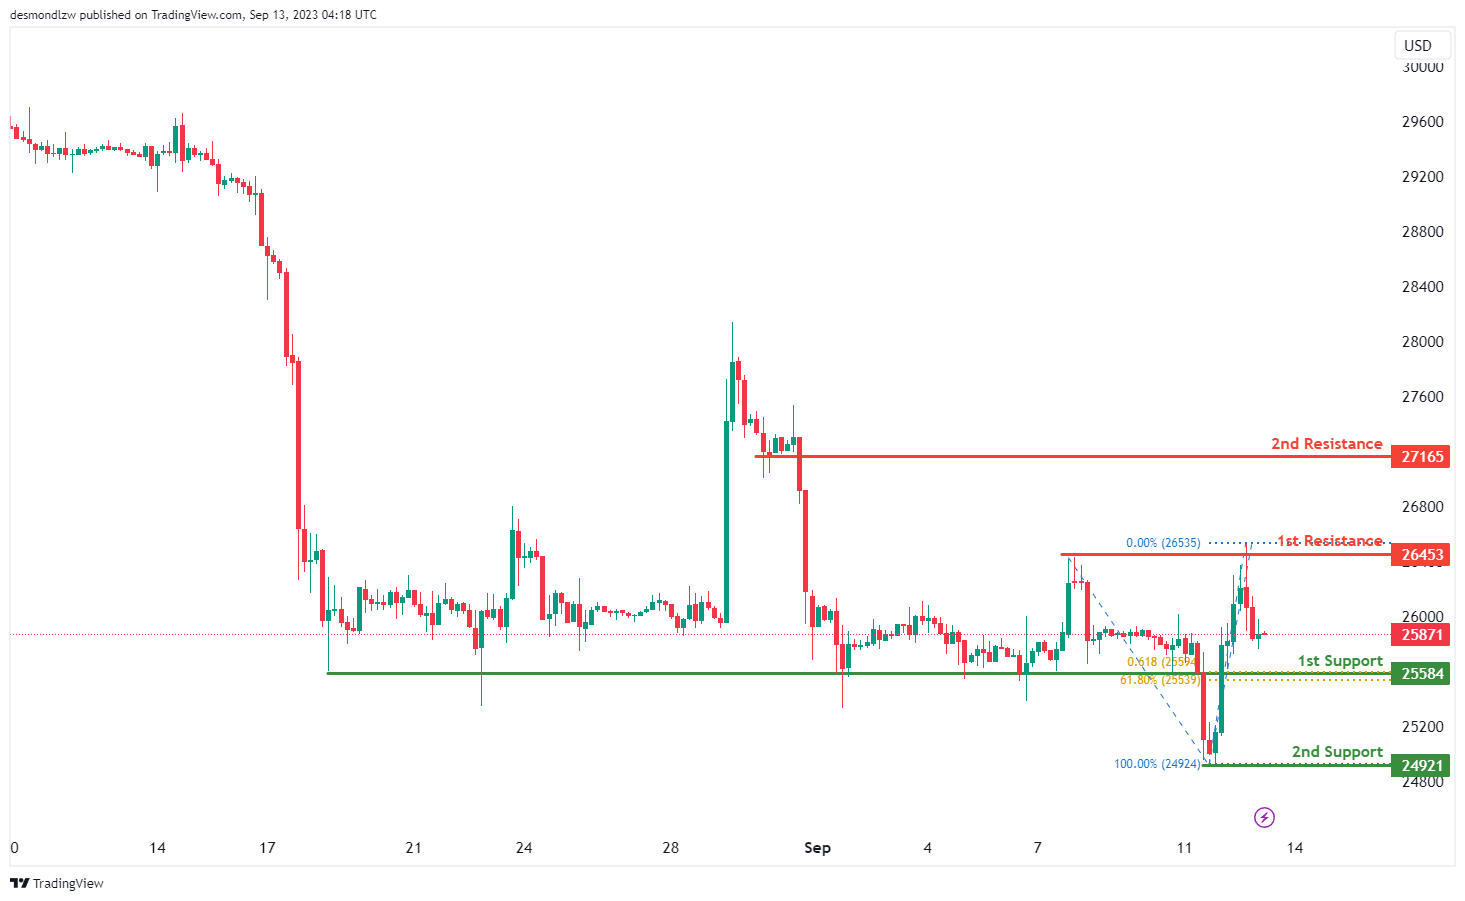
BTC/USD:
For BTC/USD, the overall momentum of the chart is currently bearish, indicating a downward trend.
There is potential for the price to continue its bearish movement towards the 1st support level at 25584. This 1st support is considered significant because it represents a pullback support and aligns with both the 61.80% Fibonacci Retracement and the 61.80% Fibonacci Projection, indicating strong potential support due to Fibonacci confluence.
In case of a more substantial decline, the 2nd support level at 24921 is also noteworthy, representing a swing low support, which may provide additional reinforcement for the price.
On the upper side, if there’s a reversal in the price, it may face resistance at the 1st resistance level of 26453, which is characterized as multi-swing high resistance.
Further upward movement could encounter resistance at the 2nd resistance level of 27165, identified as pullback resistance, which may act as a barrier to the bullish momentum within the observed range.
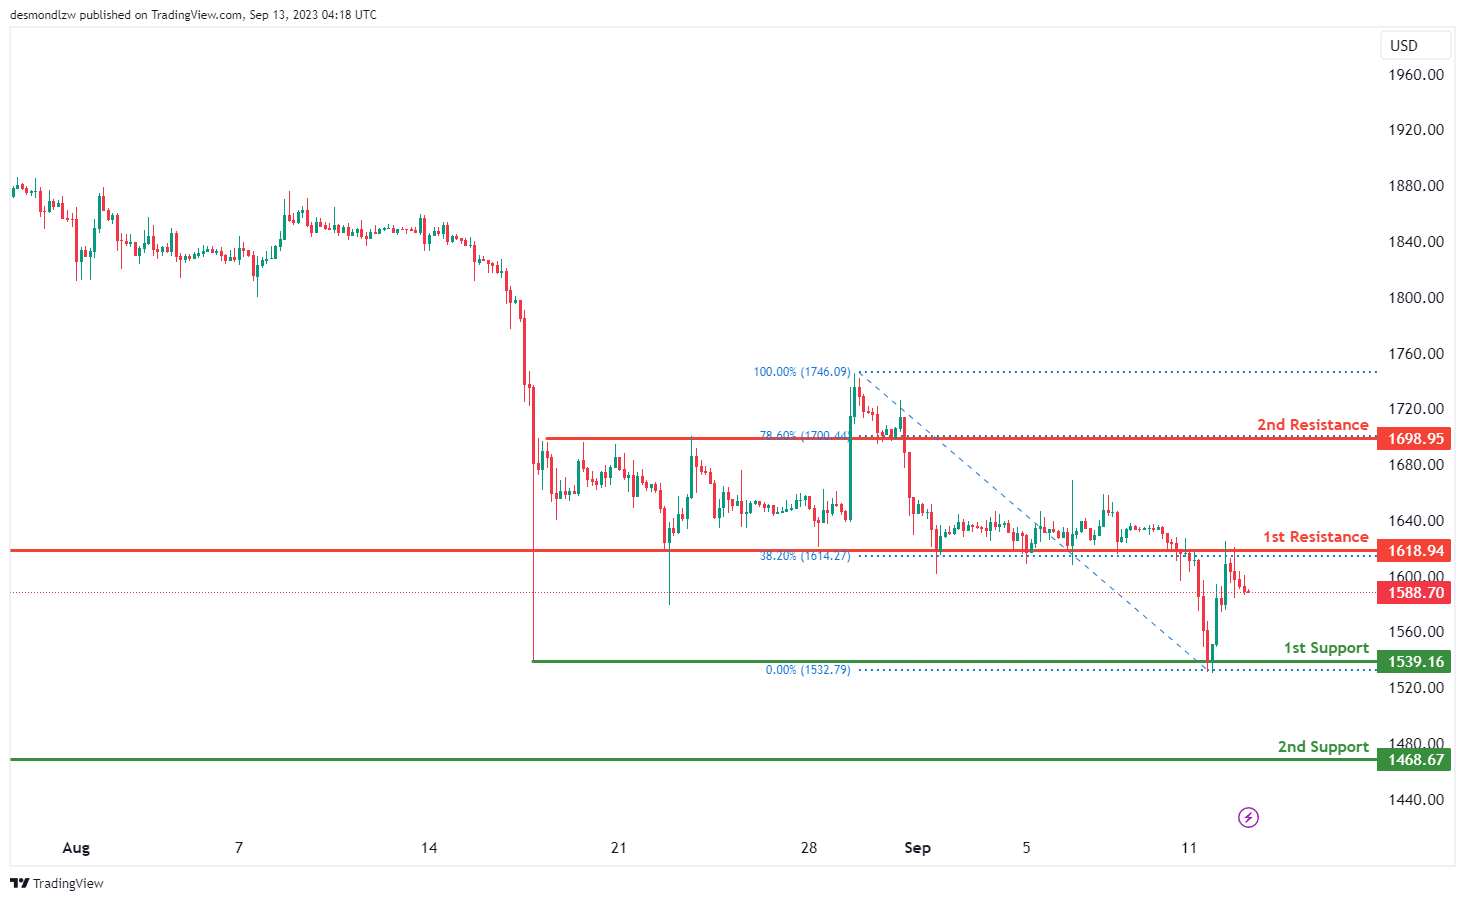
ETH/USD:
For ETH/USD, the overall momentum of the chart is currently bearish, indicating a downward trend.
There is potential for the price to continue its bearish movement towards the 1st support level at 1539.16. This 1st support is considered significant because it represents multi-swing low support, indicating potential stability at this level.
In case of a more substantial decline, the 2nd support level at 1468.67 is also noteworthy, as it represents a swing low support, offering additional reinforcement for the price.
On the upper side, the 1st resistance at 1618.94 is considered important due to its characteristics as pullback resistance, supported by the 38.20% Fibonacci Retracement level. This level may act as a barrier to upward movement.
Further upward movement could face resistance at the 2nd resistance level of 1698.95, characterized as pullback resistance and aligned with the 78.60% Fibonacci Retracement level, potentially posing a significant obstacle to the bullish momentum.
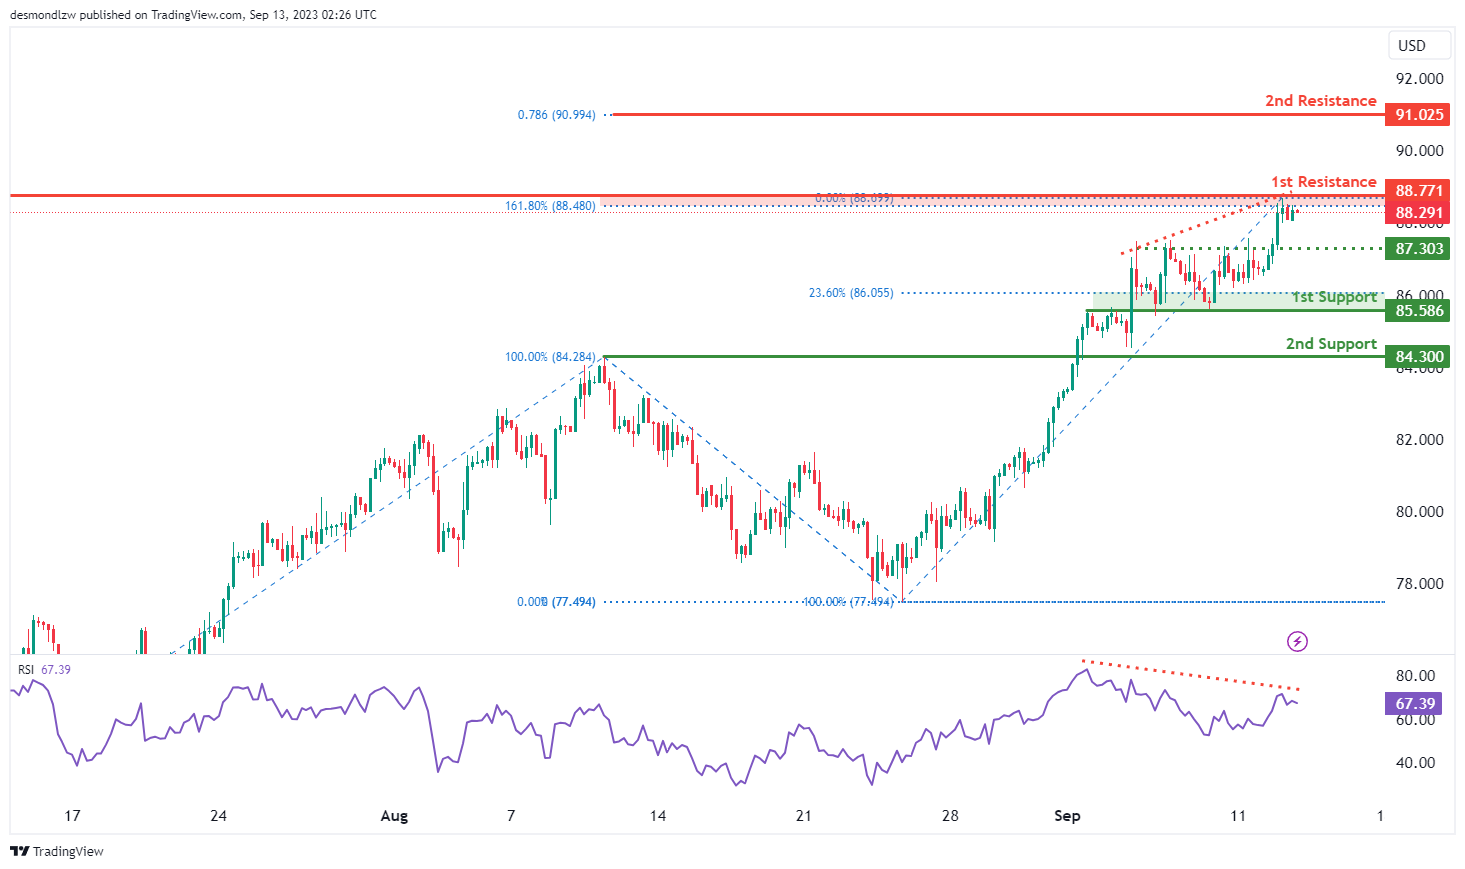
WTI/USD:
The WTI chart currently indicates a weak bearish momentum with low confidence as the RSI is displaying a bearish divergence versus the price, suggesting the possibility of a reversal in the near future. There is a potential scenario where price could experience a bearish reaction close to or upon reaching the 1st resistance level and subsequently drop towards the 1st support level.
The 1st resistance level at 88.77 is identified as an overlap resistance that coincides with the 161.80% Fibonacci extension level. Furthermore, the 2nd resistance level at 91.03 is noted as a resistance level that aligns with the 78.60% Fibonacci projection level.
To the downside, the intermediate support level at 87.30 is marked as pullback support while the 1st support level at 85.59 is identified as an overlap support that aligns with the 23.60% Fibonacci retracement level. Additionally, the 2nd support level at 84.30 is marked as a pullback support.
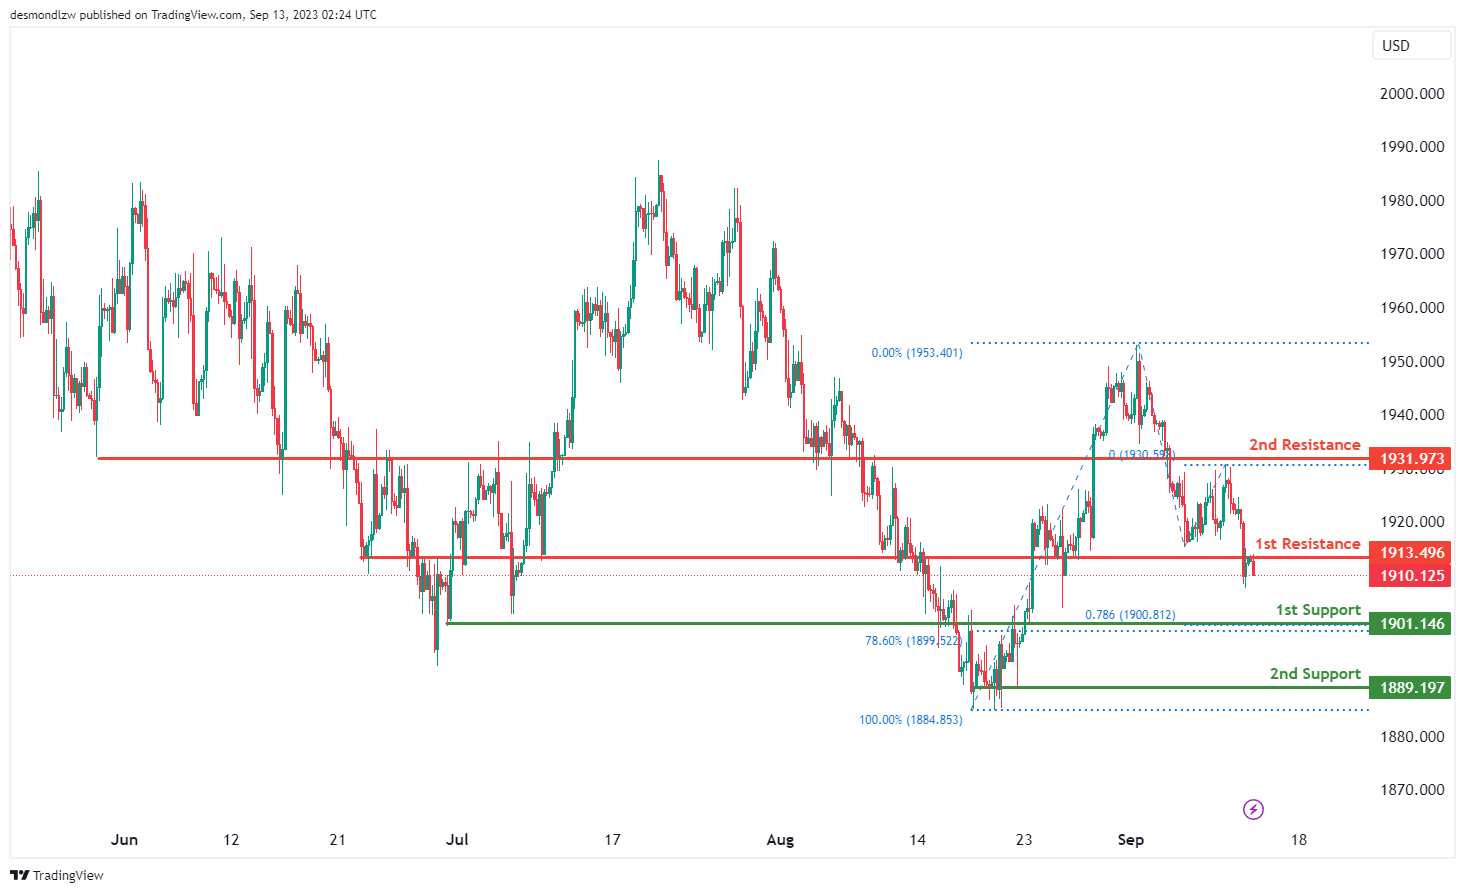
XAU/USD (GOLD):
The XAU/USD (Gold/US Dollar) chart currently exhibits a bearish overall momentum, signaling a potential downward trend in price movement. There’s a likelihood of a bearish continuation towards the 1st support level.
The 1st support at 1901.14 is considered a strong support zone, as it aligns with an overlap support, the 78.60% Fibonacci Retracement, and the 78.60% Fibonacci Projection, indicating Fibonacci confluence. Additionally, the 2nd support at 1889.19 is characterized as a multi-swing low support.
On the resistance side, the 1st resistance at 1913.49 represents an overlap resistance, while the 2nd resistance at 1931.97 is also marked as an overlap resistance.


