
- The small-cap Russell 2000 which is considered as a better proxy of the US economy has just broken below its key 200-day moving average.
- It is the worst-performing major US benchmark stock index since August 2023.
- Its recent major downtrend phase from 5 November 2021 to 16 June 2022 started ahead of the other indices; S&P 500, Nasdaq 100, and Dow Jones Industrial Average.
- Given such a leading element, a further down move in the Russell 2000 may trigger a similar negative feedback loop into the other US benchmark stock indices.
- Watch its key short-term resistance at 1,865.
Since the US regional banking crisis that imploded in early March this year, the performance of the small-cap Russell 2000 has not made any headway as it failed to break above its major “Symmetrical Triangle” range resistance at 2,009 in place since 16 August 2022.
Also, in the past two months, it has been the worst-performing major US benchmark stock indices where it ended August with a loss of -5.17%, way below the S&P 500 (-1.77%), Nasdaq 100 (-1.62%), Dow Jones Industrial Average (-2.36%).
For the current month-to-date performance as of 13 September, the Russell 2000 has remained in the doldrums with a loss of -3.10% and underperformed against the S&P 500 (-0.89%), Nasdaq 100 (-0.98%), Dow Jones Industrial Average (-0.42%) over the same period.
Broke below key 200-day moving average
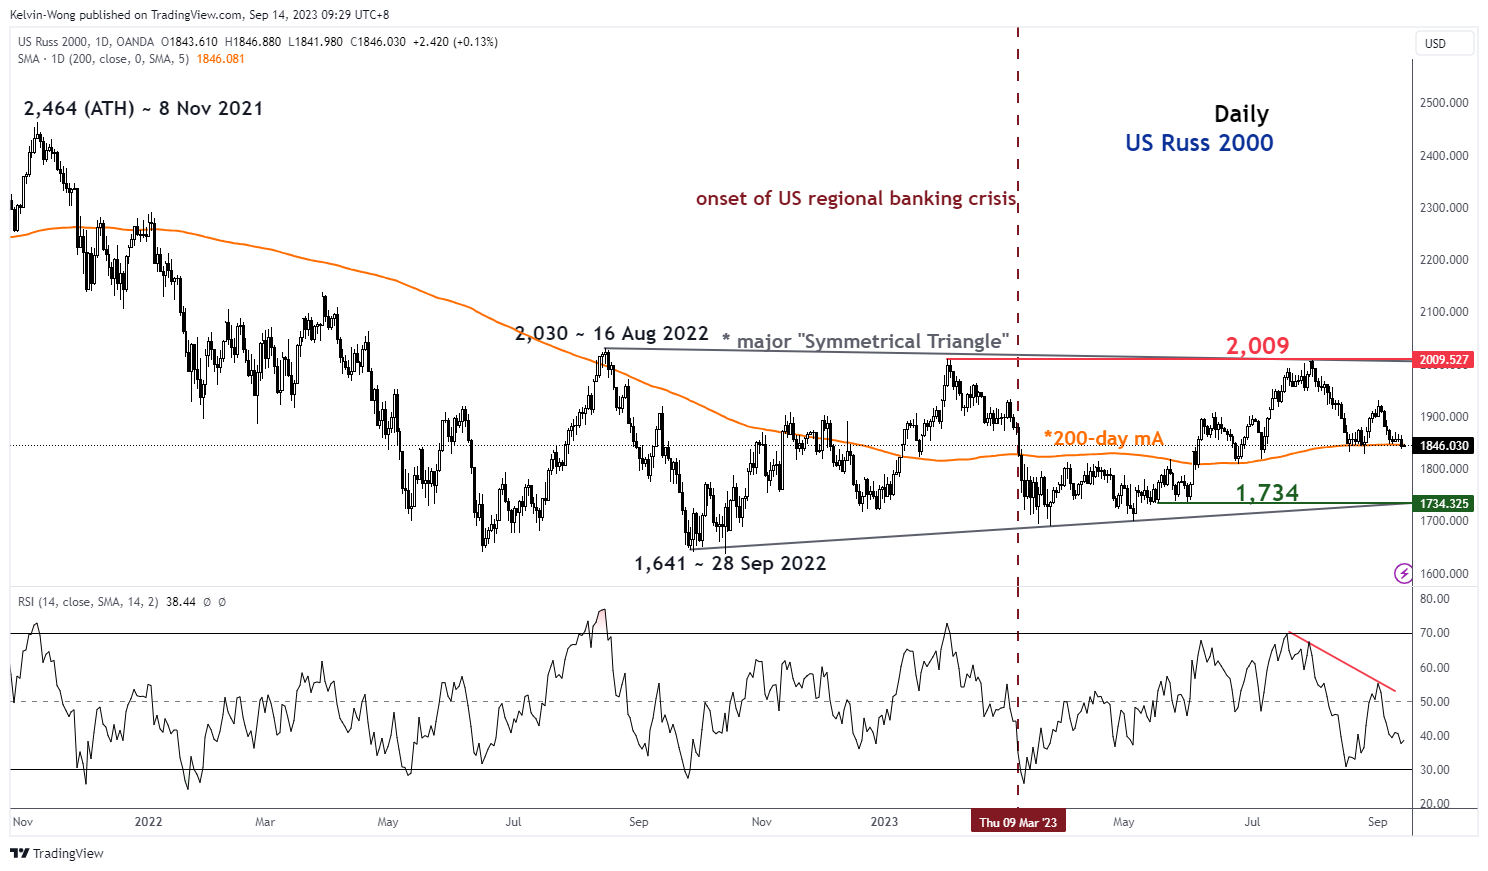
Fig 1: US Russ 2000 major and medium-term trends as of 14 Sep 2023 (Source: TradingView, click to enlarge chart)
The current price actions of the US Russ 2000 Index (a proxy for the Russell 2000 futures) have inched lower since the 1 August 2023 high of 2,009 and it is now almost at a similar price level during the onset of the US regional banking liquidity crisis that erupted on 9 March 2023.
Technical analysis and momentum factor are now flashing signs of potential medium-term weakness as yesterday’s daily price action at the close has broken below its key 200-day moving average slightly at the end of yesterday, 13 September US session. Also, the US Russ 2000 Index is the sole US benchmark index that has breached below the key 200-day moving average ahead of the others (S&P 500, Nasdaq 100 & Dow Jones Industrial Average).
Interestingly, in the prior major downtrend phase, the US Russ 2000 Index kickstarted the bearish movement ahead of the rest where its all-time high of 2,464 peaked on 8 November 2021 before the respective peak periods of all-time highs of the S&P 500 (4 January 2022), Nasdaq 100 (22 November 2021), Dow Jones Industrial Average (5 January 2022).
Therefore, if the US Russ 2000 starts to exhibit another bout of multi-week down move sequence thereafter and breaks below the major “Symmetrical Triangle” range support at 1,734, it may signal the start of another major downtrend phase for the US benchmark stock indices.
Oscillating within a short-term minor downtrend
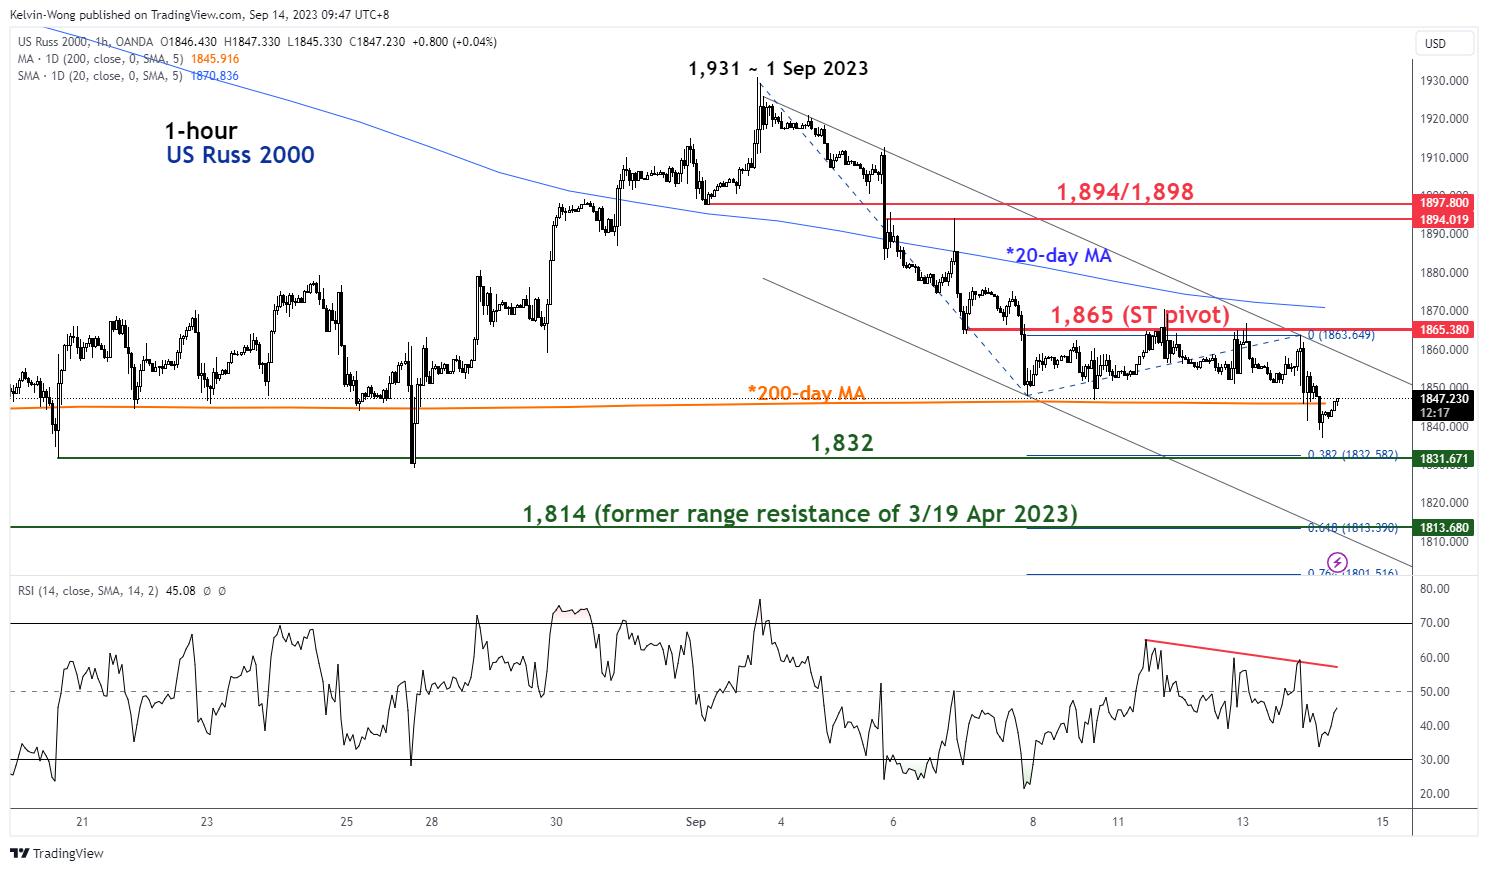
Fig 2: US Russ 2000 short-term minor trend as of 14 Sep 2023 (Source: TradingView, click to enlarge chart)
Since its 1 September 2023 high of 1,931, the price actions of the US Russ 2000 Index have evolved within a minor descending channel and traded below a downward-slopping 20-day moving average which indicates a short-term minor downtrend is in motion.
Watch the 1,865 key short-term pivotal resistance to maintain the short-term bearish scenario to see the intermediate supports coming in at 1,832 and 1,814 (Fibonacci extension from 1 September 2023 high, lower boundary of the minor descending channel & 3 April/19 April 2023 swing lows).
On the flip side, a clearance above 1,865 negates the bullish tone for a squeeze up towards the 1,894/1,898 resistance zone (congestion area of 1 September/6 September 2023 & 61.8% Fibonacci retracement of the current minor down move from 1 September 2023 high to 13 September 2023, US session low).


