
DXY:
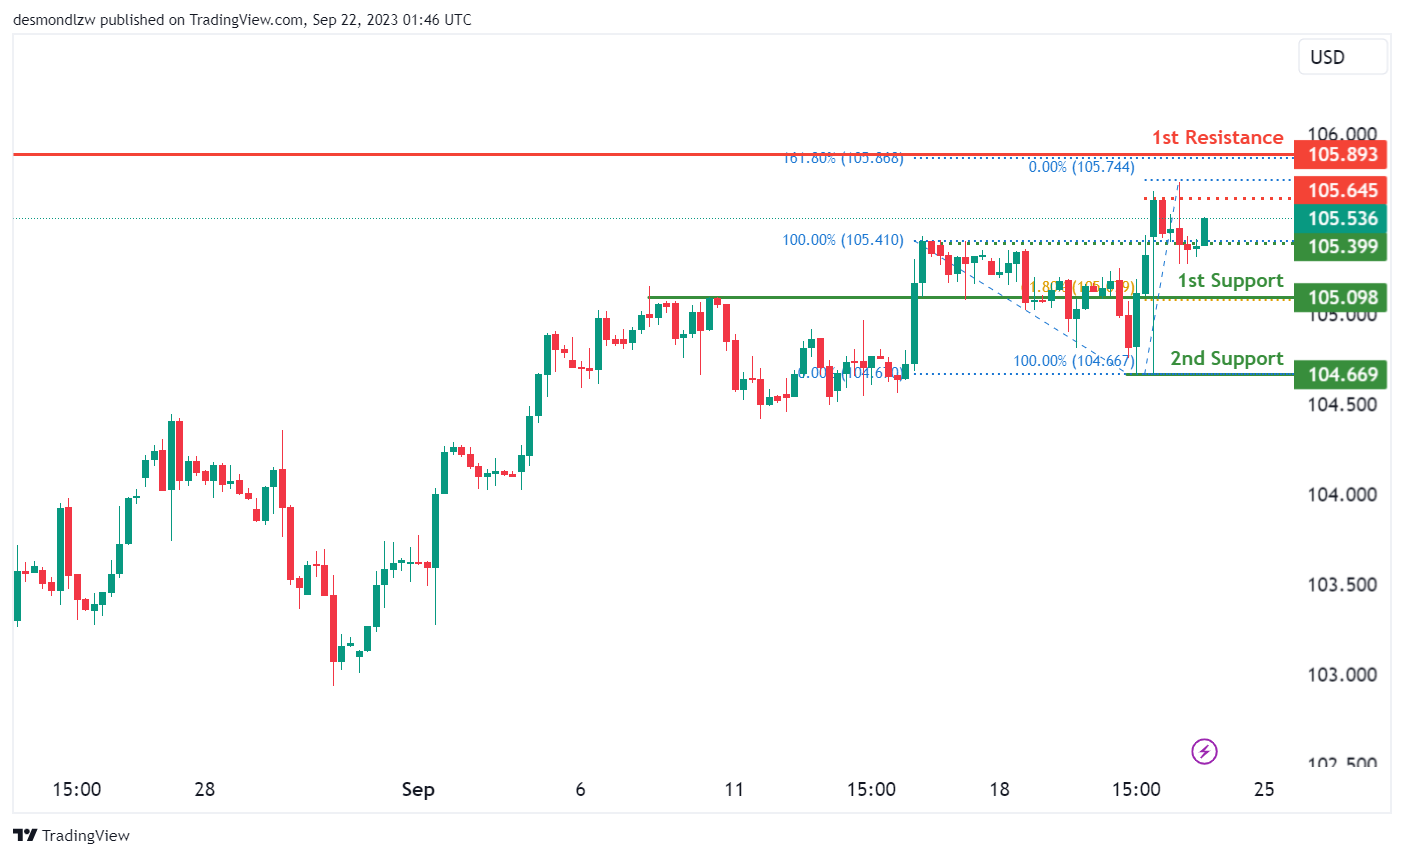
The DXY (US Dollar Index) chart currently shows a bullish overall momentum, supported by several technical factors. This bullish sentiment indicates a potential scenario where the price could continue its upward movement towards the 1st resistance level.
The 1st support level at 105.09 is considered a strong potential support zone, with an overlapping support and the presence of the 61.80% Fibonacci Retracement, suggesting its significance as a potential area where price might find support. Additionally, the 2nd support at 104.66 is identified as a swing low support, further reinforcing its importance as a potential support level.
On the resistance side, the 1st resistance level at 105.89 is characterized as a swing high resistance. Traders and investors should closely monitor this level, as it may act as a point of resistance in the ongoing bullish trend. Furthermore, the intermediate resistance at 105.64 is marked as a swing high resistance, emphasizing its potential significance.
EUR/USD:
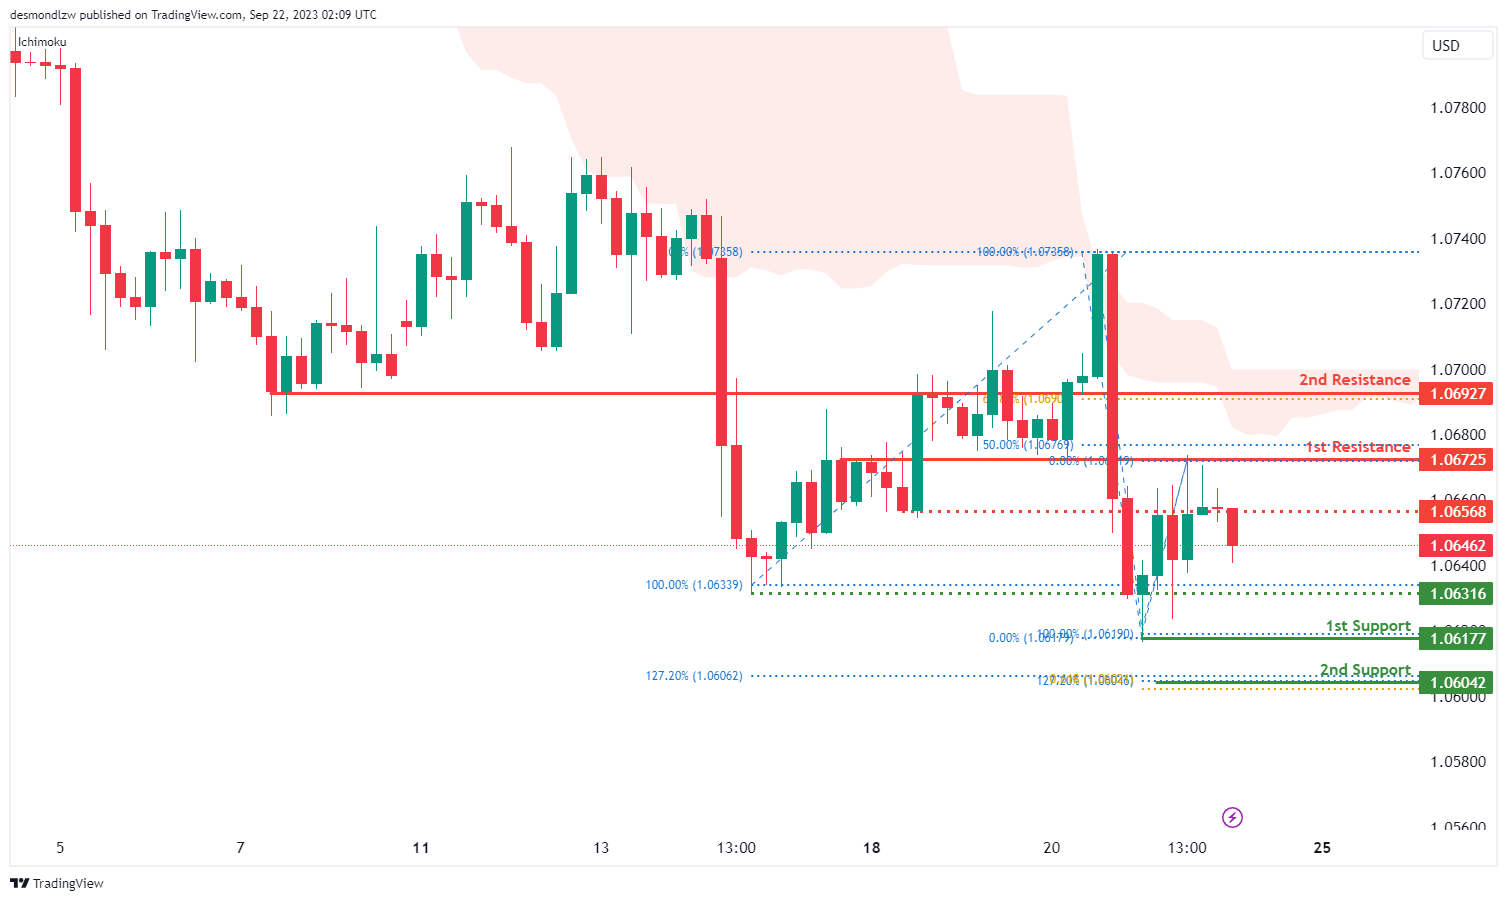
The EUR/USD chart currently exhibits a bearish overall momentum, and several factors contribute to this bearish sentiment. Price is notably below the bearish Ichimoku cloud, indicating a strong bearish bias. In this context, there is a potential scenario where the price could continue its bearish movement towards the 1st support level.
The 1st support at 1.0617 is considered a significant support zone, marked as a swing low support. This level is reinforced by the presence of the 127.20% Fibonacci Extension and the 61.80% Fibonacci Projection, indicating Fibonacci confluence and further highlighting its potential importance.
The 2nd support at 1.0604 is another notable level, as it coincides with the 127.20% Fibonacci Extension and the 61.80% Fibonacci Projection, suggesting additional confluence and potential support.
On the resistance side, the 1st resistance at 1.0672 is characterized as an overlap resistance with the presence of the 50% Fibonacci Retracement, signifying its potential significance. The 2nd resistance at 1.0692 is identified as a pullback resistance, with the 61.80% Fibonacci Retracement, further reinforcing its potential as a resistance point. Additionally, the intermediate resistance at 1.0656 is marked as an overlap resistance.
EUR/JPY:
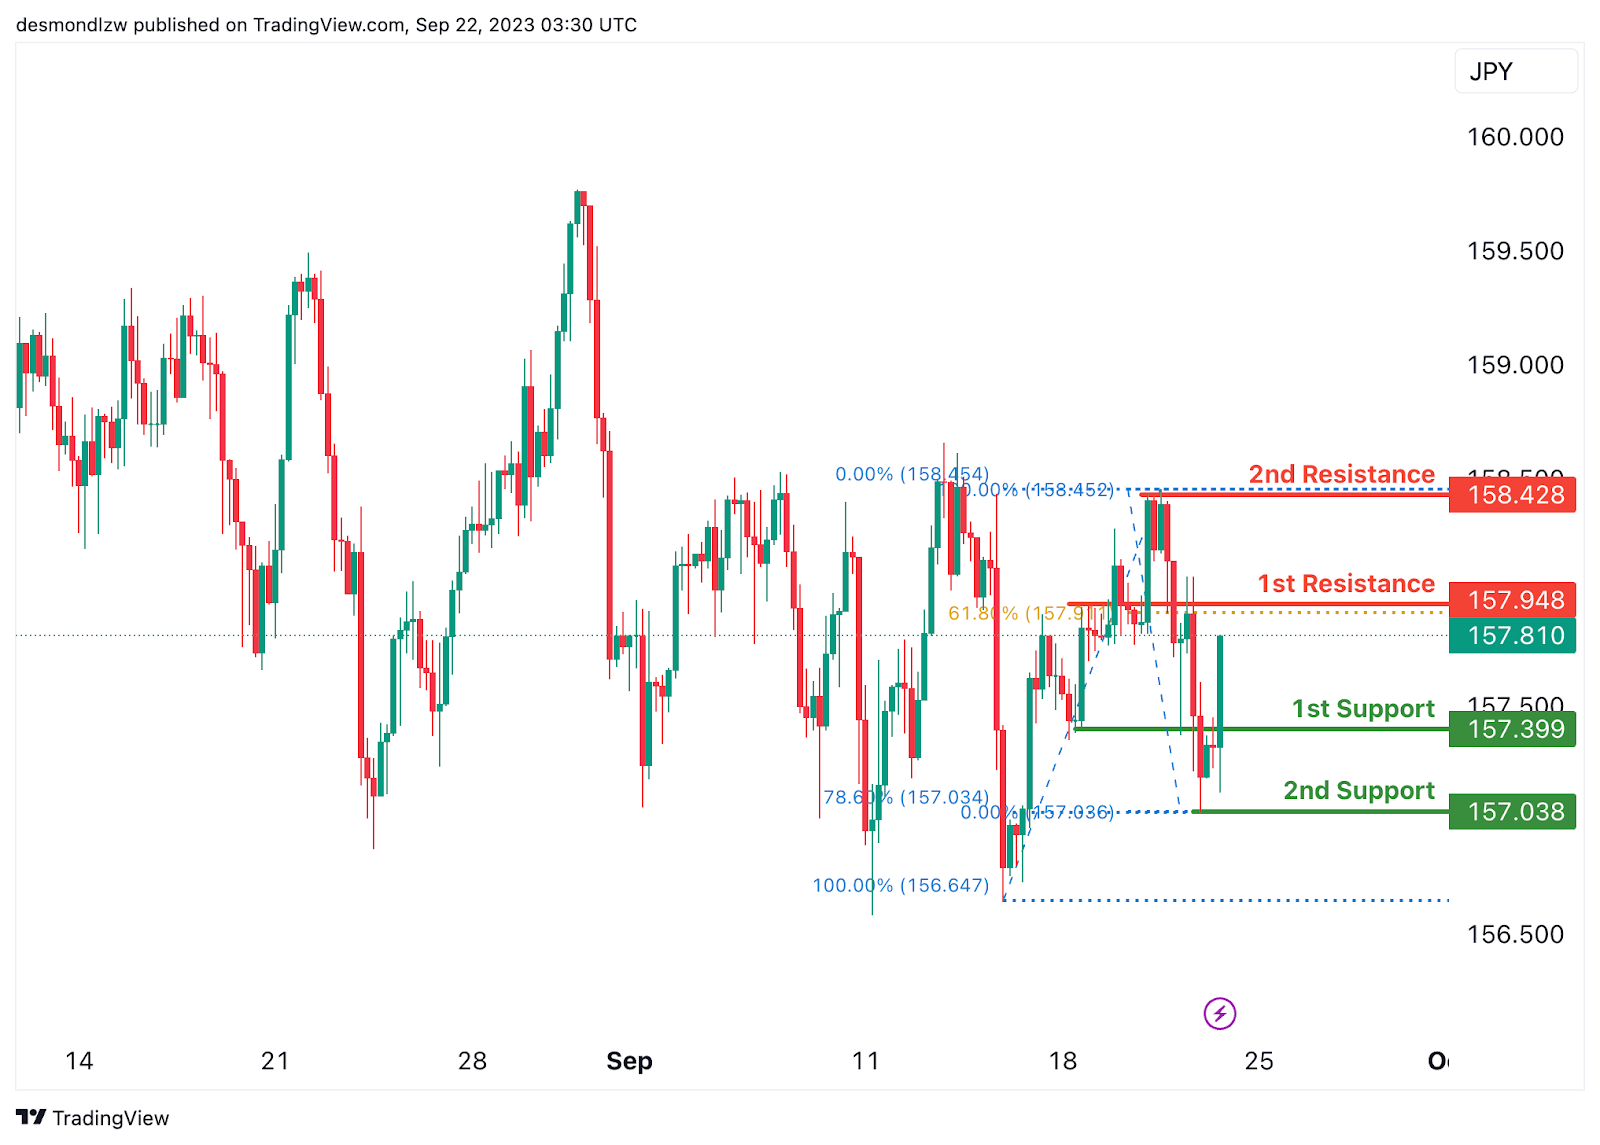
The instrument EUR/JPY currently suggests a bearish overall momentum on the chart, and there’s potential for a short-term rise towards the 1st resistance before reversing off it and dropping towards the 1st support.
The 1st support at 157.39 is considered good due to its nature as a pullback support.
The 2nd support at 157.03 is also notable as it acts as a swing low support and is associated with the 78.60% Fibonacci Retracement, providing an additional layer of potential support.
On the resistance side, we have the 1st resistance at 157.94, which is significant because it represents an overlap resistance and is linked to the 61.80% Fibonacci Retracement.
Meanwhile, the 2nd resistance at 158.42 is noteworthy as it functions as a swing high resistance, suggesting a potential point where the price may reverse its short-term rise and start to drop.
EUR/GBP:
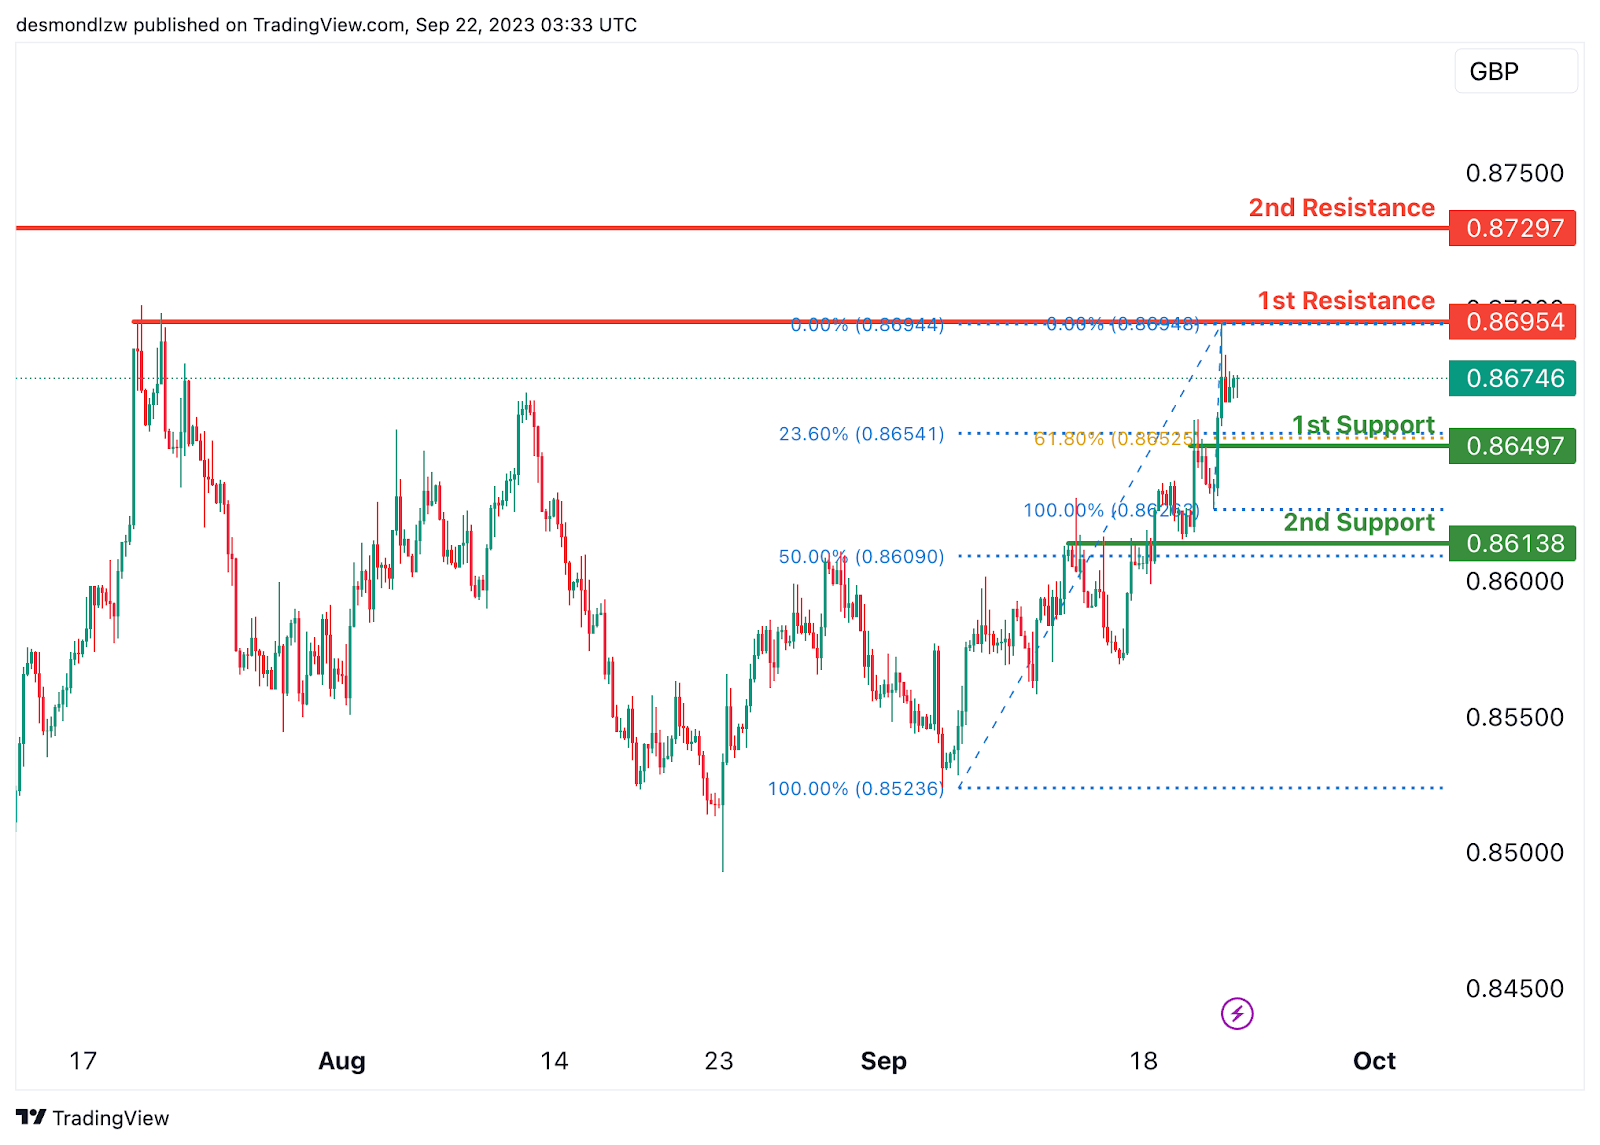
The instrument EUR/GBP currently indicates a bullish overall momentum on the chart, and there’s potential for a bullish continuation towards the 1st resistance at 0.8695.
The 1st support at 0.8649 is considered strong due to its nature as a pullback support, and it’s associated with both the 61.80% Fibonacci Retracement and the 23.60% Fibonacci Retracement, indicating a Fibonacci confluence. This makes it a robust level of potential support.
The 2nd support at 0.8613 is also notable as it acts as another pullback support, and it’s linked to the 50% Fibonacci Retracement, offering an additional layer of potential support.
On the resistance side, we have the 2nd resistance at 0.8729, which is significant because it represents an overlap resistance.
The 1st resistance at 0.8695 is also considered good as it represents a multi-swing high resistance, suggesting potential barriers to further bullish movement at these levels.
GBP/USD:
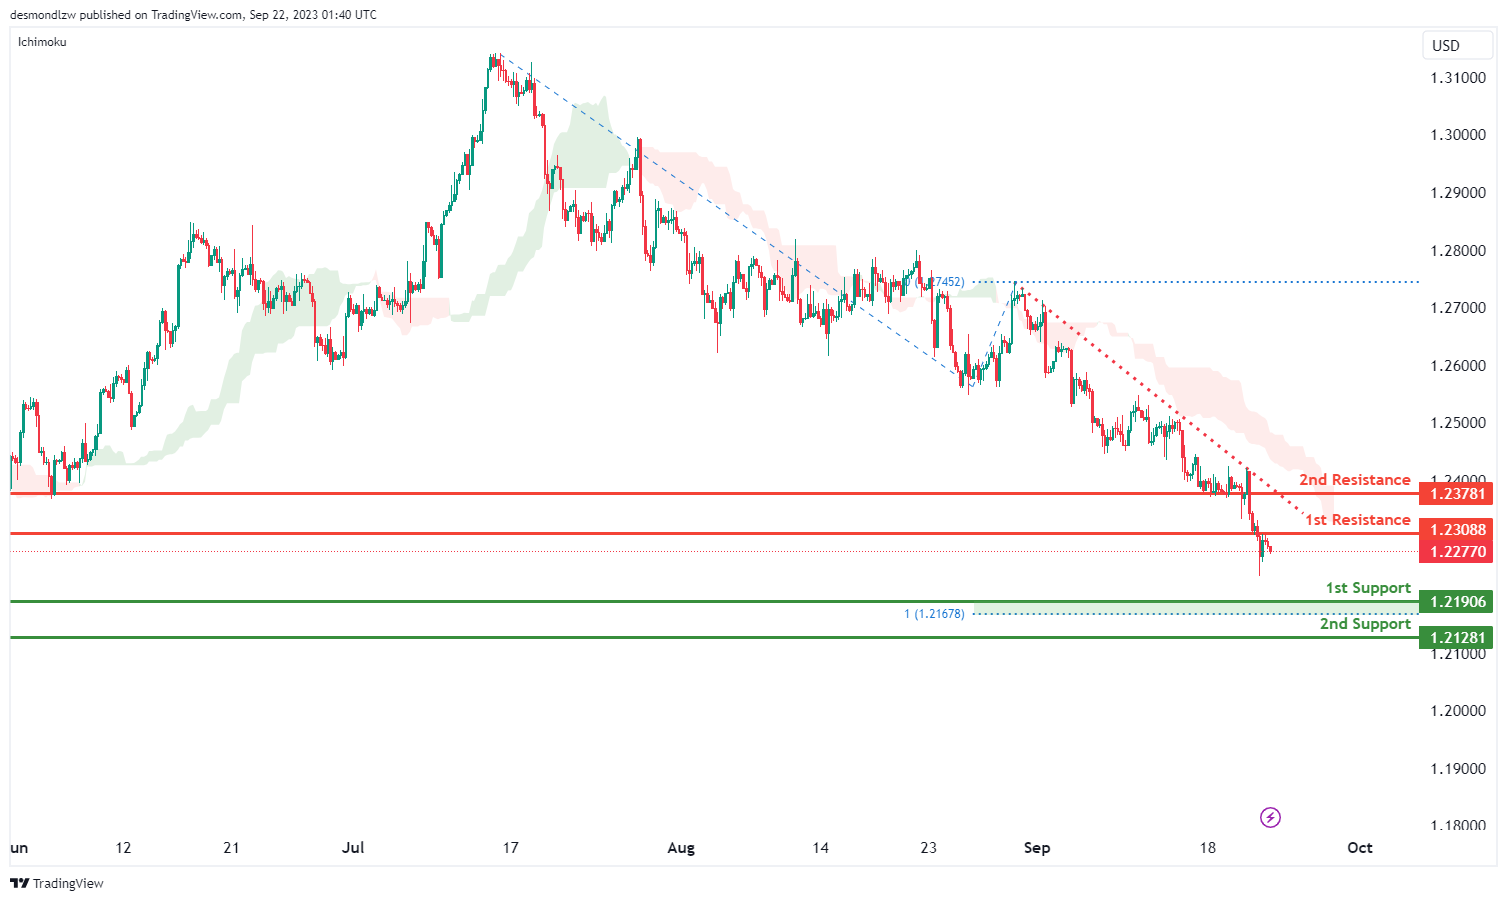
The GBP/USD chart currently maintains a bearish overall momentum, with several factors contributing to this bearish sentiment. One significant factor is that the price is trading below a major descending trend line, which acts as a resistance level and suggests the presence of bearish momentum.
In this context, there is a potential scenario where the price could continue its bearish movement towards the 1st support level, which is marked at 1.219. This support level is considered significant, as it coincides with the 100% Fibonacci Projection, indicating its potential importance as a support zone.
The 2nd support at 1.2126 is another notable level, marked as an overlap support, further reinforcing its potential as a support zone.
On the resistance side, the 1st resistance at 1.2308 is characterized as an overlap resistance, which may act as a barrier to any potential upward movements. The 2nd resistance at 1.2378 is identified as a pullback resistance, signifying its potential significance as a point of reversal or resistance.
GBP/JPY:
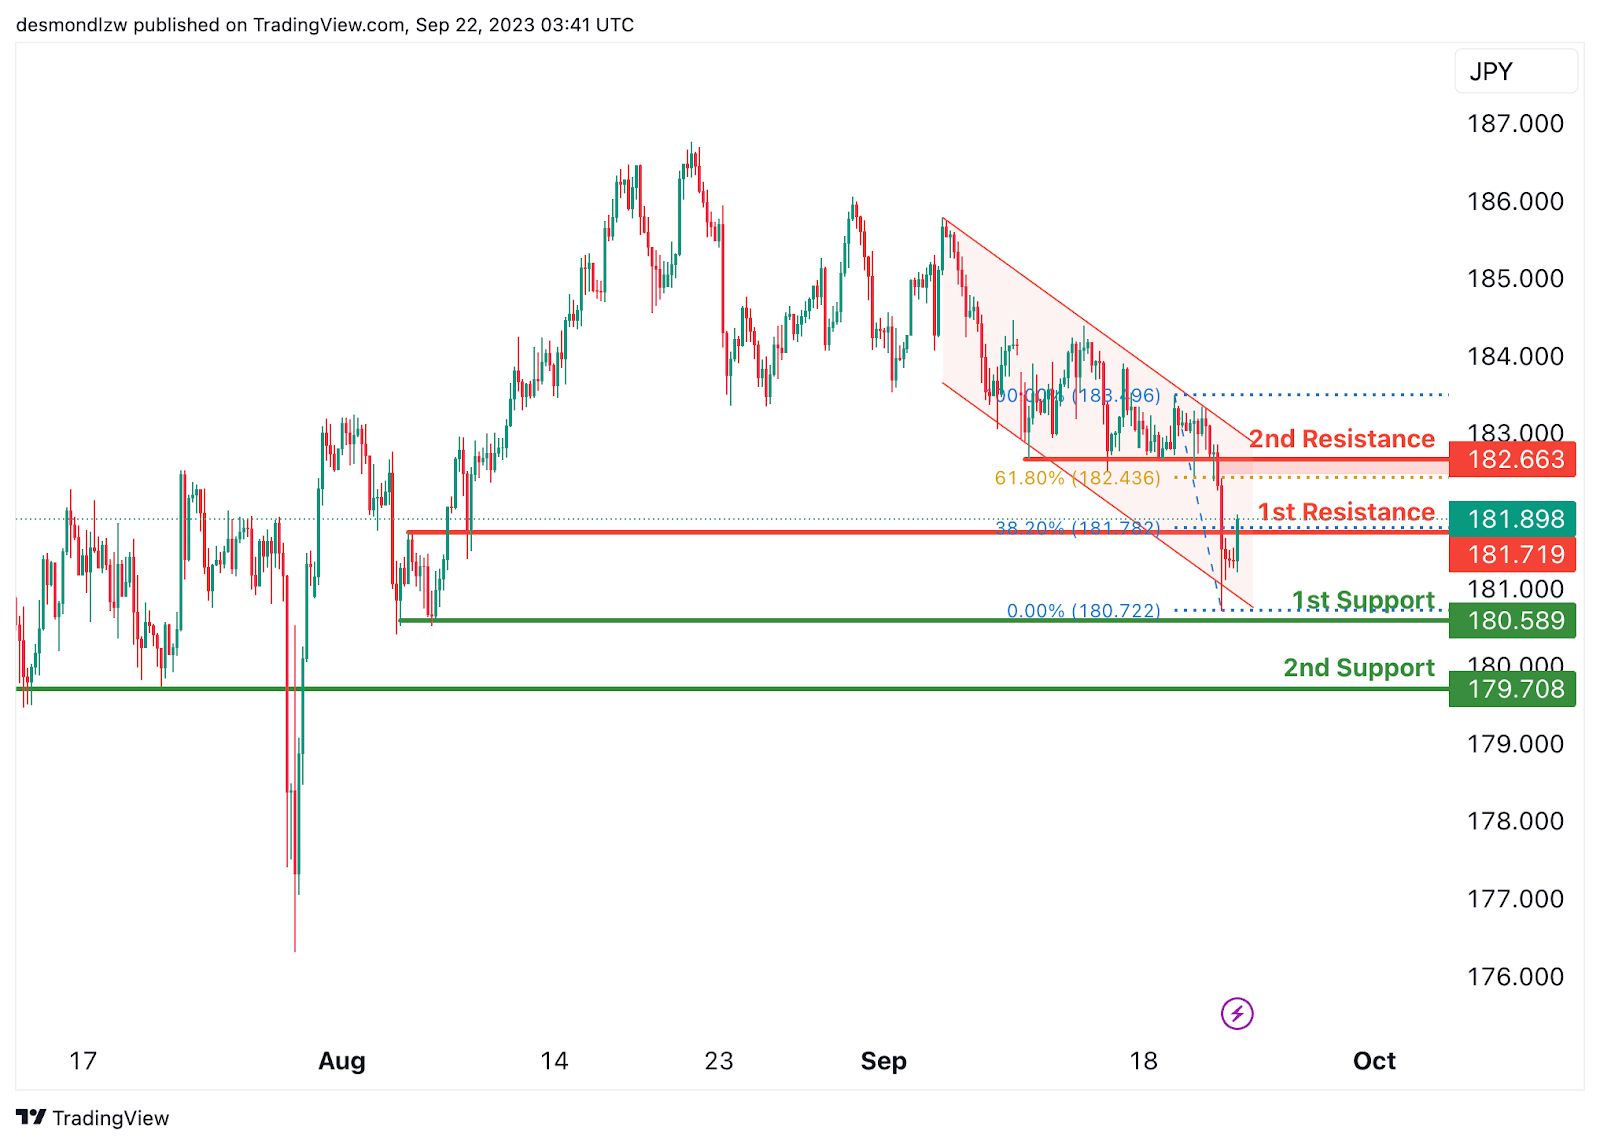
The instrument GBP/JPY currently has a bearish overall momentum on the chart, with the price being in a bearish descending channel. There’s potential for a short-term rise towards the 1st resistance before reversing off it and dropping towards the 1st support.
The 1st support at 180.58 is considered good due to its nature as a multi-swing low support, providing a solid level of potential support.
The 2nd support at 179.70 is also noteworthy as it acts as a pullback support, offering an additional layer of potential support.
On the resistance side, we have the 1st resistance at 181.71, which is significant because it represents a pullback resistance and is associated with the 38.20% Fibonacci Retracement.
Similarly, the 2nd resistance at 182.66 is also a pullback resistance, suggesting potential barriers to further bullish movement at these levels.
USD/CHF:
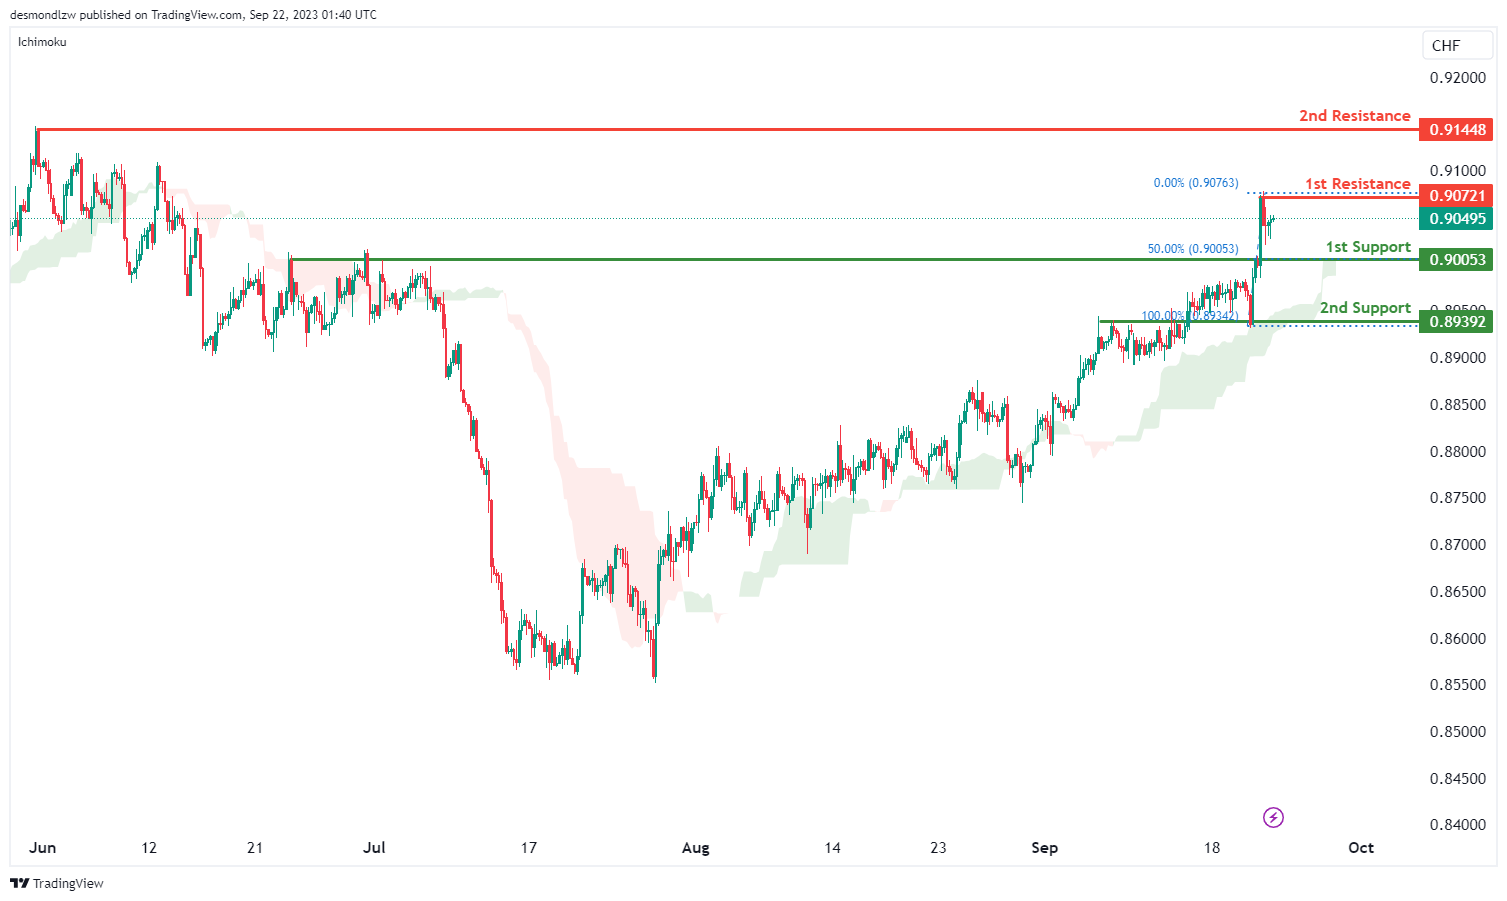
The USD/CHF chart currently exhibits a bullish overall momentum, with the following factors contributing to this bullish sentiment: the price is trading above the bullish Ichimoku cloud, suggesting a favorable environment for further bullish movements.
In this context, there is a potential scenario where the price could continue its bullish trajectory towards the 1st resistance level at 0.9072. This resistance level is characterized as a swing high resistance, which may act as a barrier to any potential upward movements.
On the support side, the 1st support at 0.9005 is identified as a pullback support and is marked at the 50% Fibonacci Retracement level, indicating its potential significance as a support zone. The 2nd support at 0.8939 is marked as an overlap support, further reinforcing its importance as a potential support level.
USD/JPY:
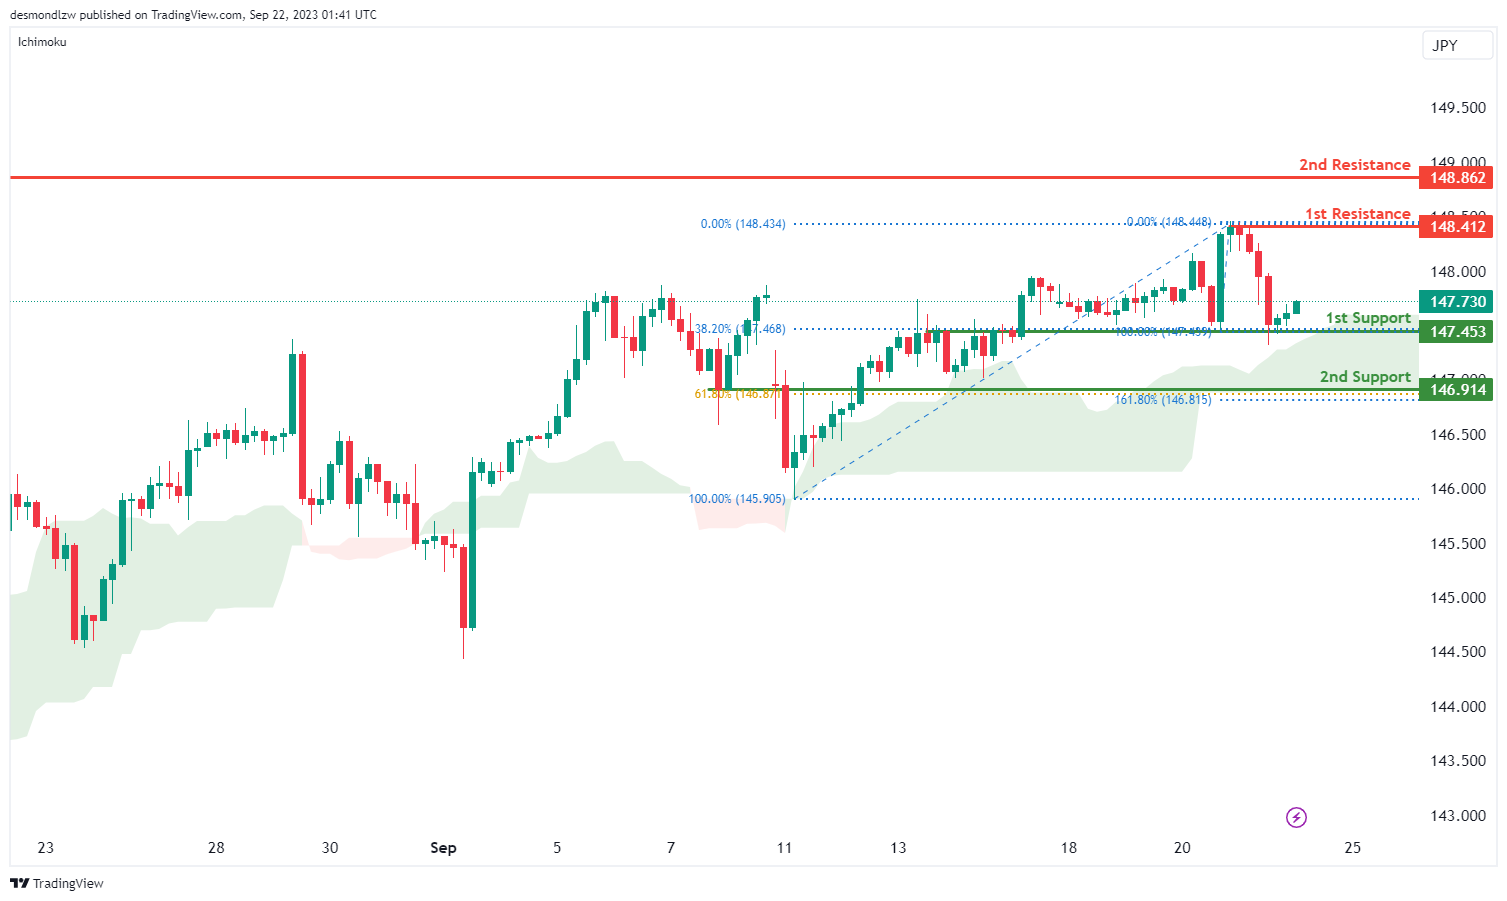
The USD/JPY chart currently exhibits a bullish overall momentum, and this bullish sentiment is attributed to the price trading above a major ascending trend line, suggesting the potential for further bullish movements.
In this context, there’s a potential scenario where the price could continue its bullish trajectory towards the 1st resistance level at 148.41. This resistance level is characterized as a swing high resistance, which may act as a barrier to any potential upward movements.
On the support side, the 1st support at 147.45 is identified as an overlap support and is marked at the 38.20% Fibonacci Retracement level, indicating its potential significance as a support zone. The 2nd support at 146.91 is marked as an overlap support and is significant due to the confluence of the 61.80% Fibonacci Retracement and the 161.80% Fibonacci Extension.
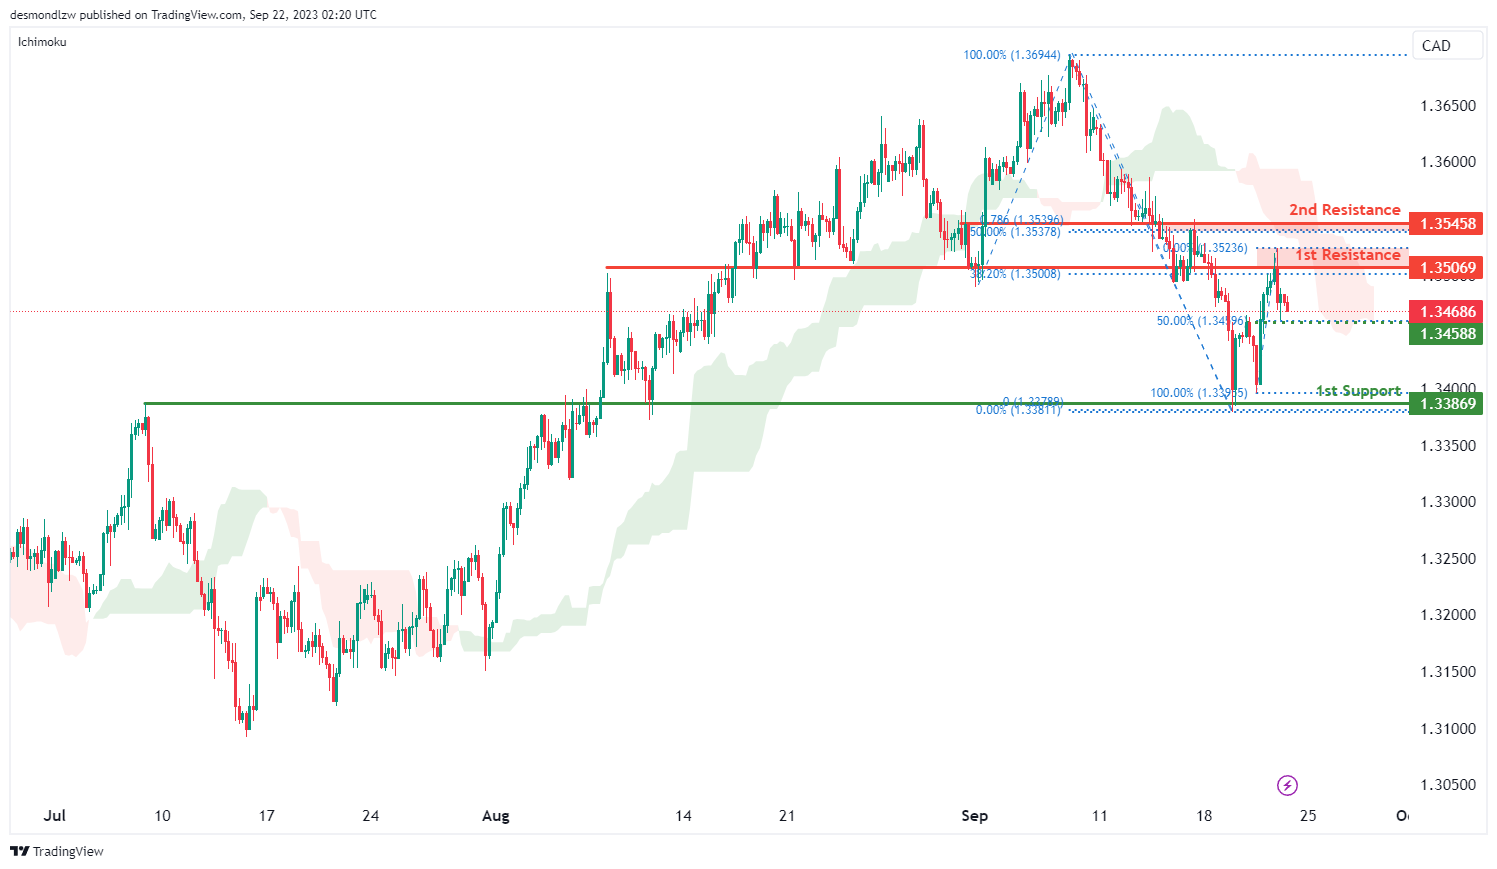
USD/CAD:
The USD/CAD chart is currently exhibiting an overall bearish momentum, indicating an downward trend with price making a bearish continuation towards the 1st support level should price break below the intermediate support at 1.3459 which is identified as a pullback support that aligns with the 50.00% Fibonacci retracement level.
The 1st support level at 1.3387 is identified as an overlap support, holding significance as a potential support zone.
To the upside, the 1st resistance level at 1.3507 is identified as an overlap resistance that aligns with the 38.20% Fibonacci retracement level. Furthermore, the 2nd resistance level at 1.3549 is marked as a pullback resistance that aligns with a confluence of Fibonacci levels i.e. the 50.00% retracement and the 78.60% projection levels.
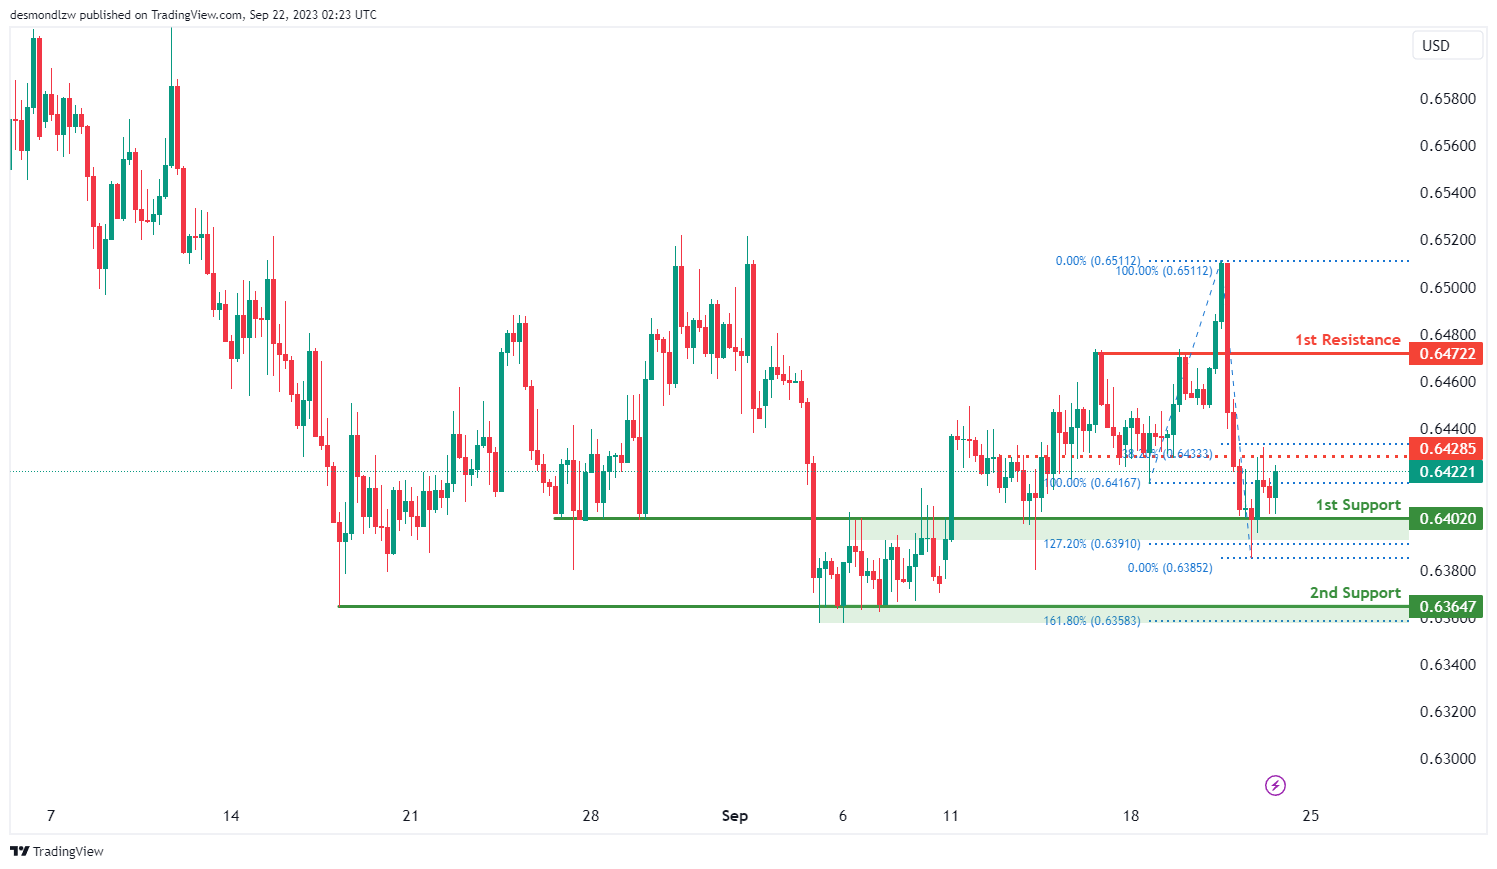
AUD/USD:
The AUD/USD chart is currently displaying an overall bullish momentum, suggesting a bullish continuation towards the 1st resistance level should price break above the intermediate resistance at 0.6429 which is identified as an overlap resistance that aligns with the 38.20% Fibonacci retracement level.
The 1st resistance level at 0.6472 is noted as a pullback resistance, representing a potential area where price might encounter resistance.
To the downside, the 1st support level at 0.6402 is identified as an overlap support that aligns with the 127.20% Fibonacci extension level. Furthermore, the 2nd support level at 0.6365 is marked as a pullback support that coincides with the 161.80% Fibonacci extension level.
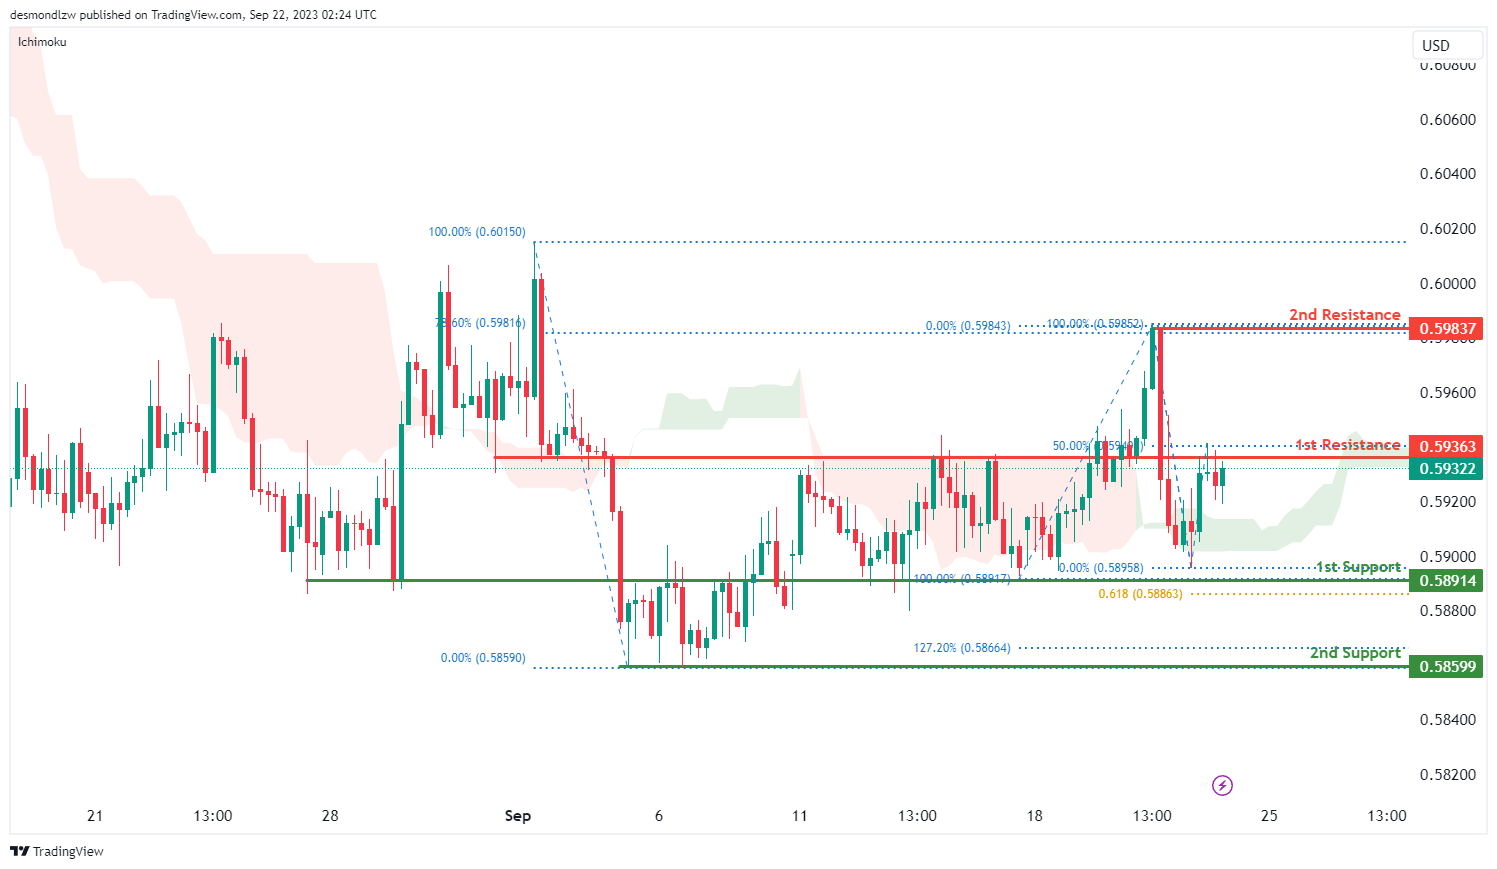
NZD/USD
The NZD/USD chart is currently displaying an overall bullish momentum, suggesting a bullish continuation towards the 1st resistance level.
The 1st resistance level at 0.5936 is identified as an overlap resistance that aligns with the 50.00% Fibonacci retracement level while the 2nd resistance level at 0.5984 is marked as a swing-high resistance that aligns with the 78.60% Fibonacci retracement level.
To the downside, the 1st support level at 0.5891 is identified as an overlap support that aligns with the 61.80% Fibonacci projection level. Additionally, the 2nd support level at 0.5859 is noted as a pullback support that coincides with the 127.20% Fibonacci extension level.
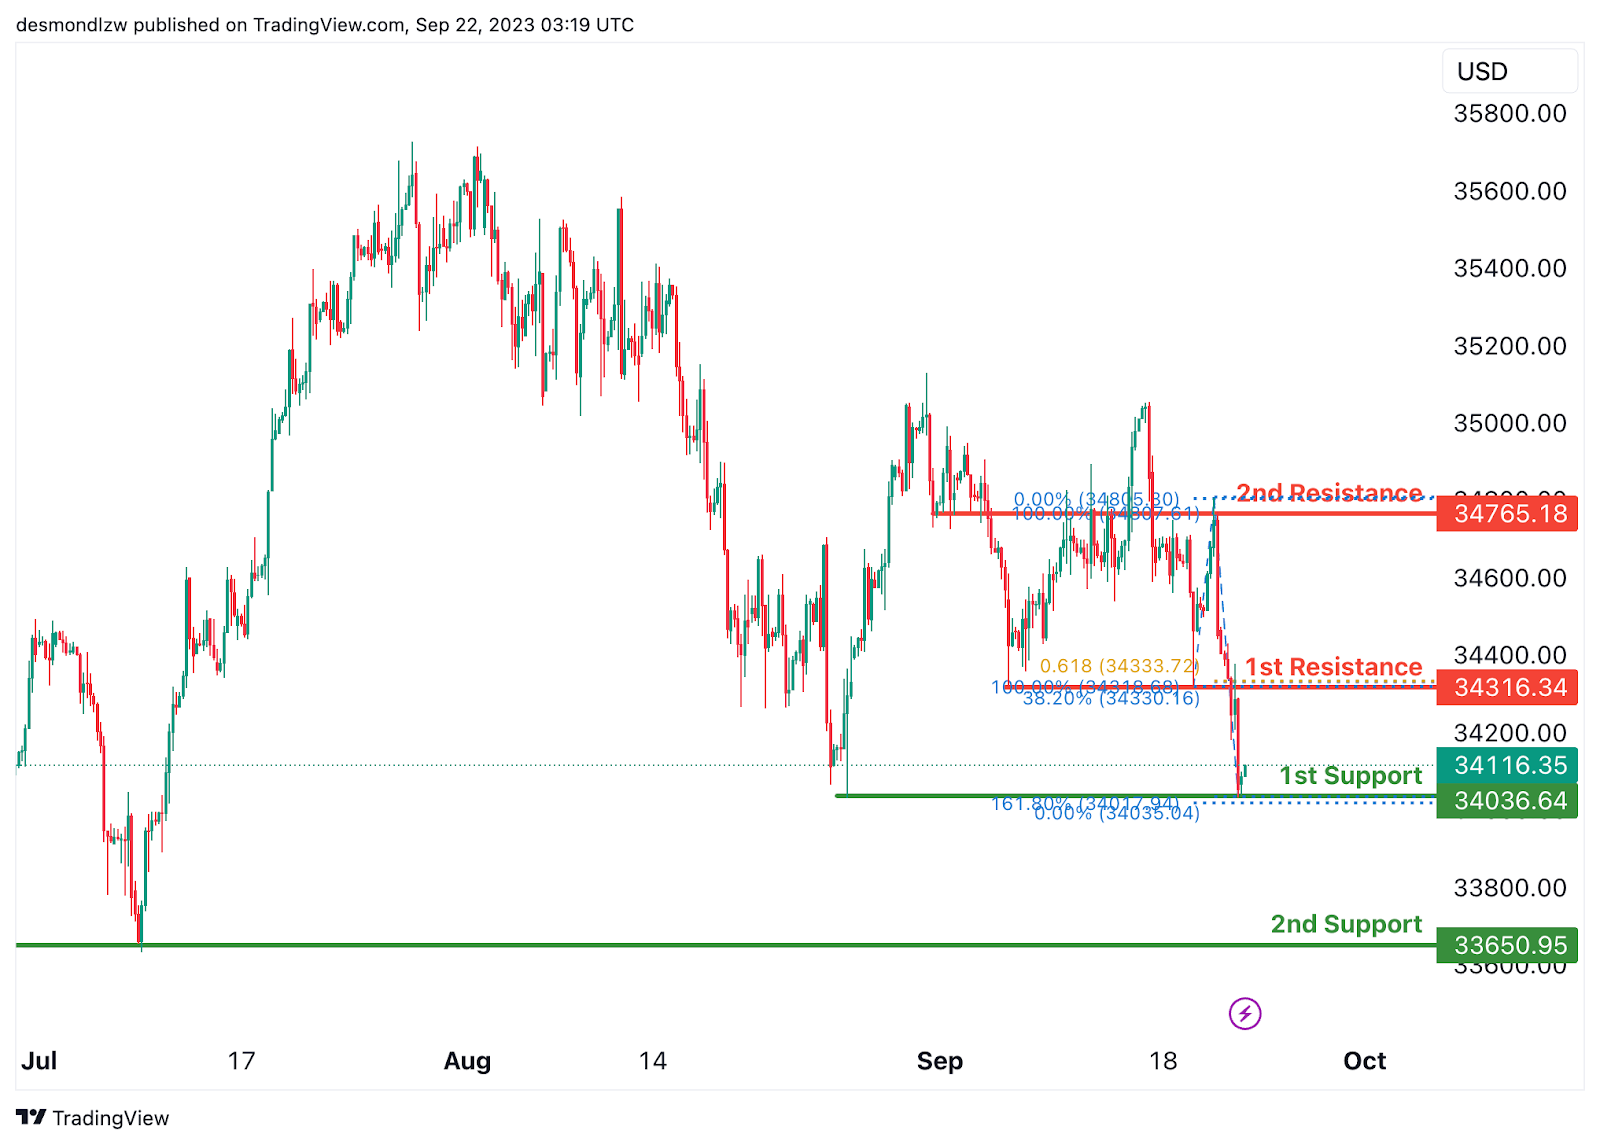
DJ30:
The instrument DJ30 currently shows a bullish overall momentum on the chart, and there’s potential for a bullish continuation towards the 1st resistance at 34316.34. This resistance level is considered strong due to its nature as a pullback resistance and its association with both the 61.80% Fibonacci Projection and the 38.20% Fibonacci Retracement, indicating a Fibonacci confluence.
The 1st support at 34036.64 is also noteworthy as it acts as a multi-swing low support and is associated with the 161.80% Fibonacci Extension, providing a strong level of potential support.
The 2nd support at 33650.95 is considered good as well, as it represents another multi-swing low support, offering an additional layer of potential support.
On the resistance side, we have the 2nd resistance at 34765.18, which is significant because it represents an overlap resistance, indicating a potential barrier to further bullish movement at this level.
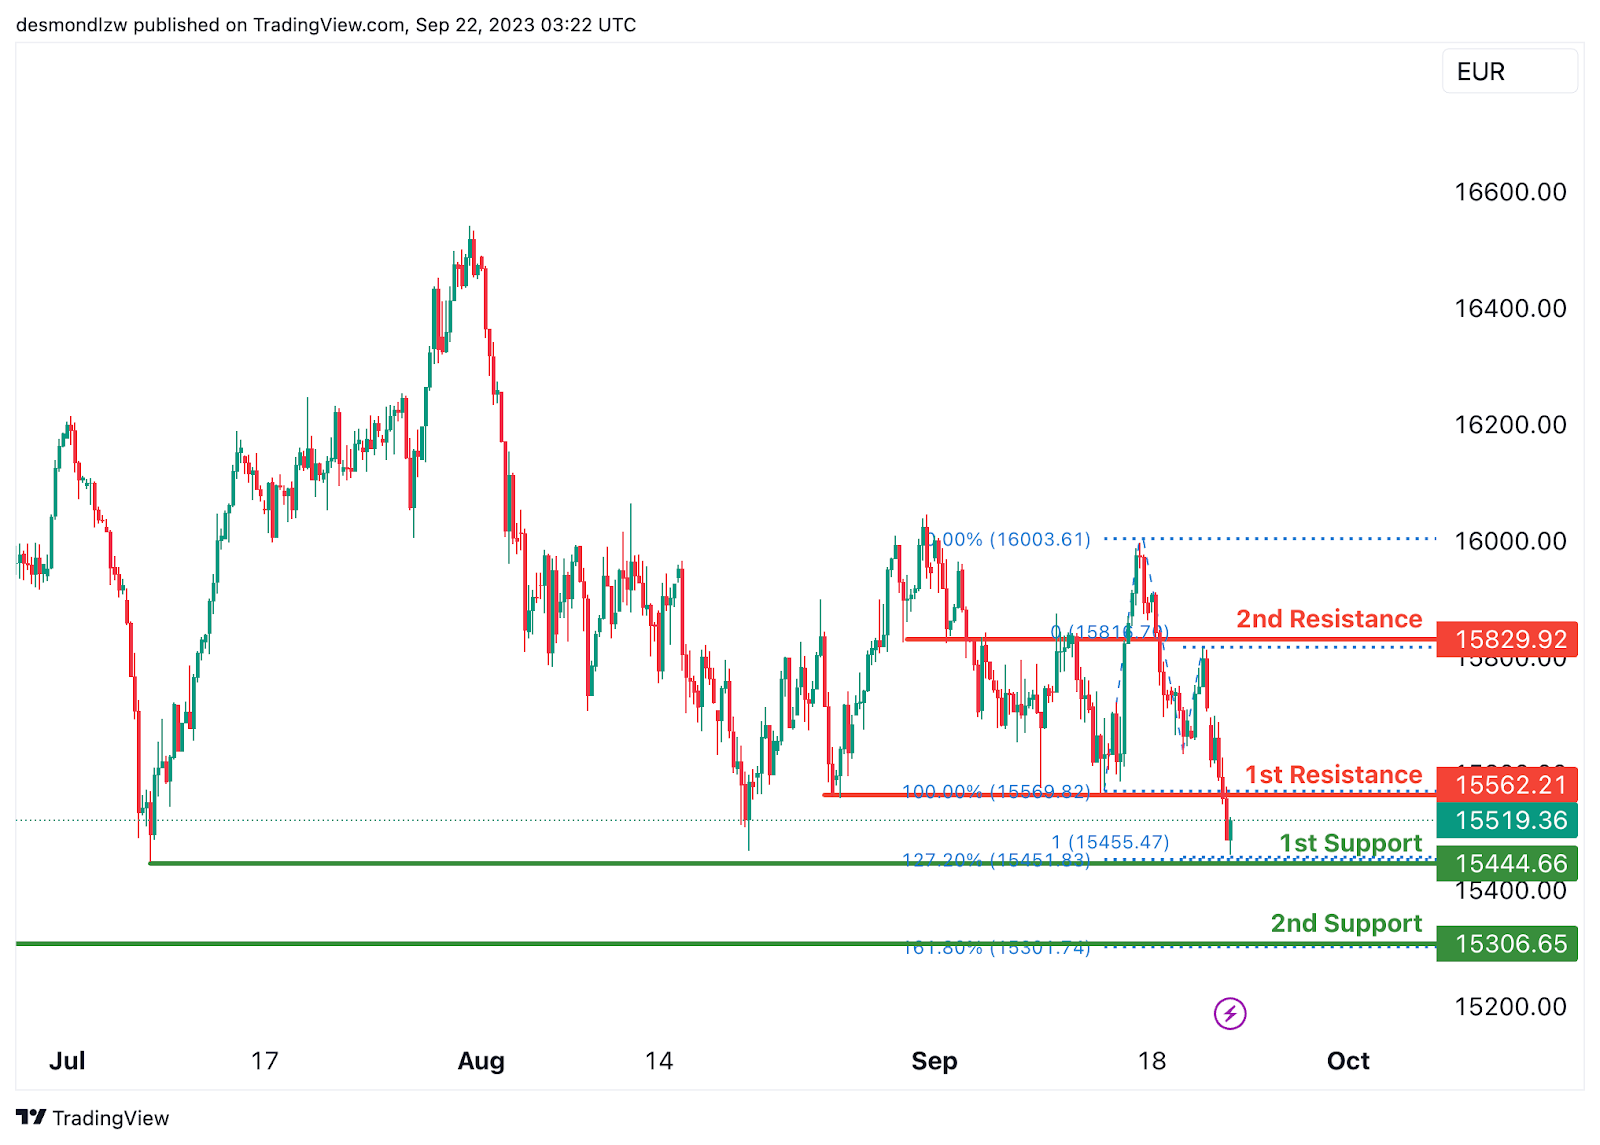
GER30:
The instrument GER30 currently indicates a bullish overall momentum on the chart, and there’s potential for a bullish continuation towards the 1st resistance at 15562.21.
The 1st support at 15444.66 is considered strong due to its status as a multi-swing low support and its association with the 127.20% Fibonacci Extension, as well as the 100% Fibonacci Projection, indicating a Fibonacci confluence. This makes it a robust level of potential support.
The 2nd support at 15306.65 is also notable as it acts as a pullback support and is associated with the 161.80% Fibonacci Extension, providing an additional layer of potential support.
On the resistance side, we have the 1st resistance at 15562.21, which is significant because it represents a pullback resistance.
Meanwhile, the 2nd resistance at 15829.92 is also a pullback resistance, suggesting potential barriers to further bullish movement at these levels.
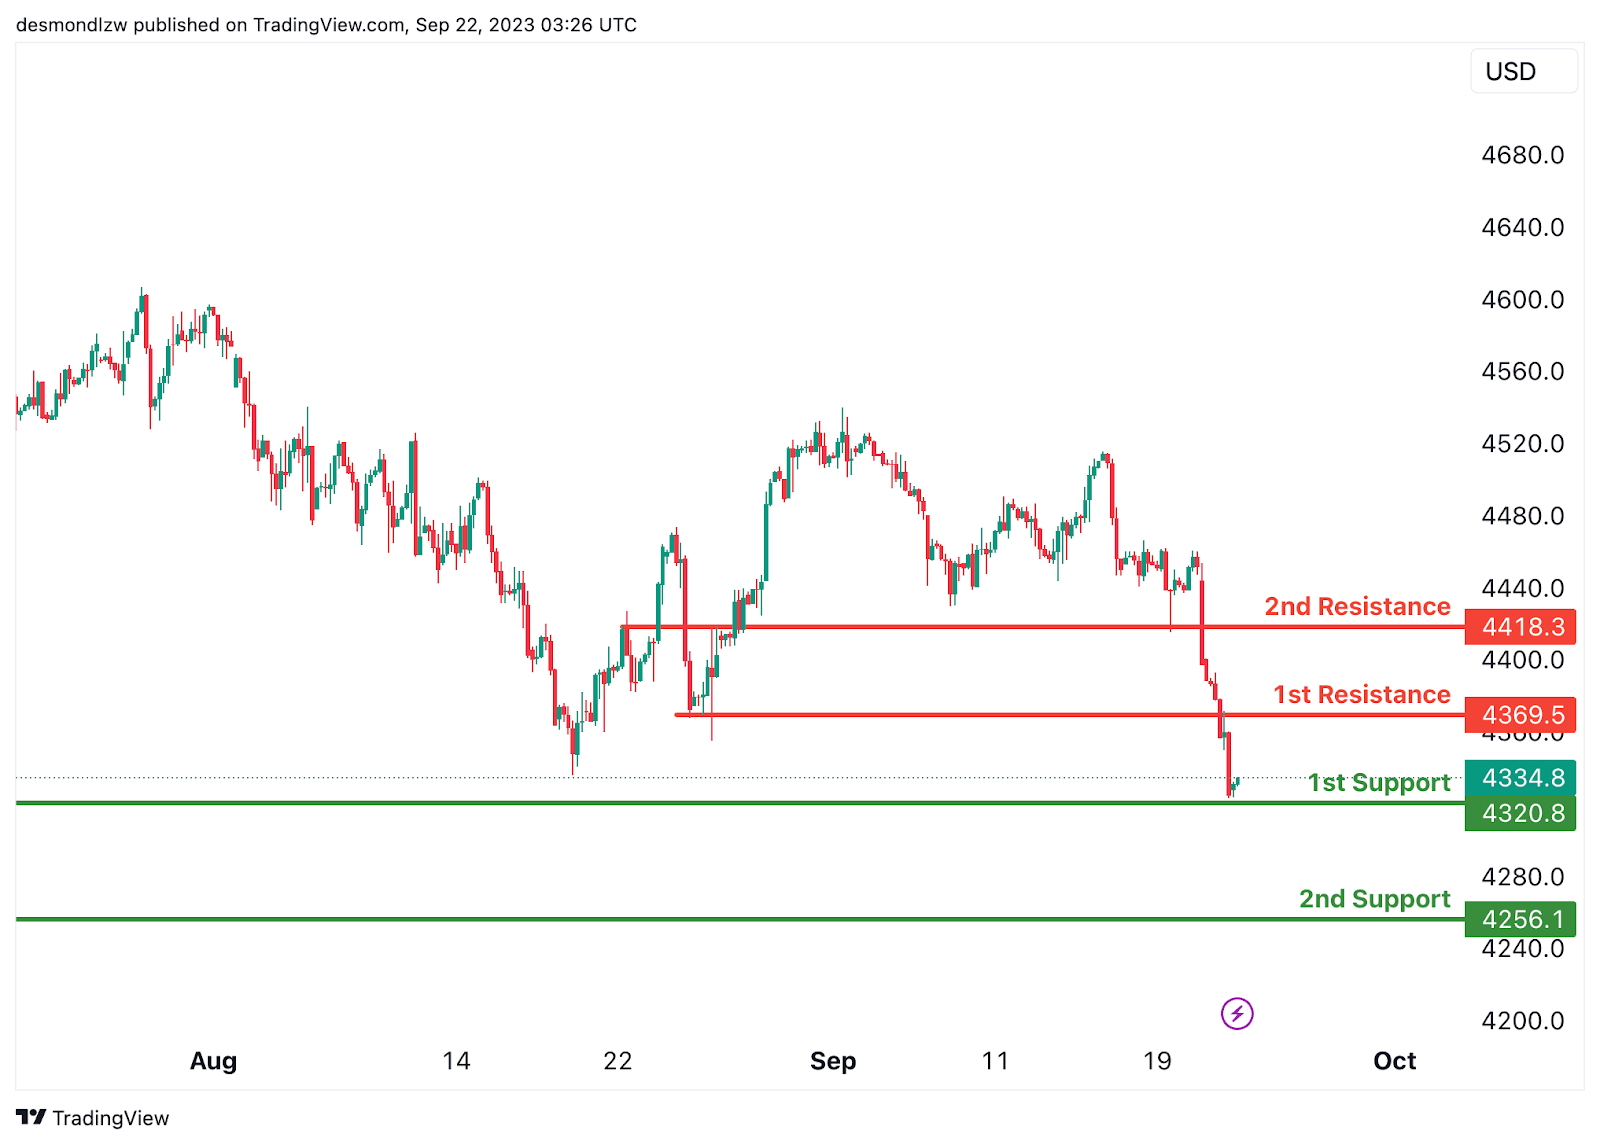
US500
The instrument US500 currently indicates a bullish overall momentum on the chart, and there’s potential for a bullish continuation towards the 1st resistance at 4369.5.
The 1st support at 4320.8 is considered strong due to its status as an overlap support, providing a solid level of potential support.
The 2nd support at 4256.1 is also notable as it acts as a swing low support, offering an additional layer of potential support.
On the resistance side, we have the 1st resistance at 4369.5, which is significant because it represents a pullback resistance.
Similarly, the 2nd resistance at 4418.3 is also a pullback resistance, suggesting potential barriers to further bullish movement at these levels.
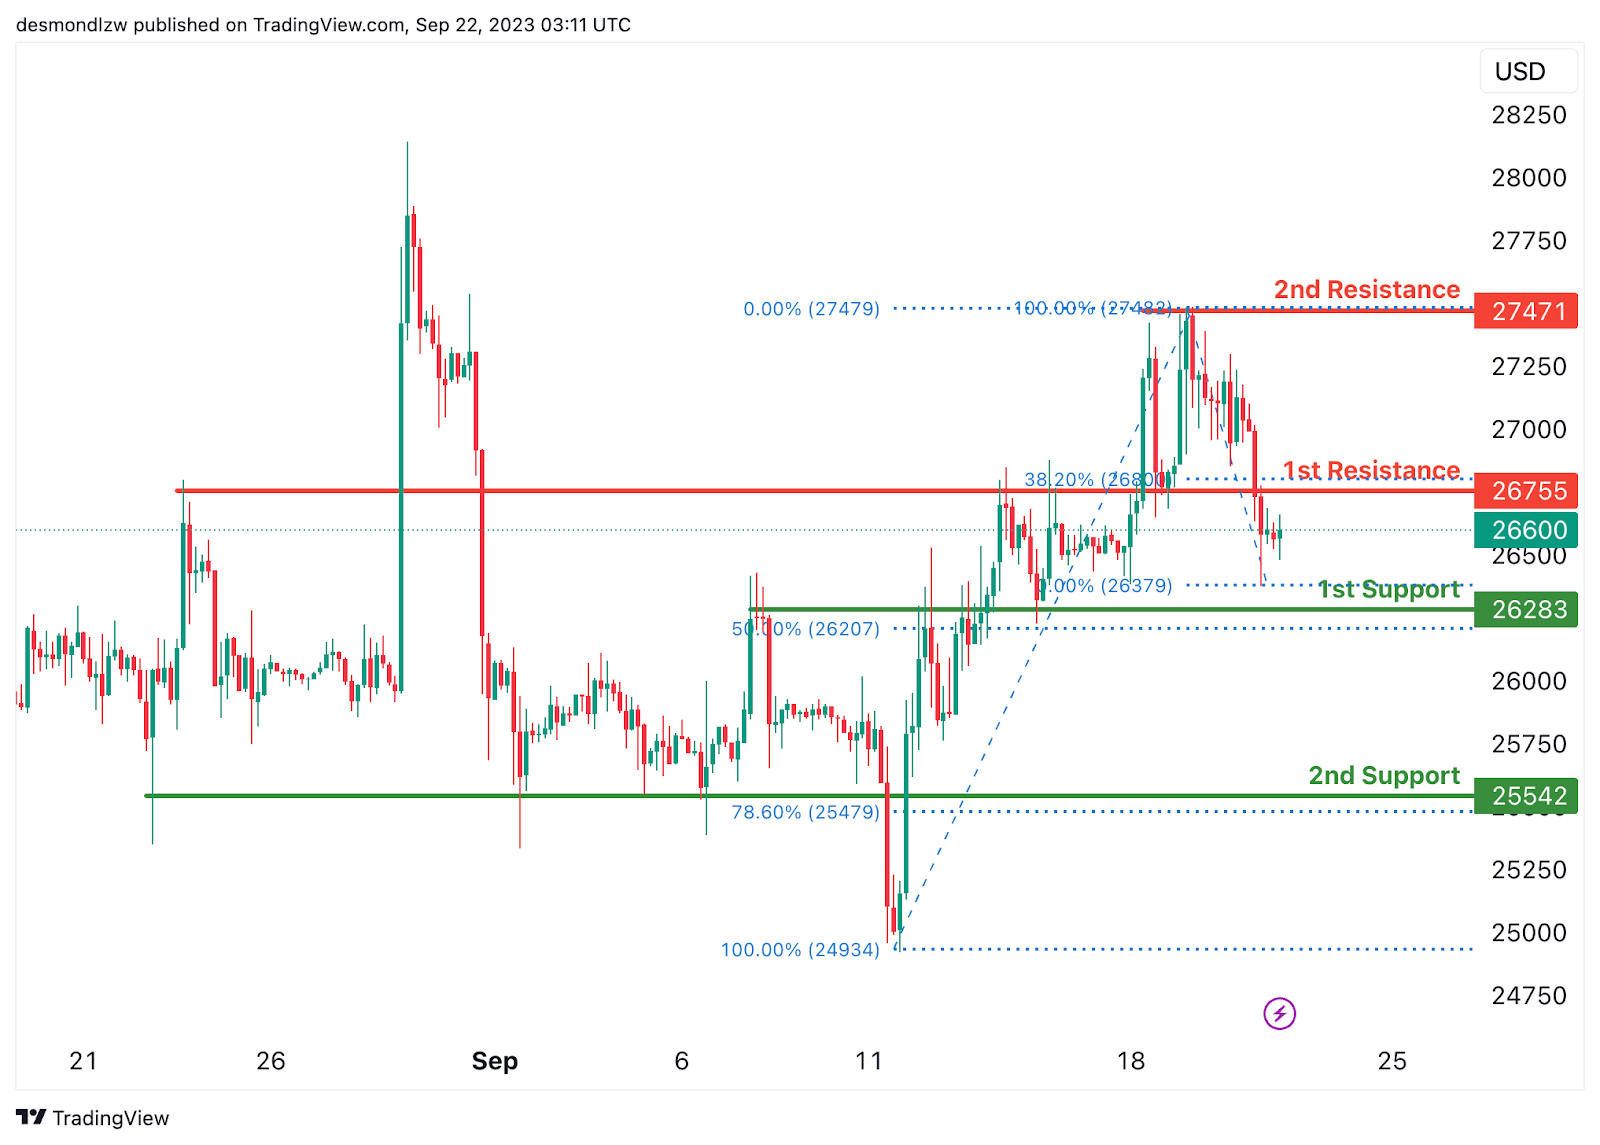
BTC/USD:
The instrument BTC/USD currently displays a bearish overall momentum on the chart. Factors contributing to this momentum include the expectation that the price could potentially rise towards the 1st resistance in the short term before reversing off it and dropping towards the 1st support.
The 1st support at 26283 is considered a good level of potential support due to its status as an overlap support and its association with the 50% Fibonacci Retracement.
The 2nd support at 25542 is also notable as it acts as a pullback support and is associated with the 78.60% Fibonacci Retracement, indicating another layer of potential support.
On the resistance side, we have the 1st resistance at 26755, which is significant because it represents a pullback resistance and is linked to the 38.20% Fibonacci Retracement.
Meanwhile, the 2nd resistance at 27471 is noteworthy as it functions as a swing high resistance, suggesting a potential point where the price may reverse its short-term rise and start to drop.
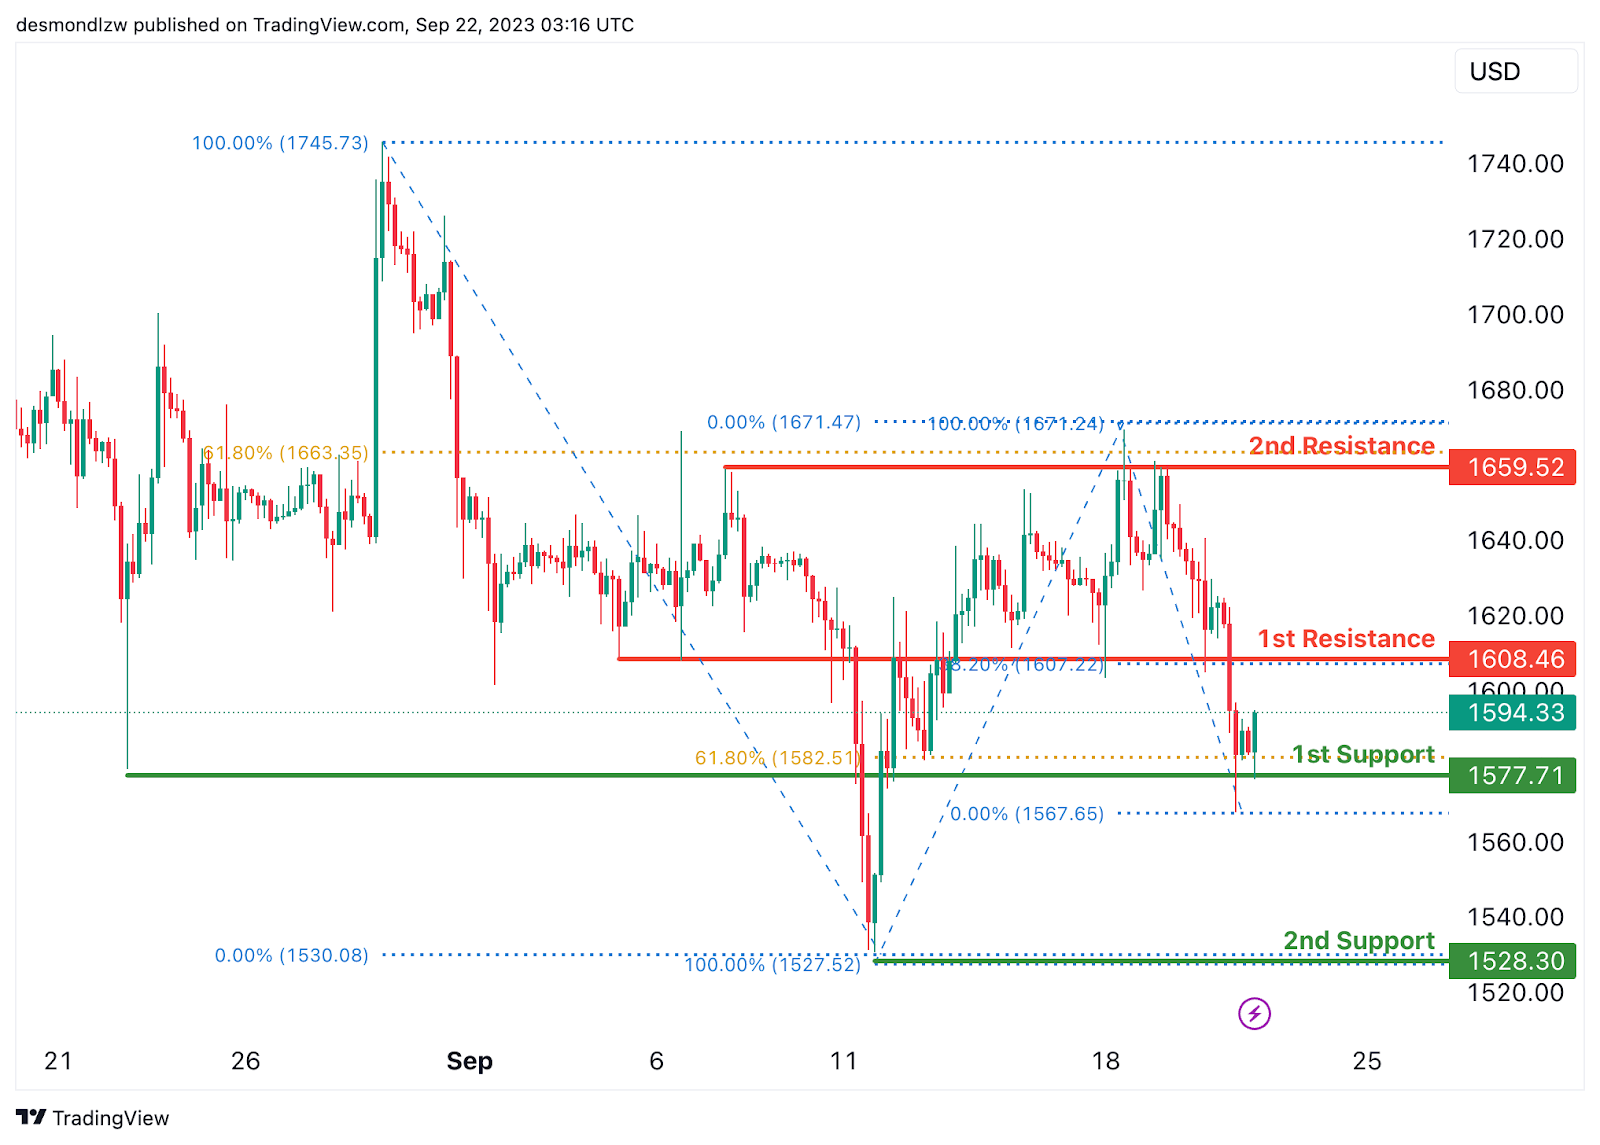
ETH/USD:
The instrument ETH/USD currently indicates a bullish overall momentum on the chart. There’s potential for a bullish continuation towards the 1st resistance at 1608.46, which is considered good due to its nature as a pullback resistance and its association with the 38.20% Fibonacci Retracement.
The 1st support at 1577.71 is also notable as it acts as an overlap support and is linked to the 61.80% Fibonacci Retracement, providing a strong level of potential support.
The 2nd support at 1528.30 is considered good as well, as it represents a multi-swing low support, offering an additional layer of potential support.
On the resistance side, we have the 2nd resistance at 1659.52, which is significant because it functions as a multi-swing high resistance and is associated with the 61.80% Fibonacci Retracement, indicating a potential barrier to further bullish movement at this level.
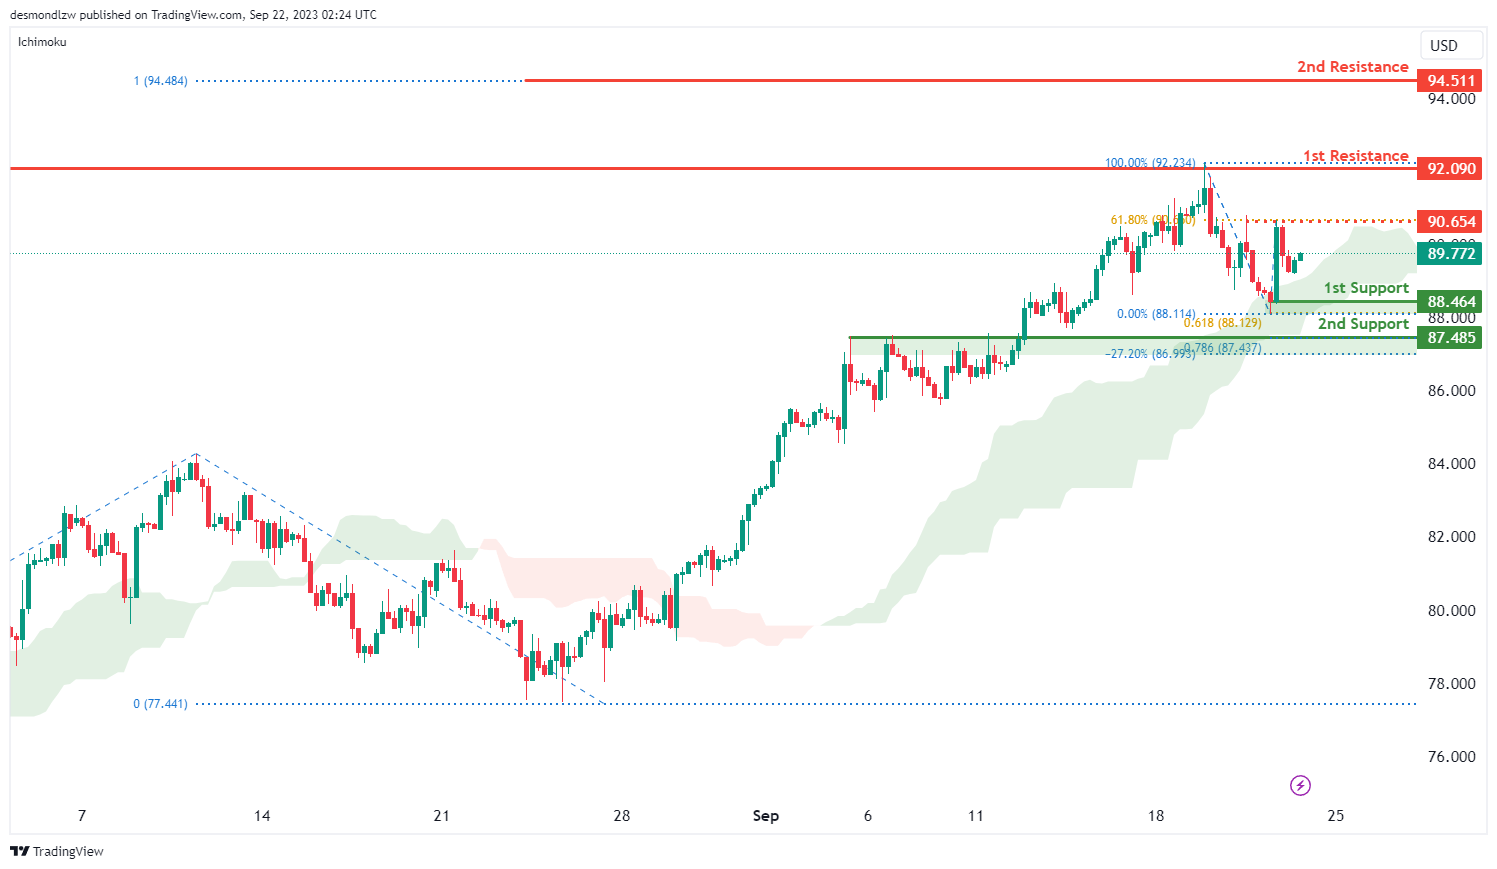
WTI/USD:
The WTI (West Texas Intermediate) chart currently exhibits an overall bullish momentum, suggesting the potential for a bullish continuation towards the 1st resistance level should price break above the intermediate resistance which is identified as pullback resistance that aligns with the 61.80% Fibonacci retracement level.
The 1st resistance level at 92.09 is identified as a multi-swing-high resistance while the 2nd resistance level at 94.51 is marked as a resistance level that aligns with the 100.00% Fibonacci projection level.
To the downside, the 1st support level at 88.46 is identified as a pullback support that aligns with 61.80% Fibonacci projection level. Additionally, the 2nd support level at 87.49 is also identified as a pullback support that aligns with a confluence of Fibonacci levels i.e. the 78.60% projection and the -27% expansion levels.


