
- The 10-week decline of the Nasdaq 100 has almost reached a key medium-term support of 14,300.
- The rising 10-year US Treasury yield is a significant factor that led to the recent decline of the Nasdaq 100.
- A daily bearish “Shooting Star” candlestick sighted yesterday on the 10-year US Treasury yield may trigger a counter trend rebound in the Nasdaq 100.
The price actions of the US Nas 100 Index (a proxy for the Nasdaq 100 futures) have indeed shaped the expected decline and broke below the short-term support of 14,750. Thereafter, it continued to tumble and printed an intraday low of 14,445 on Wednesday, 29 September.
The Index has now recorded a September month-to-date decline of -4.92% at this time of the writing which is on track for the worst monthly performance since December 2022.
In the lens of technical analysis, price actions do not move in a vertical direction as there tend to be several episodes of counter trend/mean reversion oscillations that go against a longer-term trending phase due to potential profit-taking activities, and reassessment of the current situation by market participants as key time periods approach such as month-end and quarterly-end closings (today is month-end as well as third quarter-end).
10-year US Treasury yield has shaped a daily bearish reversal candlestick
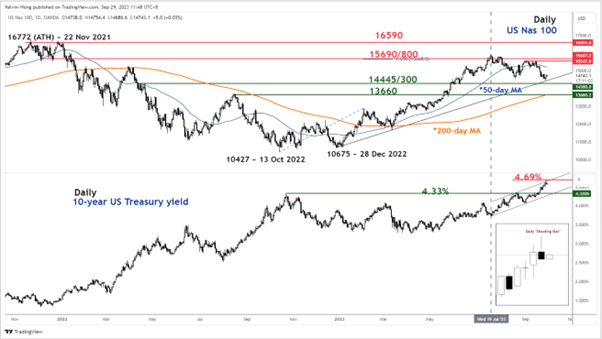
Fig 1: US Nas 100 medium-term trend with 10-year UST yield as of 29 Sep 2023 (Source: TradingView, click to enlarge chart)
Since 19 July 2023, the decline seen in the US Nas 100 Index has moved in an indirect lock-step movement with the longer-term 10-year US Treasury yield where the yield rallied to a 16-year high to print an intraday high of 4.69% yesterday, 28 September.
In a nutshell, in the past ten weeks, the rising 10-year US Treasury yield representing higher long-term borrowing costs is a significant factor contributing to the decline seen in the US Nas 100 Index as it falls under the “long-duration” risk asset classification; the present values of the longer-term revenue flows of the technology and meg-cap stocks of the Nasdaq 100 (Apple, Amazon, Alphabet, Meta, Microsoft, Tesla & Nvidia) are vulnerable to a higher interest rate environment.
Interestingly, the 10-year US Treasury yield formed a daily bearish reversal “Shooting Star” candlestick pattern yesterday right at the upper boundary of its medium-term ascending channel which suggests a potential corrective pull-back or retreat in the Treasury yield within its medium-term and major uptrend phases.
The formation of the daily bearish reversal “Shooting Star” seen in the 10-year US Treasury yield coincided with the price actions of the US Nas 100 hitting the medium-term support zone of 14,445/14,300 (also the ascending trendline from 28 December 2023 low).
Therefore, a potential impending pull-back in the 10-year US Treasury yield may lead to at least a short-term counter trend rebound in the US Nas 100 Index based on their recent significant indirect correlation.
Short-term momentum bullish breakout
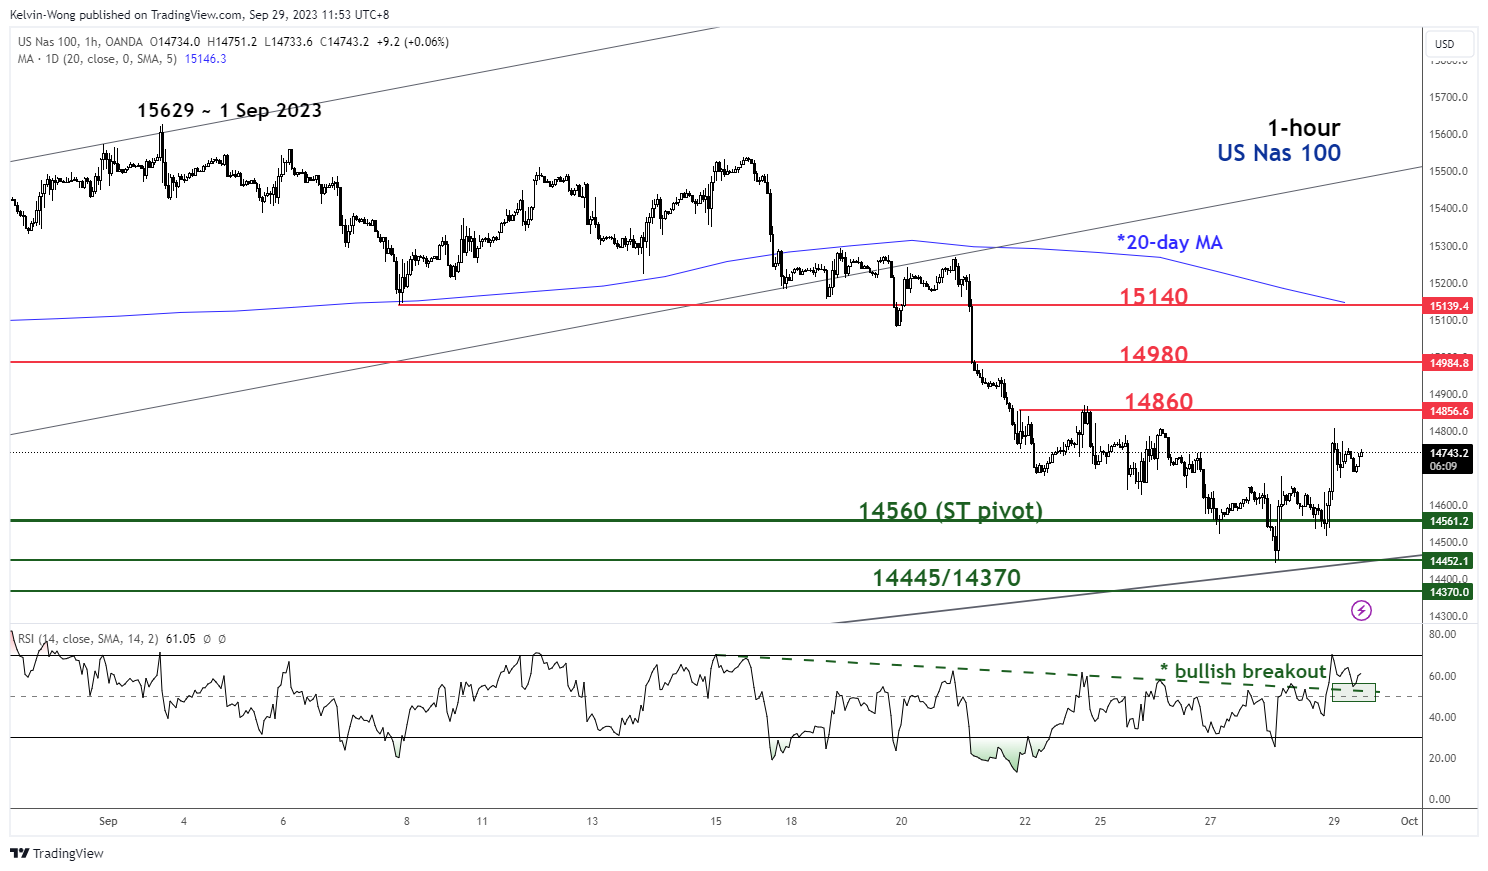
Fig 2: US Nas 100 minor short-term trend as of 29Sep 2023 (Source: TradingView, click to enlarge chart)
As seen on the shorter-term 1-hour chart, the hourly RSI of the US Nas 100 Index has staged a bullish breakout above the 50 level which suggests the recent downside momentum of the minor downtrend in place since the 15 September 2023 high has dissipated.
These observations also support a potential counter trend rebound scenario. Watch the 14,560 key short-term pivotal support with the next immediate resistances coming in at 14,860 and 14,980 (38.2% & 50% Fibonacci retracement of the recent minor downtrend from 15 September 2023 high to 28 September 2023 low).
However, a break below 14,560 invalidates the bullish tone for a slide to test the 14,445/14,370 key medium-term support zone.


 have indeed shaped the expected decline and broke below the short-term support of 14,750. Thereafter, it continued to tumble and printed an intraday low of 14,445 on Wednesday, 29 September.)