
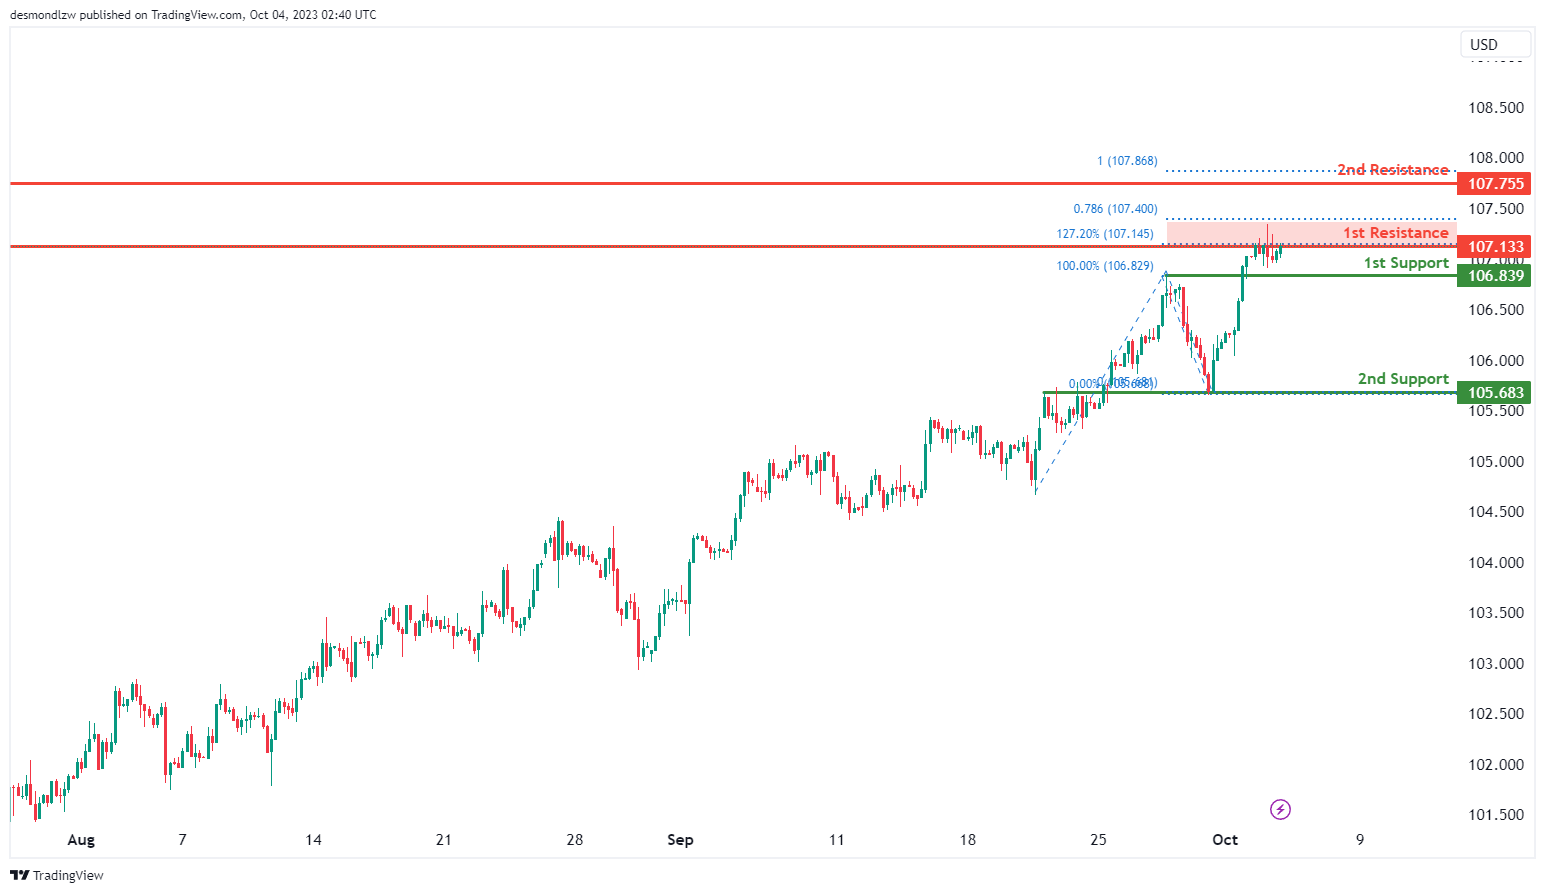
DXY:
The DXY chart currently has a bearish overall momentum. There’s a potential scenario of price fluctuating between the 1st resistance and 1st support levels.
The 1st support at 106.83 is considered a pullback support, while the 2nd support at 105.68 is an overlap support.
On the resistance side, the 1st resistance at 107.13 is marked as a multi-swing high resistance with the presence of the 127.20% Fibonacci Extension and 78.60% Fibonacci Projection, suggesting Fibonacci confluence. Additionally, the 2nd resistance at 107.75 is a swing high resistance with the 100% Fibonacci Projection.
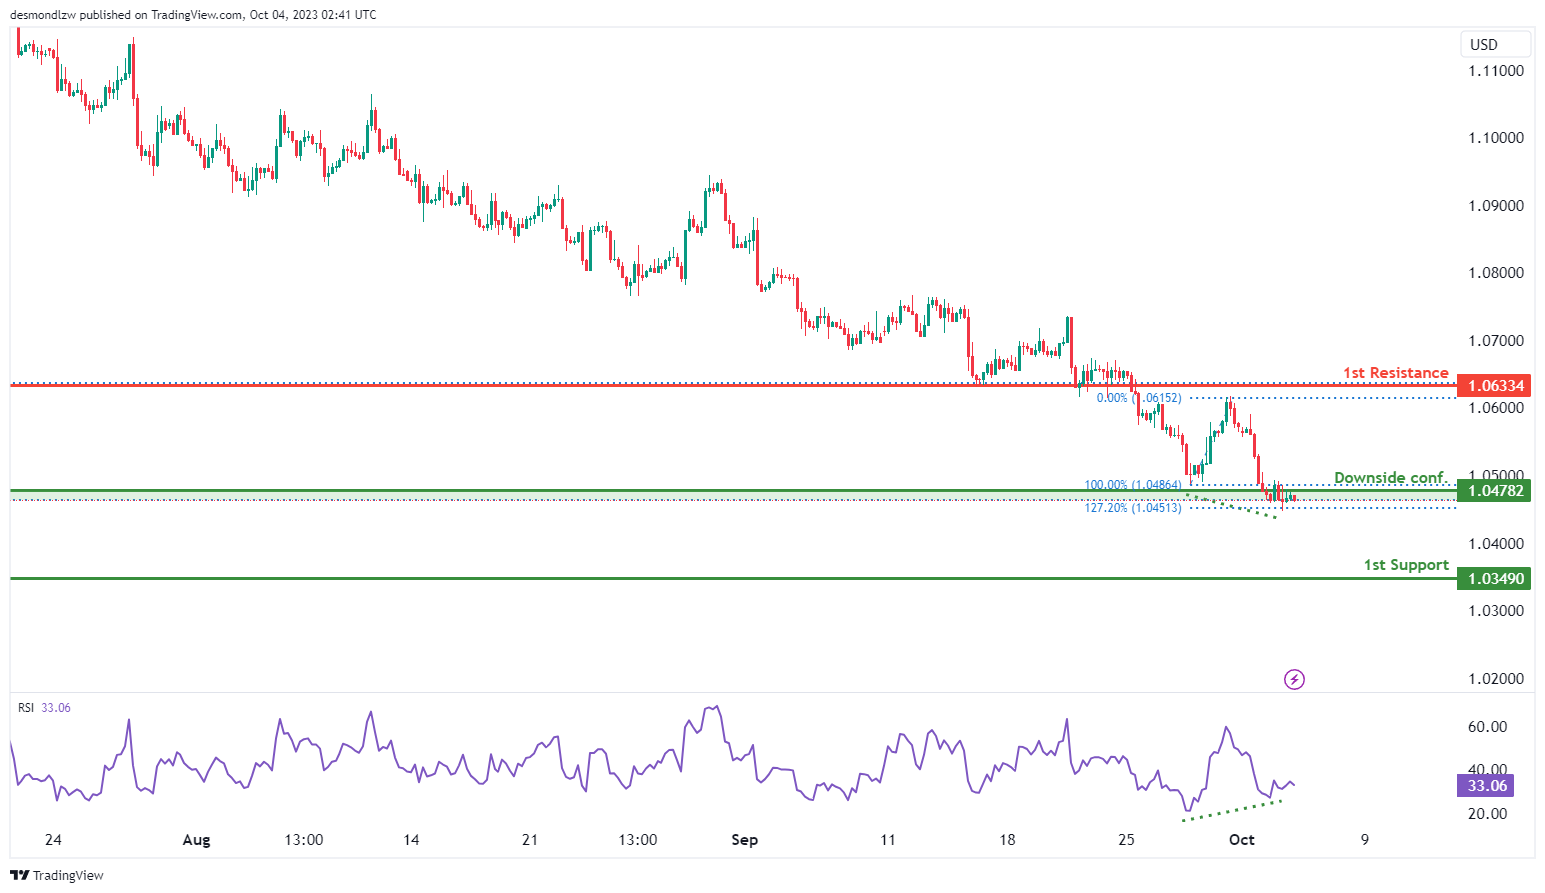
EUR/USD:
The EUR/USD chart currently shows a bearish momentum, and there is a potential scenario of a bearish continuation towards the 1st support level at 1.0349. This support level is significant as it aligns with the 127.20% Fibonacci Extension, indicating potential support.
Additionally, the 2nd support at 1.0478 is identified as a swing low support, further reinforcing its importance as a potential support level.
On the resistance side, the 1st resistance level at 1.0633 is categorized as an overlap resistance, which could act as a barrier to upward movements.
Moreover, the RSI is displaying bullish divergence versus price, suggesting the possibility of a bounce in the near future. This indicates that despite the bearish momentum, there might be a temporary reversal or retracement.
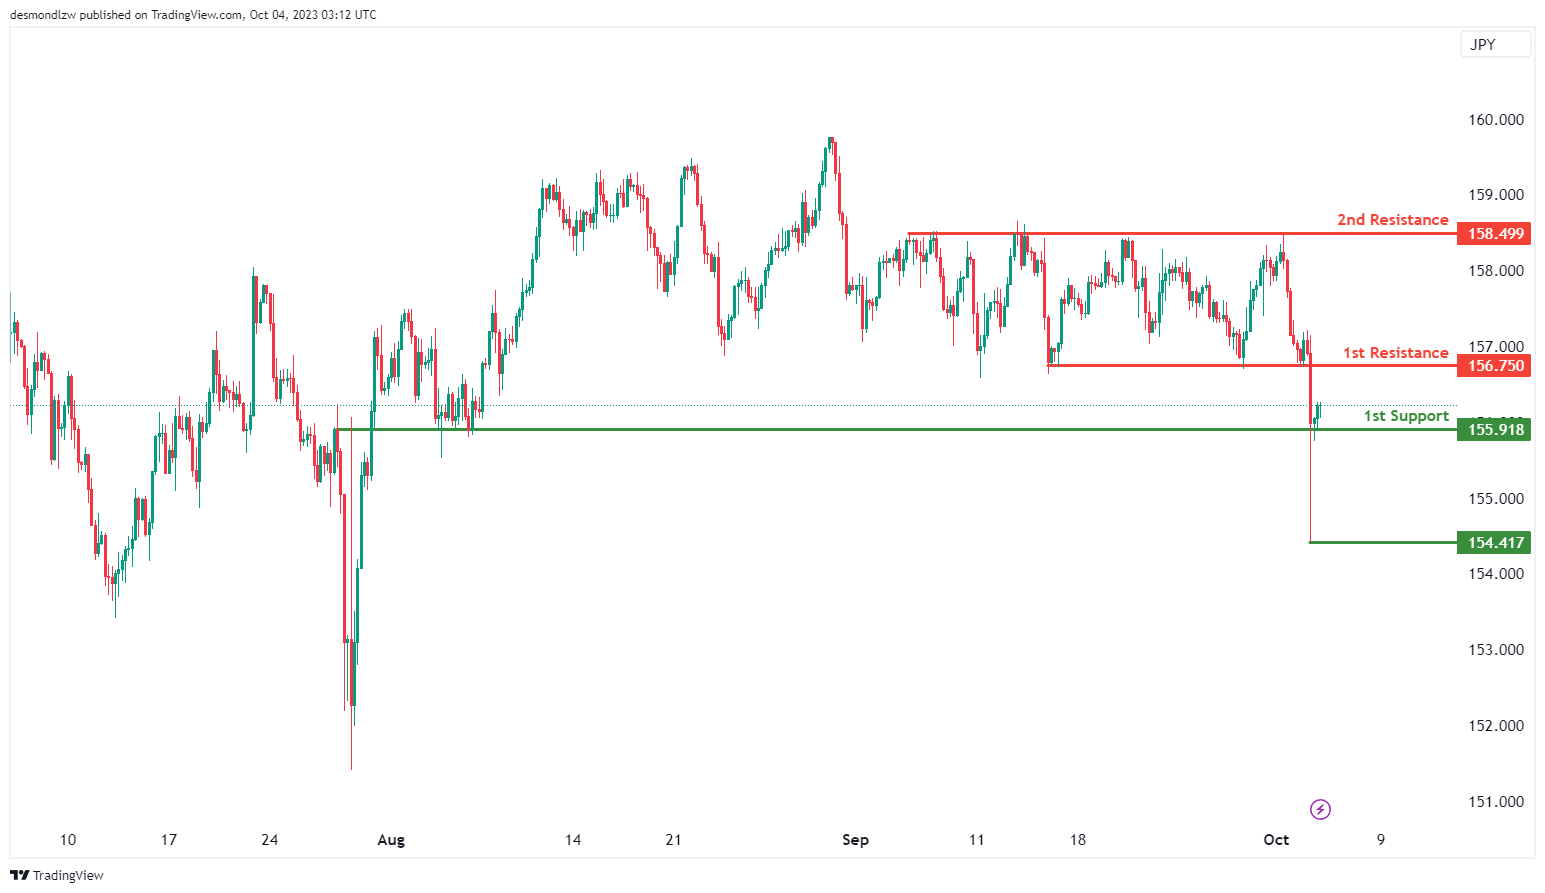
EUR/JPY:
The EUR/JPY chart currently demonstrates bullish momentum, indicating the potential for a bullish bounce off the 1st support level towards the 1st resistance. The 1st support at 155.91 is considered significant, marked as an overlap support. Additionally, the 2nd support at 154.41 serves as a swing low support, further emphasizing its importance as a potential price support level.
On the resistance side, the 1st resistance at 156.75 is characterized as a pullback resistance, potentially limiting further upward movements. The 2nd resistance at 158.49 is identified as a multi-swing high resistance, suggesting it may act as a significant barrier to bullish price movements.
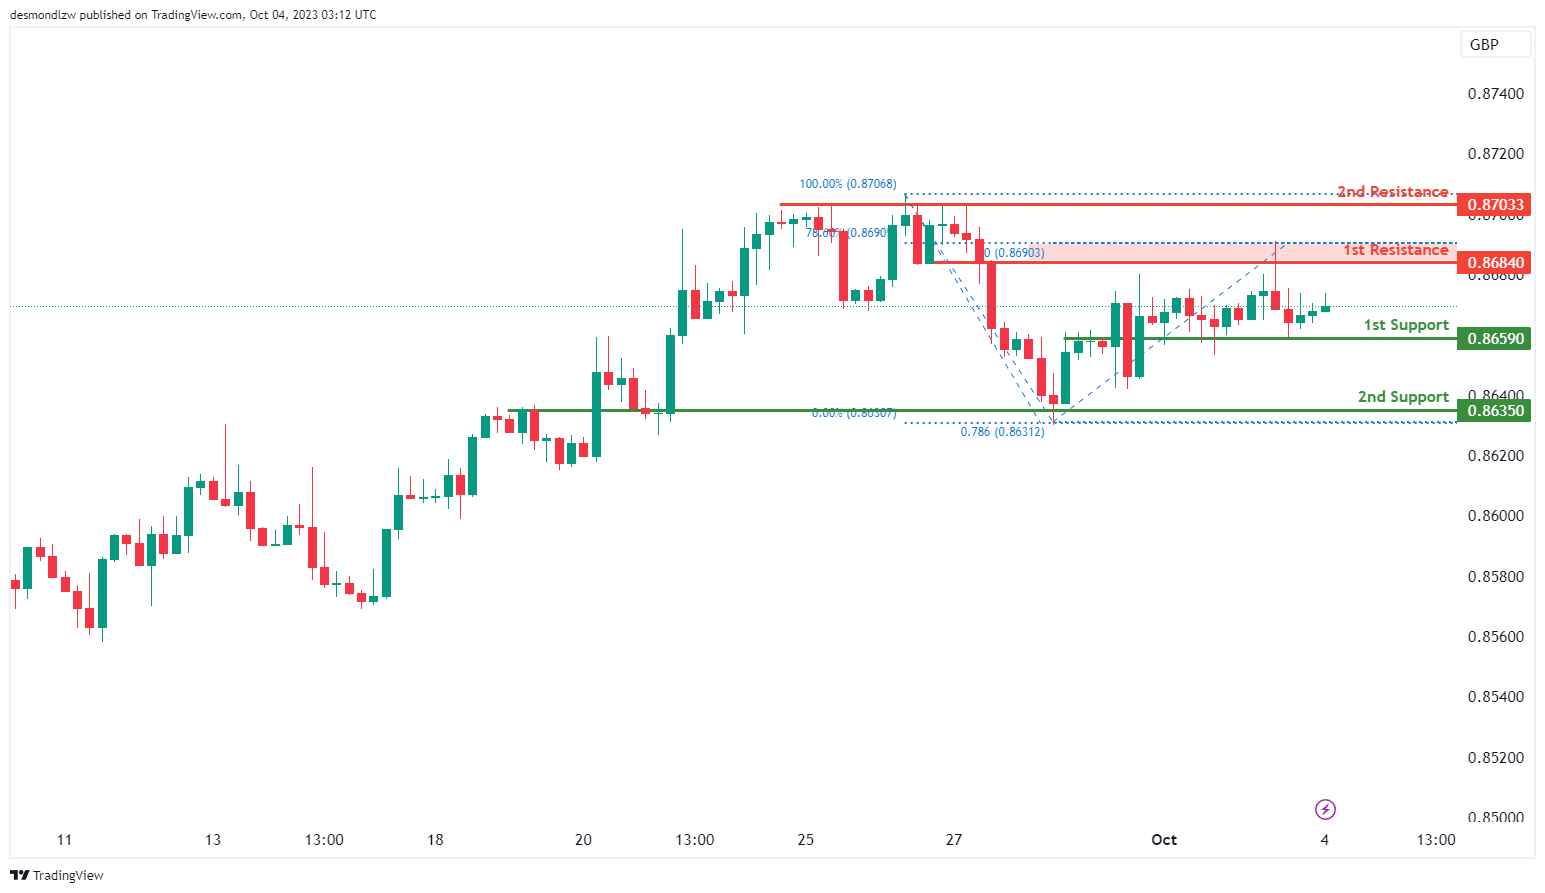
EUR/GBP:
The EUR/GBP chart is currently showing neutral momentum, suggesting a potential scenario where the price could fluctuate between the 1st support and 1st resistance levels. The 1st support at 0.8659 is considered significant as it’s identified as an overlap support, making it a crucial level for potential price support. Similarly, the 2nd support at 0.8635 is also categorized as an overlap support, reinforcing its importance as a potential support zone.
On the resistance side, the 1st resistance level at 0.8684 is recognized as an overlap resistance and is associated with the 78.60% Fibonacci Retracement, suggesting it may act as a barrier to price increases. The 2nd resistance at 0.8703 is identified as a multi-swing high resistance, emphasizing its significance in potential price reversals.
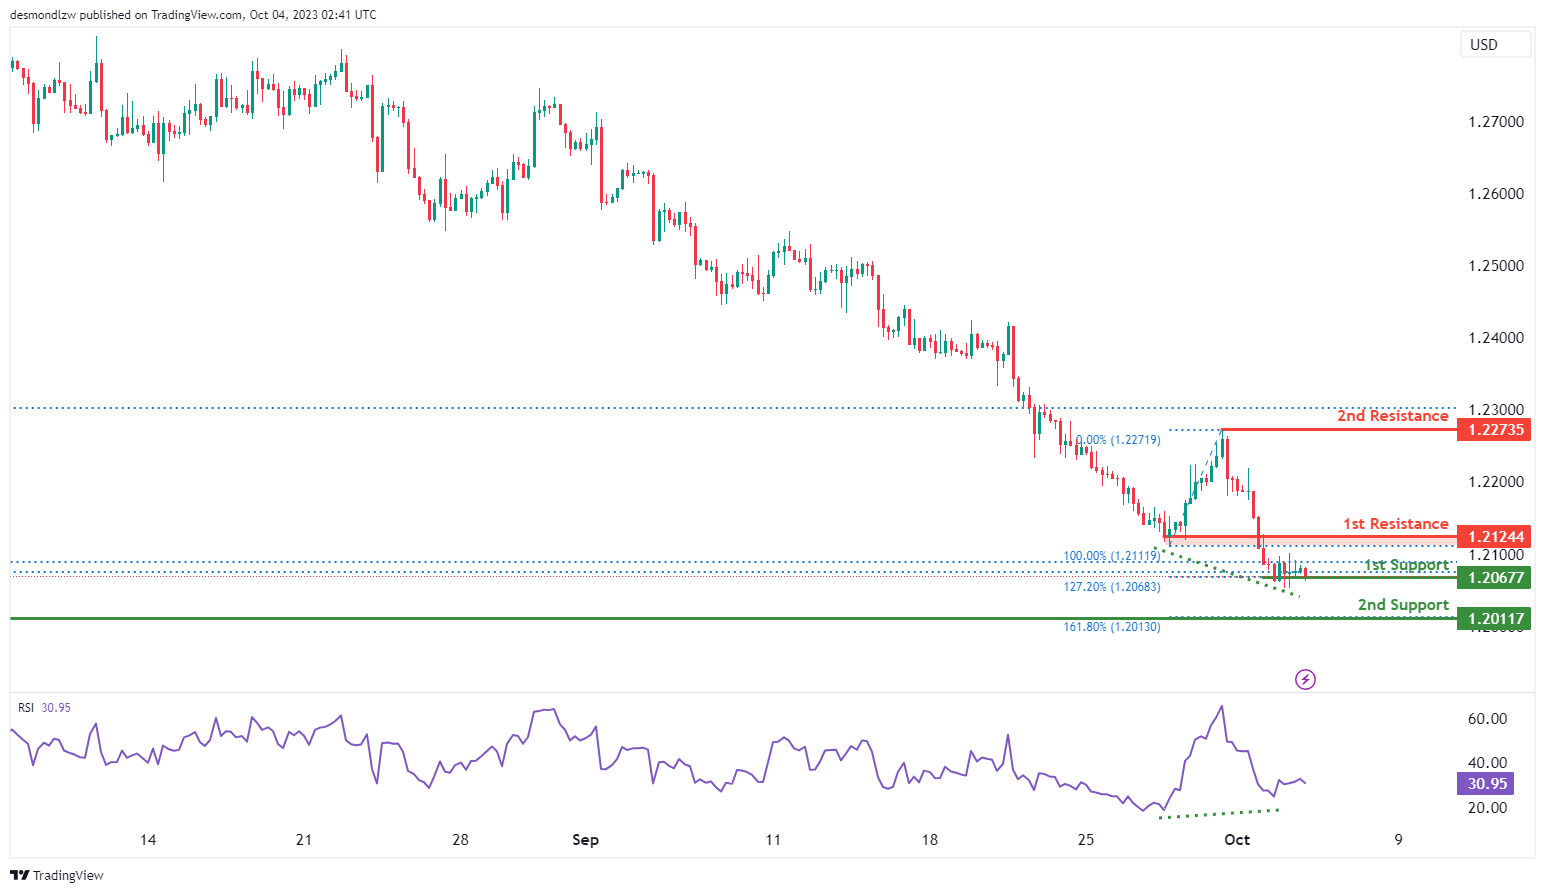
GBP/USD:
The GBP/USD chart currently exhibits a bullish momentum, and there is a potential scenario of a bullish bounce off the 1st support level at 1.2067. This support level is considered significant as it aligns with the 127.20% Fibonacci Extension. Furthermore, the 2nd support at 1.2011 is identified as a swing low support and coincides with the 161.80% Fibonacci Extension, reinforcing its importance.
On the resistance side, the 1st resistance at 1.2124 is characterized as an overlap resistance, suggesting it may act as a barrier to bullish movements. Beyond this, the 2nd resistance at 1.2273 is recognized as a swing high resistance, indicating its significance in potential price reversals.
Additionally, the RSI is displaying bullish divergence versus price, implying the possibility of a forthcoming bounce.
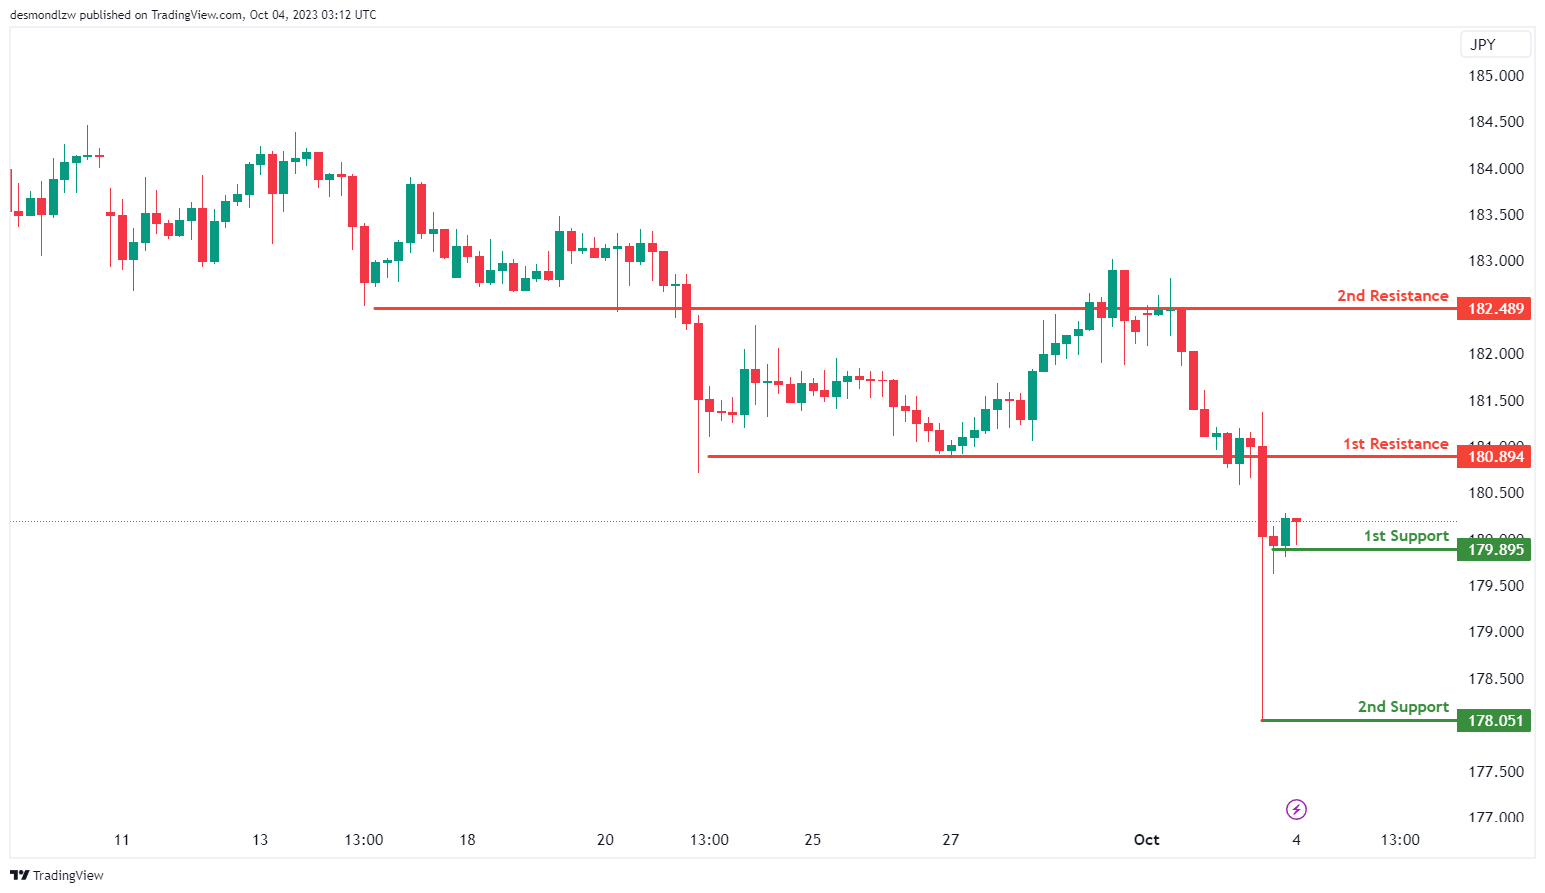
GBP/JPY:
The GBP/JPY chart currently has a bullish momentum, indicating a potential scenario where the price could experience a bullish bounce off the 1st support and move towards the 1st resistance level. The 1st support at 179.89 is considered significant as it aligns with a swing low support level. Additionally, the 2nd support at 178.05 is another swing low support, further reinforcing its importance as a potential area of price support.
On the resistance side, the 1st resistance level at 180.89 is identified as a pullback resistance, potentially limiting upward movements. Beyond this, the 2nd resistance at 182.48 is categorized as an overlap resistance, suggesting it may act as a barrier to further bullish movements.
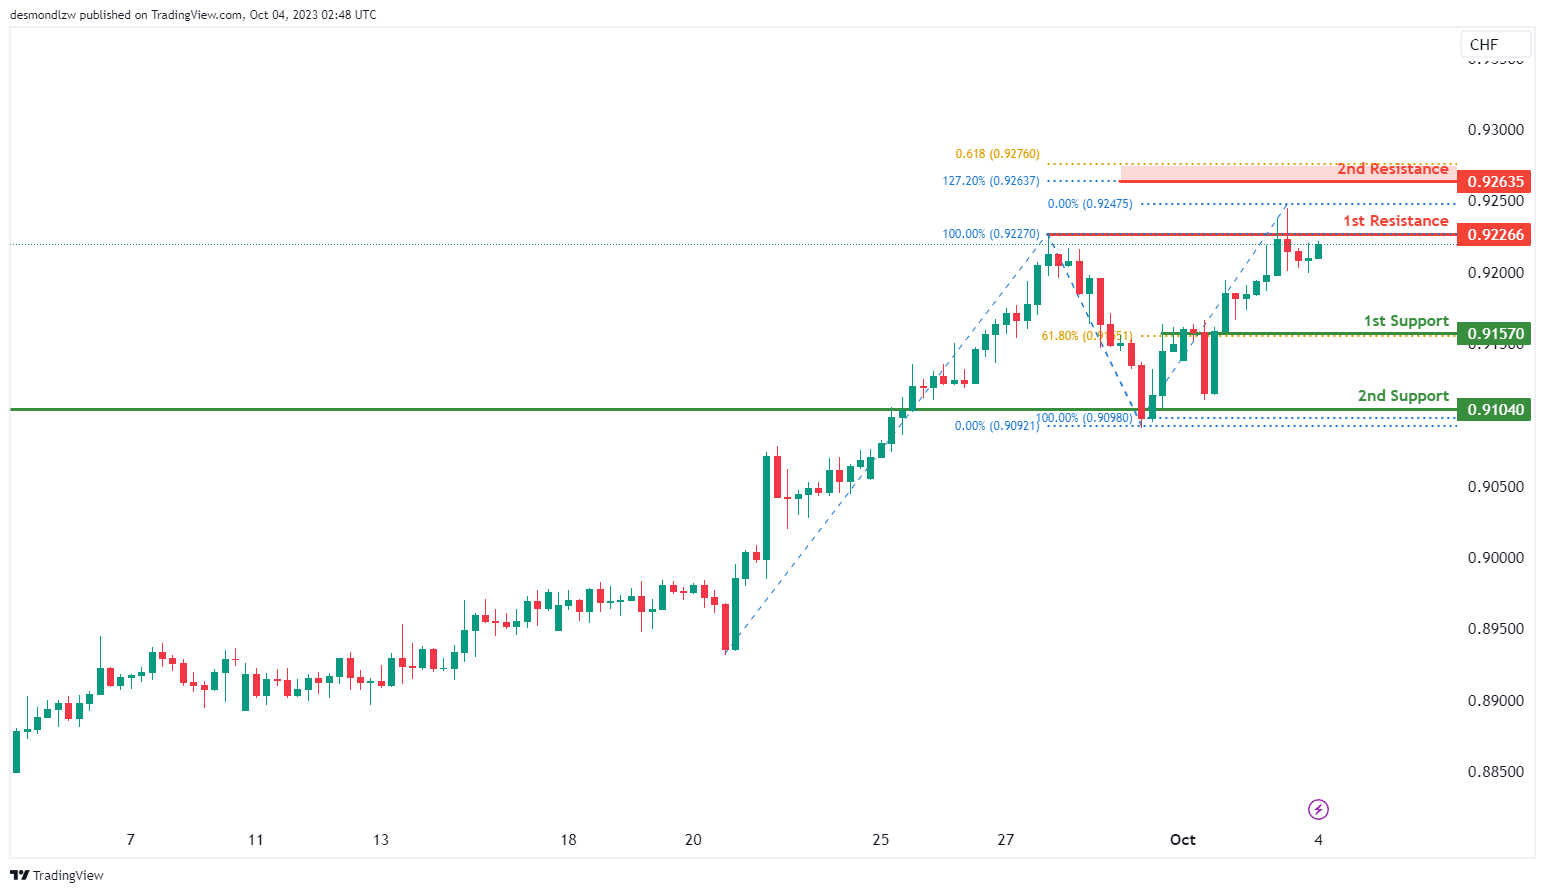
USD/CHF:
The USD/CHF chart currently has a bearish momentum, and there is a potential scenario of a bearish reaction off the 1st resistance level at 0.9226, which is supported by the presence of the 50% Fibonacci retracement. This resistance level could lead to a drop towards the 1st support at 0.9157, which is considered significant due to its alignment with the 61.80% Fibonacci retracement.
Additionally, the 2nd support at 0.9104 is identified as an overlap support, reinforcing its importance as a potential zone for price support. On the other hand, the 2nd resistance at 0.9263 is noteworthy as it exhibits Fibonacci confluence, with both the 161.80% Fibonacci Extension and 61.80% Fibonacci retracement indicating its significance in potential price reversals.
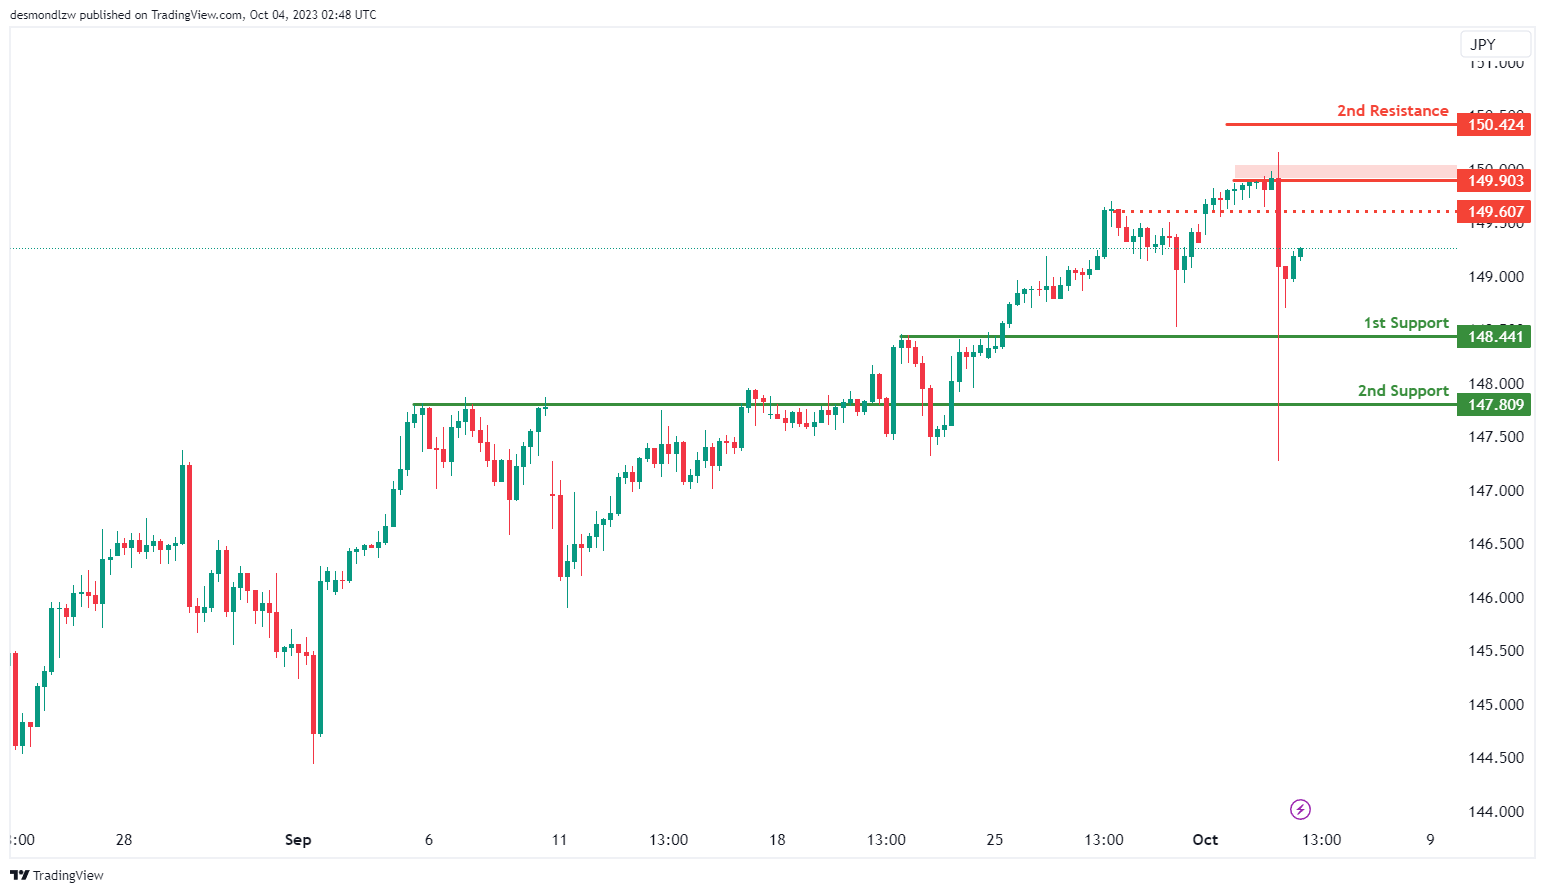
USD/JPY:
The USD/JPY chart currently exhibits a bullish momentum, and there is a potential scenario of a bullish continuation towards the 1st resistance level at 149.90, which is considered significant as it’s marked as a swing high resistance. This resistance level may act as a barrier to further upward movements.
On the support side, the 1st support at 148.44 is categorized as a pullback support, potentially providing necessary support in case of pullbacks. Additionally, the 2nd support at 147.80 is also identified as a pullback support, indicating its importance for potential price reversals. Furthermore, there is an intermediate resistance at 149.60, which is marked as a pullback resistance, contributing to potential price movements.
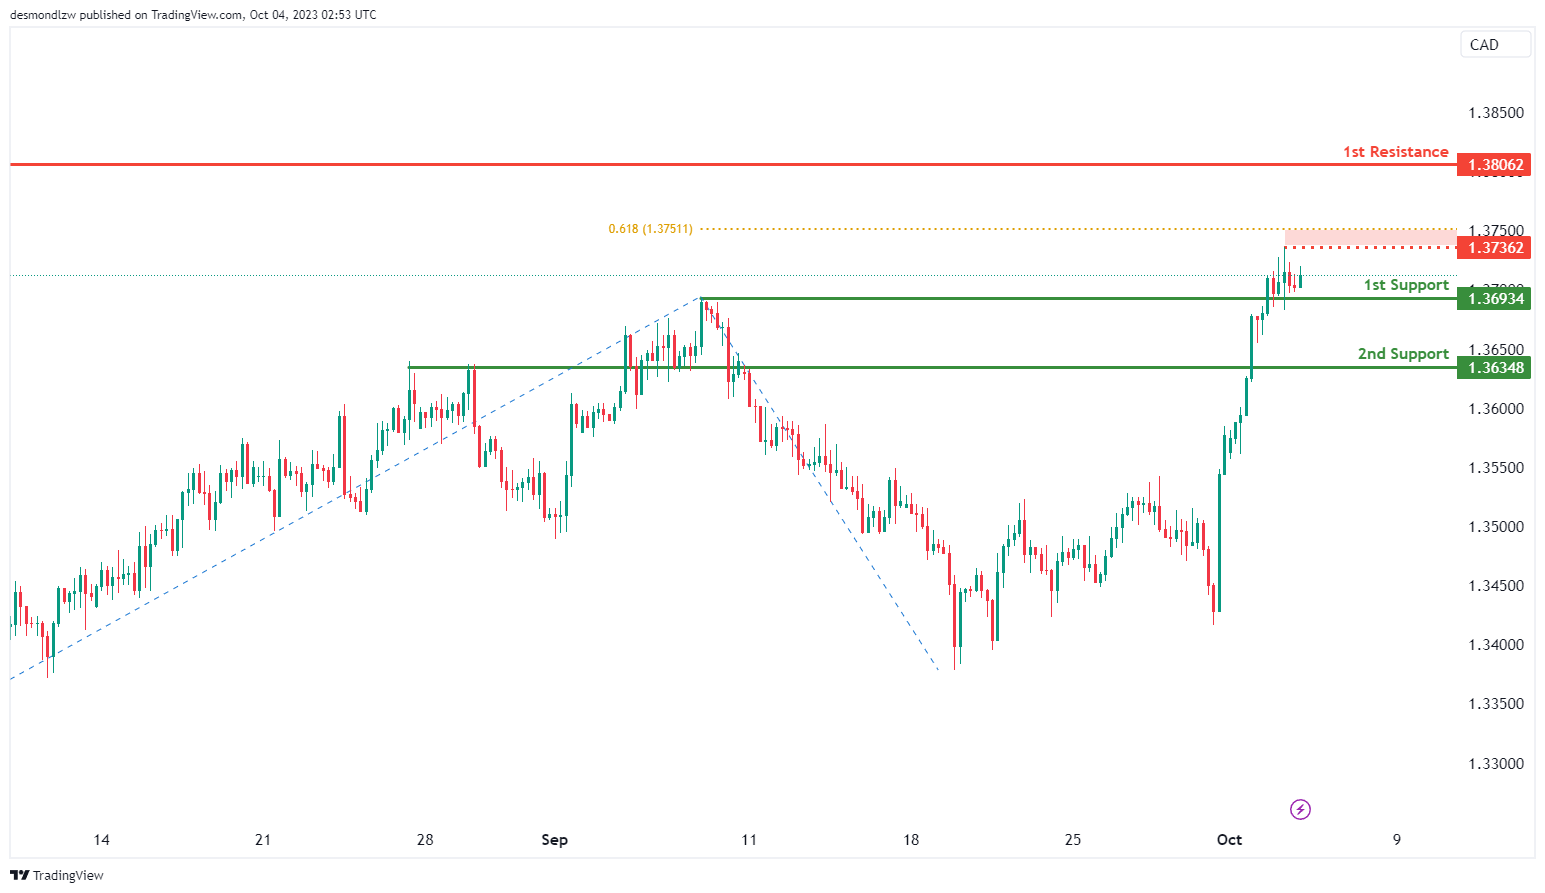
USD/CAD:
The USD/CAD chart is currently showing bullish momentum, and it suggests the possibility of a bullish continuation towards the 1st resistance level. The 1st support at 1.3693 is considered a significant level of potential price support, characterized as an overlap support. Additionally, the 2nd support at 1.3634 acts as a pullback support, further reinforcing its importance.
On the resistance side, the 1st resistance at 1.3806 is a swing high resistance, which may hinder further upward movement. Intermediate resistance at 1.3736 holds significance due to its alignment with the 61.80% Fibonacci Projection, indicating its potential role in price reversals.
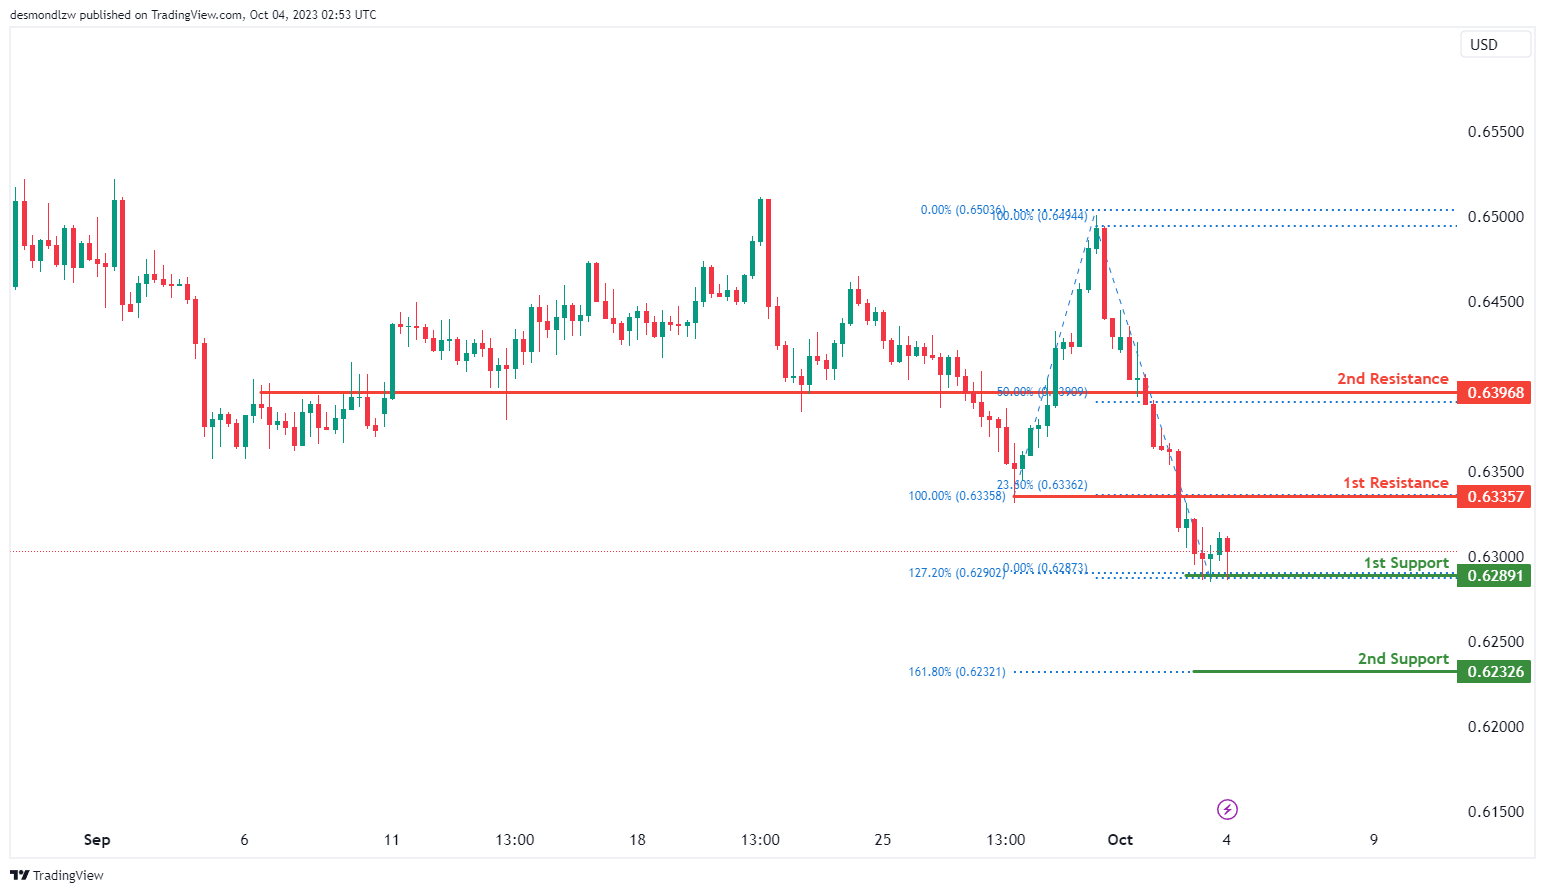
AUD/USD:
The AUD/USD chart currently has a bullish momentum, and there is a potential scenario for a bullish bounce off the 1st support level at 0.6289. This support level is considered significant as it aligns with a multi-swing low support and the 127.20% Fibonacci Extension, indicating it could provide strong support for price movements.
Additionally, the 2nd support at 0.6291 is also noteworthy, as it coincides with the 161.80% Fibonacci Extension, reinforcing its importance as a potential support level.
On the resistance side, the 1st resistance level at 0.6335 is categorized as a pullback resistance, which could potentially limit further upward movements. Beyond this, the 2nd resistance at 0.6396 is marked as a pullback resistance and aligns with the 50% Fibonacci Retracement, further emphasizing its significance in potential price reversals.
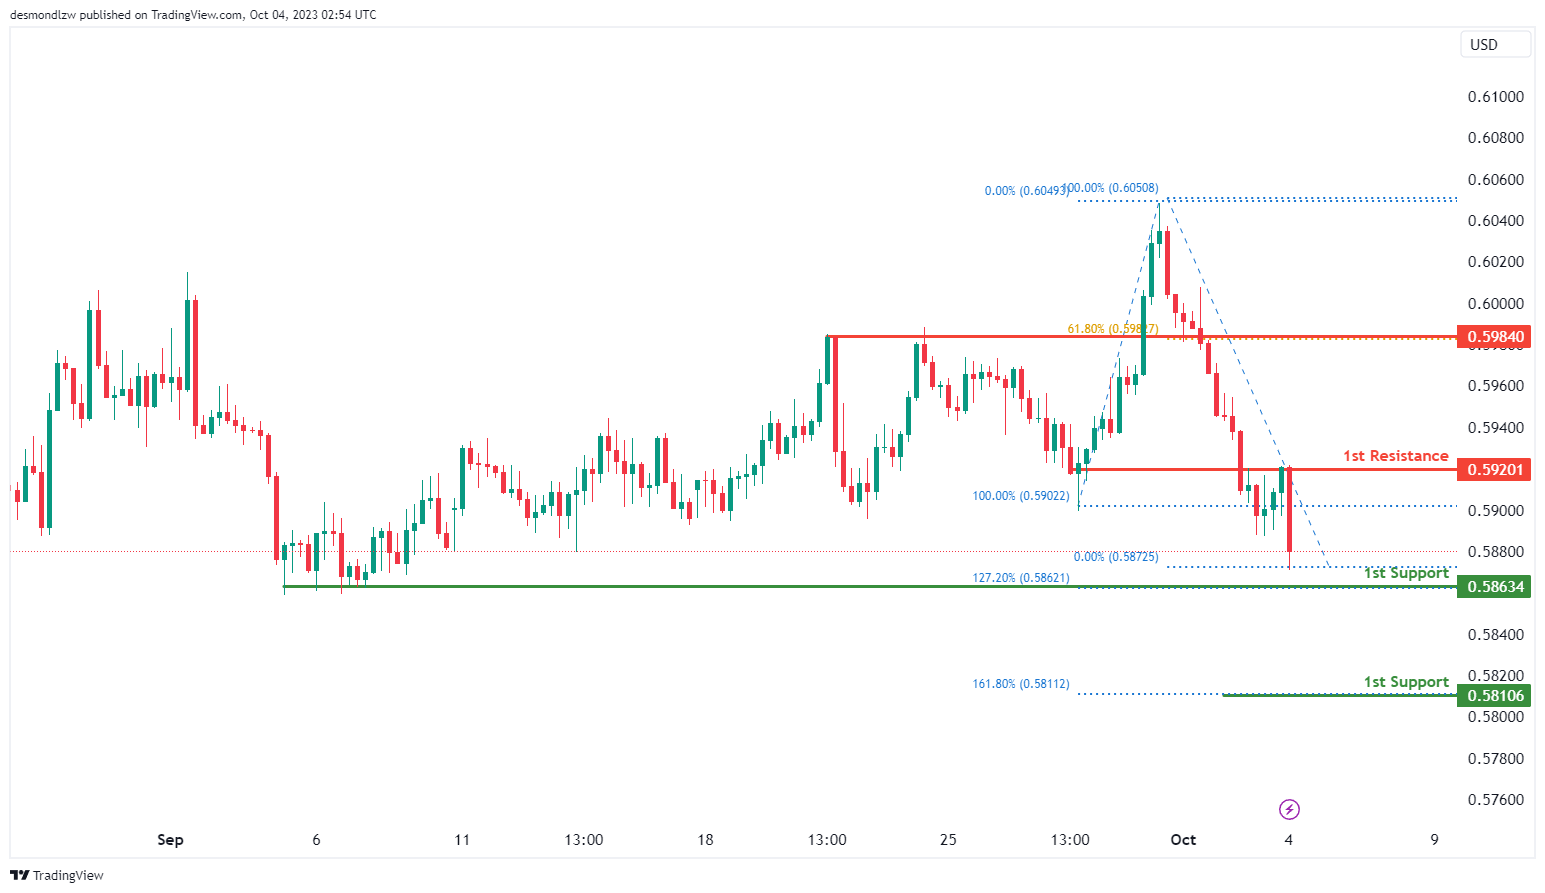
NZD/USD
The NZD/USD chart currently exhibits a bearish momentum, with a potential scenario of a bearish continuation towards the 1st support level at 0.5863. This support level is significant as it aligns with a multi-swing low support and the 127.20% Fibonacci Extension, suggesting it could act as a strong support zone.
Furthermore, the 2nd support at 0.5810 is also noteworthy, as it is identified as a multi-swing low support and coincides with the 161.80% Fibonacci Extension, reinforcing its importance as a potential price support level.
On the resistance side, the 1st resistance level at 0.9520 is categorized as an overlap resistance, which could potentially hinder bullish movements. Additionally, the 2nd resistance at 0.5984 is marked as a pullback resistance and aligns with the 61.80% Fibonacci Retracement, further emphasizing its significance in potential price reversals.
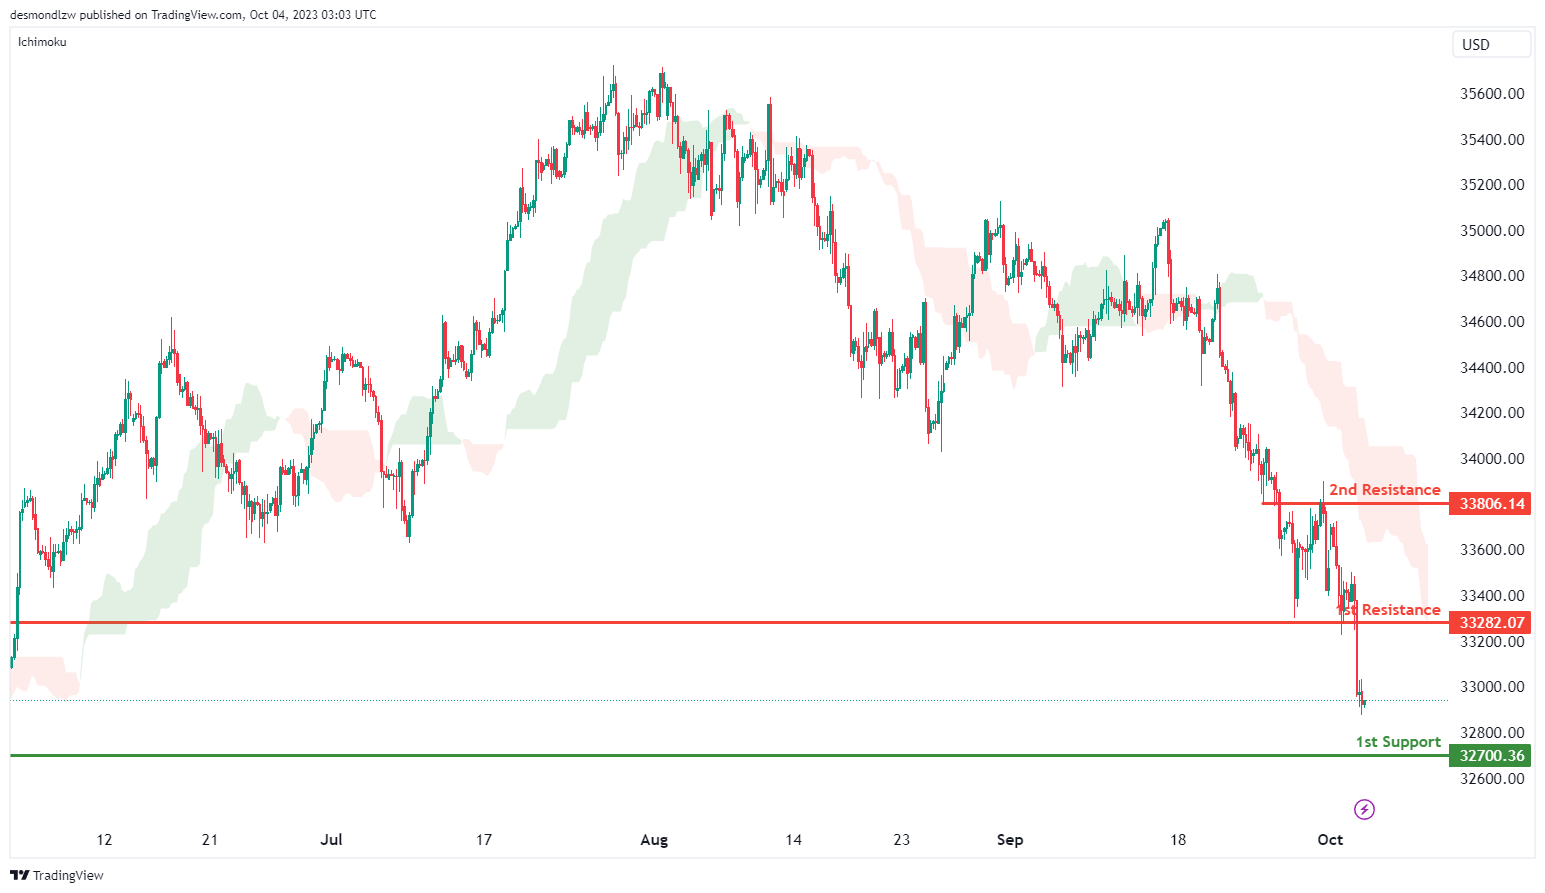
DJ30:
The DJ30 (Dow Jones 30) chart currently exhibits a bearish momentum, driven by its position below the bearish Ichimoku cloud. There is a potential scenario of a bearish continuation towards the 1st support level at 32700.36, which is identified as a swing low support, making it a significant level for potential price support.
On the resistance side, the 1st resistance at 33282.07 is considered a pullback resistance, indicating its potential to limit upward movements. Beyond this, the 2nd resistance at 33806.14 is categorized as an overlap resistance, suggesting it may act as a barrier to further bullish movements.
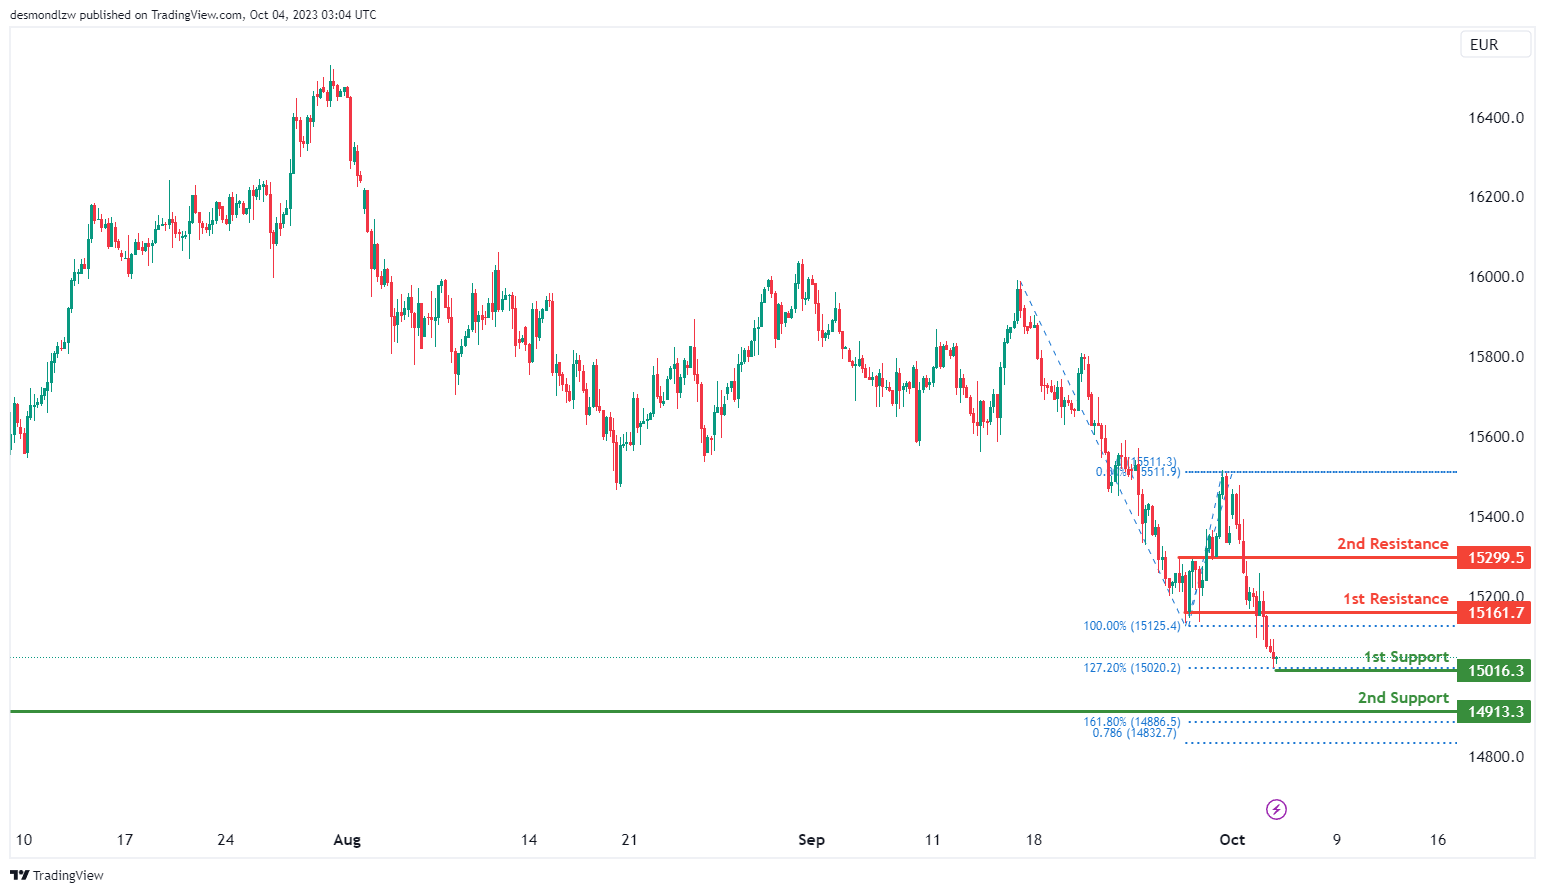
GER40:
The GER40 (Germany 40) chart currently maintains a bullish momentum. There is a potential scenario where the price could experience a bullish bounce off the 1st support level at 15016.30, which is noted for its 127.20% Fibonacci Extension, highlighting its significance as a potential reversal point. Additionally, the 2nd support at 14913.30 is identified as a swing low support and aligns with the 161.80% Fibonacci Extension and the 78.60% Fibonacci Projection, further emphasizing its importance as a potential support level.
On the resistance side, the 1st resistance level at 15161.70 is characterized as a pullback resistance, indicating its potential role as a barrier to further upward movements. Beyond this, the 2nd resistance at 15299.50 is also identified as a pullback resistance, potentially adding further resistance to the price’s upward movement.
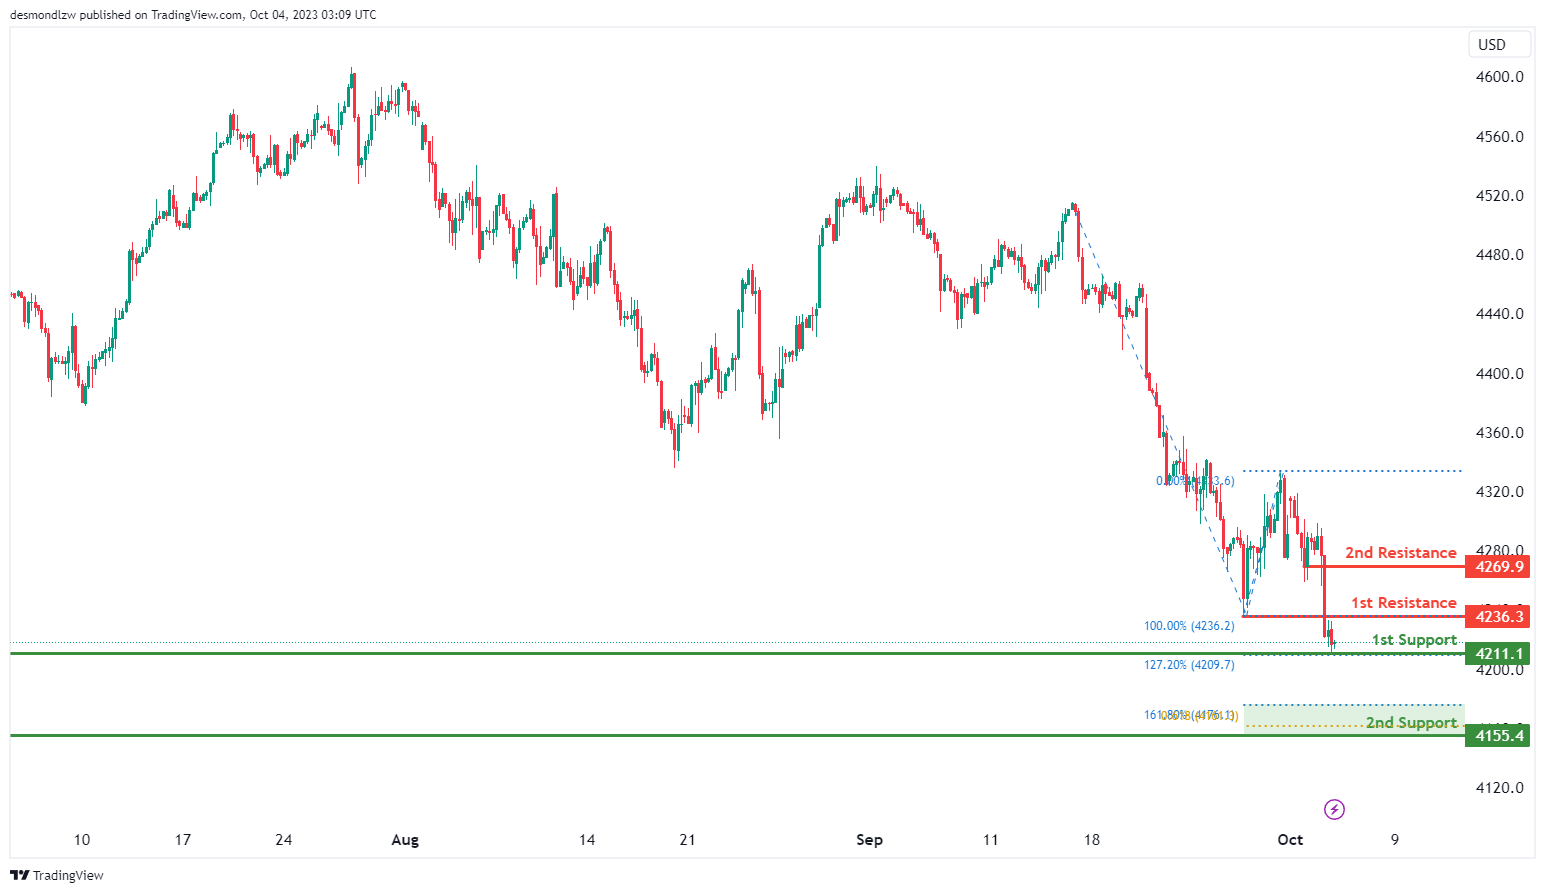
US500
The US500 (S&P 500) chart currently exhibits a bearish momentum, and there is a potential scenario where the price may fluctuate between the 1st resistance and 1st support levels.
The 1st support level at 4211.1 is considered significant due to its designation as a swing low support and the presence of the 127.20% Fibonacci Extension, suggesting it could act as a crucial level for potential price support. Additionally, the 2nd support at 4155.4 is identified as a swing low support and aligns with the 161.80% Fibonacci Extension as well as the 61.80% Fibonacci Projection, further reinforcing its importance as a potential support zone.
On the resistance side, the 1st resistance level at 4236.3 is recognized as an overlap resistance, indicating it may act as a barrier to further upward movements. Beyond this, the 2nd resistance at 4269.9 is categorized as a pullback resistance, potentially providing additional resistance to the price’s upward movement.
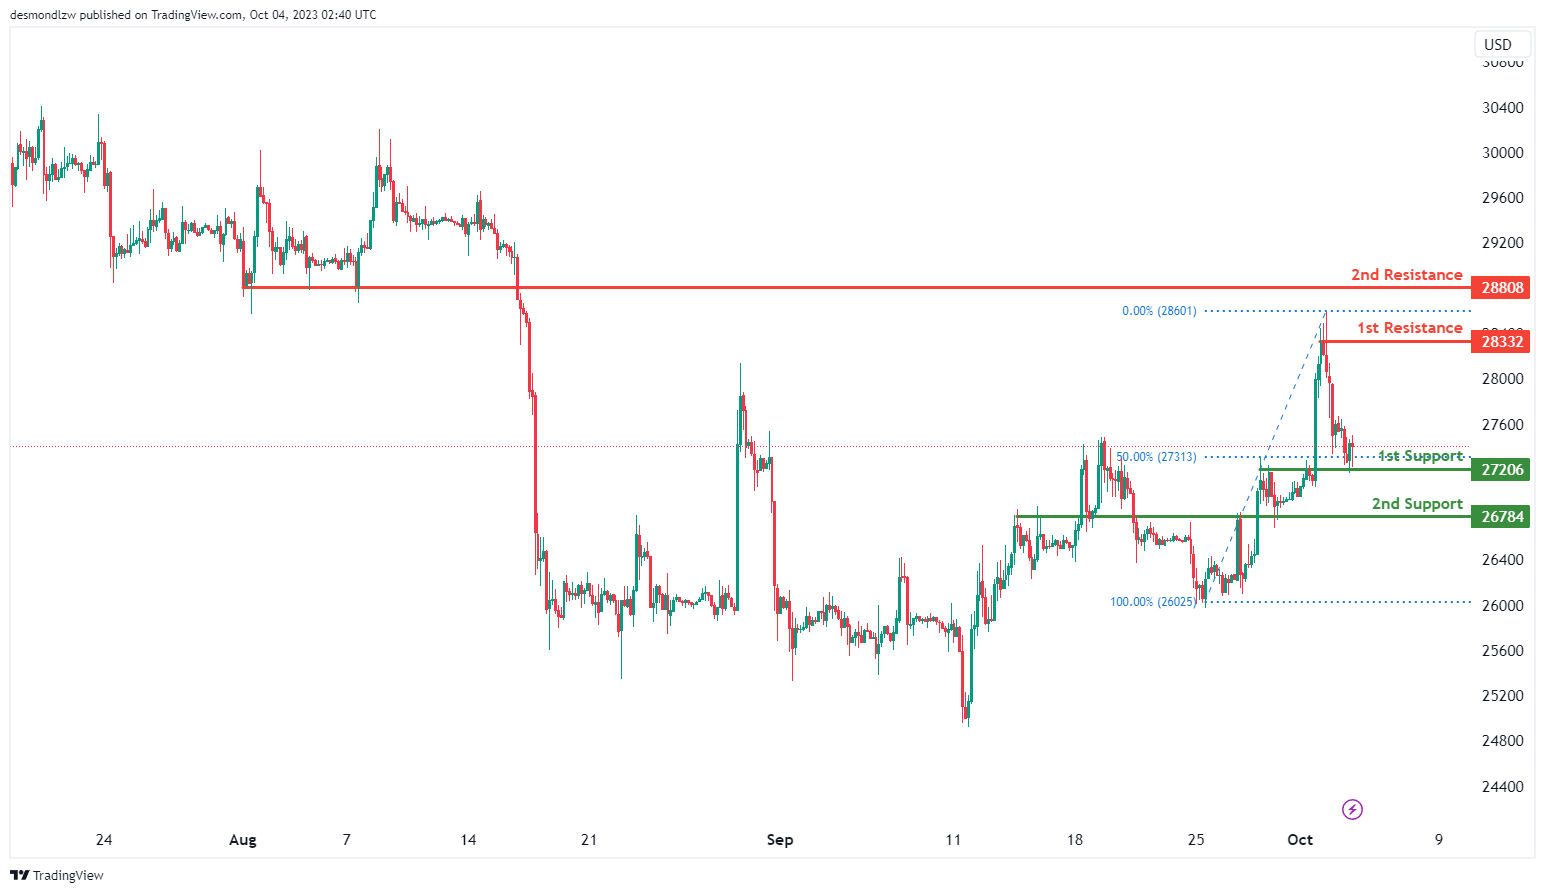
BTC/USD:
The BTC/USD chart currently maintains a bullish momentum, with a potential scenario of a bullish bounce off the 1st support level at 27206, which is supported by its designation as an overlap support and the presence of the 50% Fibonacci Retracement.
Additionally, the 2nd support at 26784 is also categorized as an overlap support, reinforcing its importance as a potential zone where the price may find support.
On the resistance side, the 1st resistance level at 28332 is marked as a swing high resistance, potentially limiting further upward movements. Beyond this, the 2nd resistance at 28808 is identified as a pullback resistance, indicating it may provide additional resistance to the price’s upward movement.
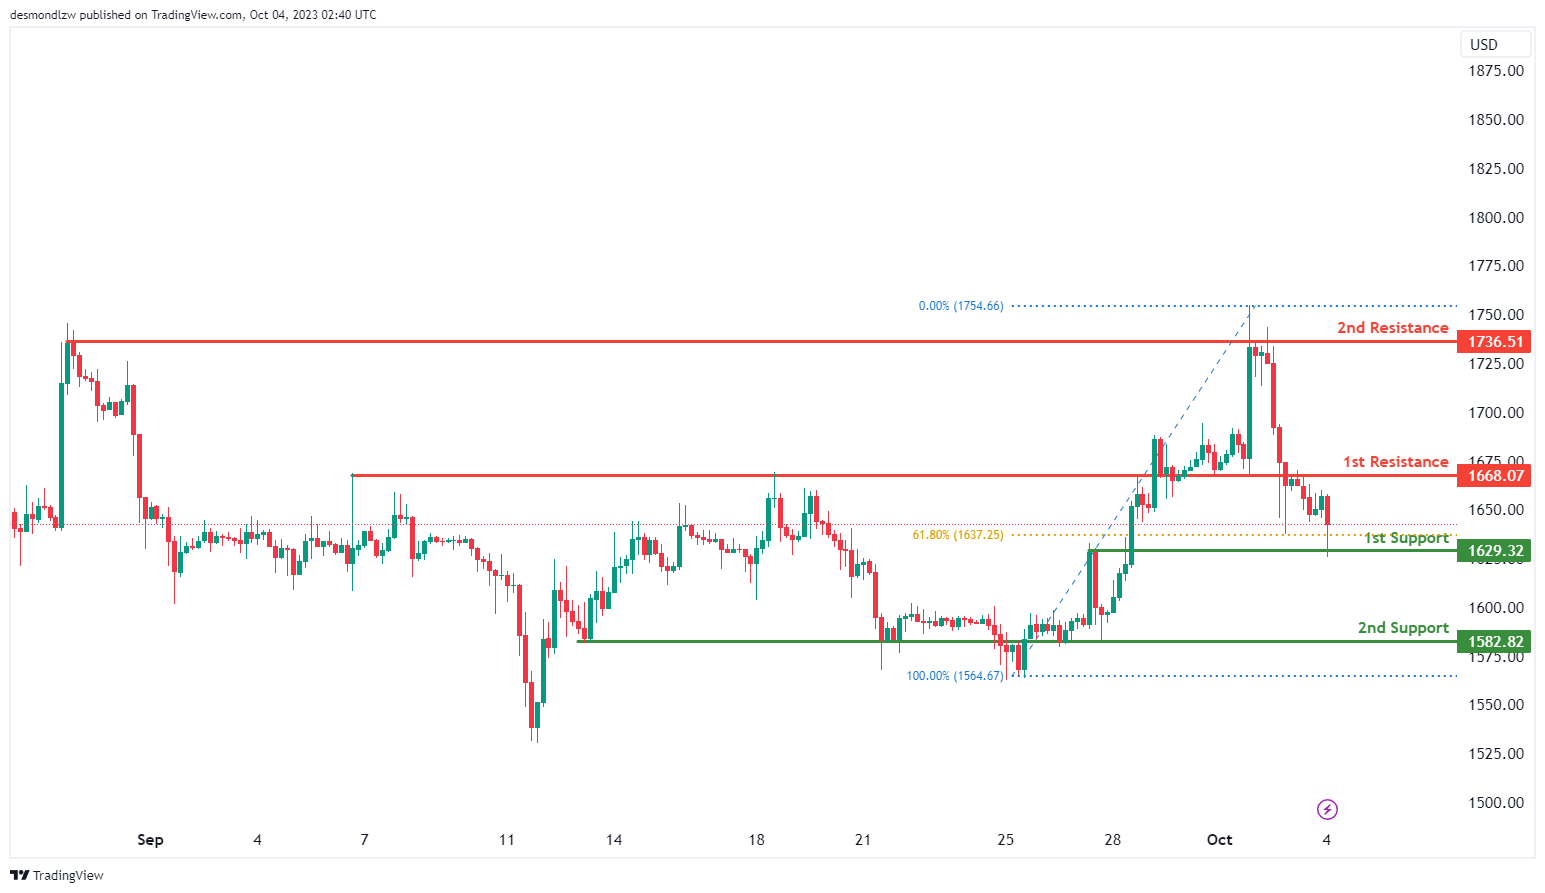
ETH/USD:
The ETH/USD chart currently maintains a neutral momentum, with a potential scenario of price fluctuation between the 1st support level at 1629.32 and the 1st resistance level at 1668.07.
The 1st support is considered significant as it’s identified as an overlap support, making it a crucial level for potential price support. Additionally, the 2nd support at 1582.82 is also categorized as an overlap support, reinforcing its importance as a potential zone where the price may find support.
On the resistance side, the 1st resistance level at 1668.07 is recognized as an overlap resistance, suggesting it may act as a barrier to price increases. Beyond this, the 2nd resistance at 1736.51 is identified as a multi-swing high resistance, emphasizing its significance in potential price reversals.
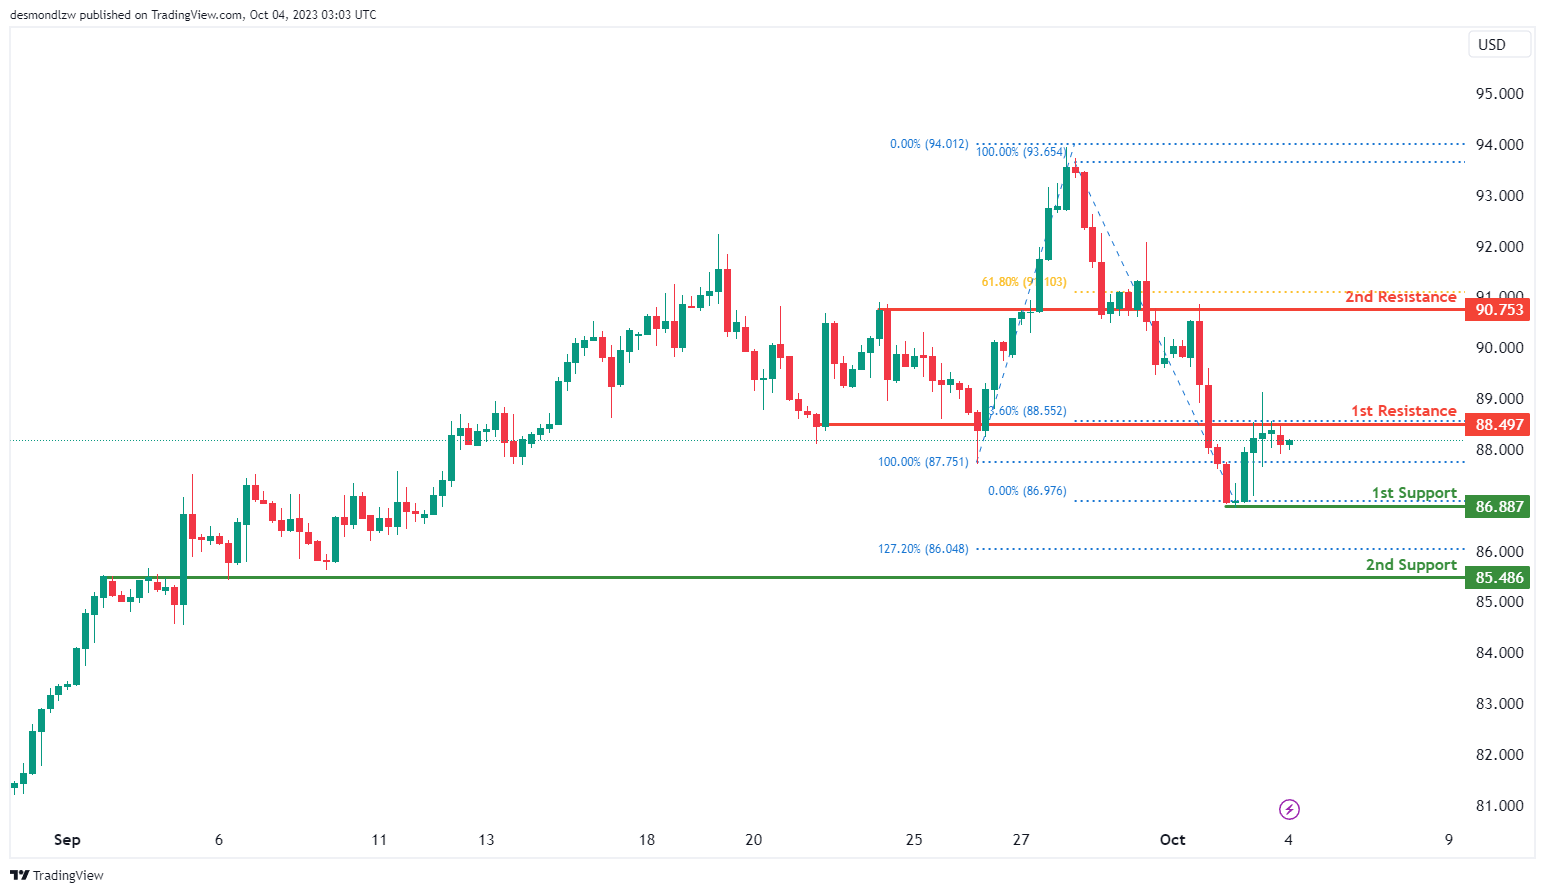
WTI/USD:
The WTI chart currently shows a bearish momentum, and there is a potential scenario of a bearish reaction off the 1st resistance level at 88.49, which is identified as an overlap resistance and is reinforced by the presence of the 23.60% Fibonacci Retracement.
On the support side, the 1st support at 86.88 is considered a swing low support, and the 2nd support at 85.48 is categorized as an overlap support, highlighting their significance as potential zones for price support.
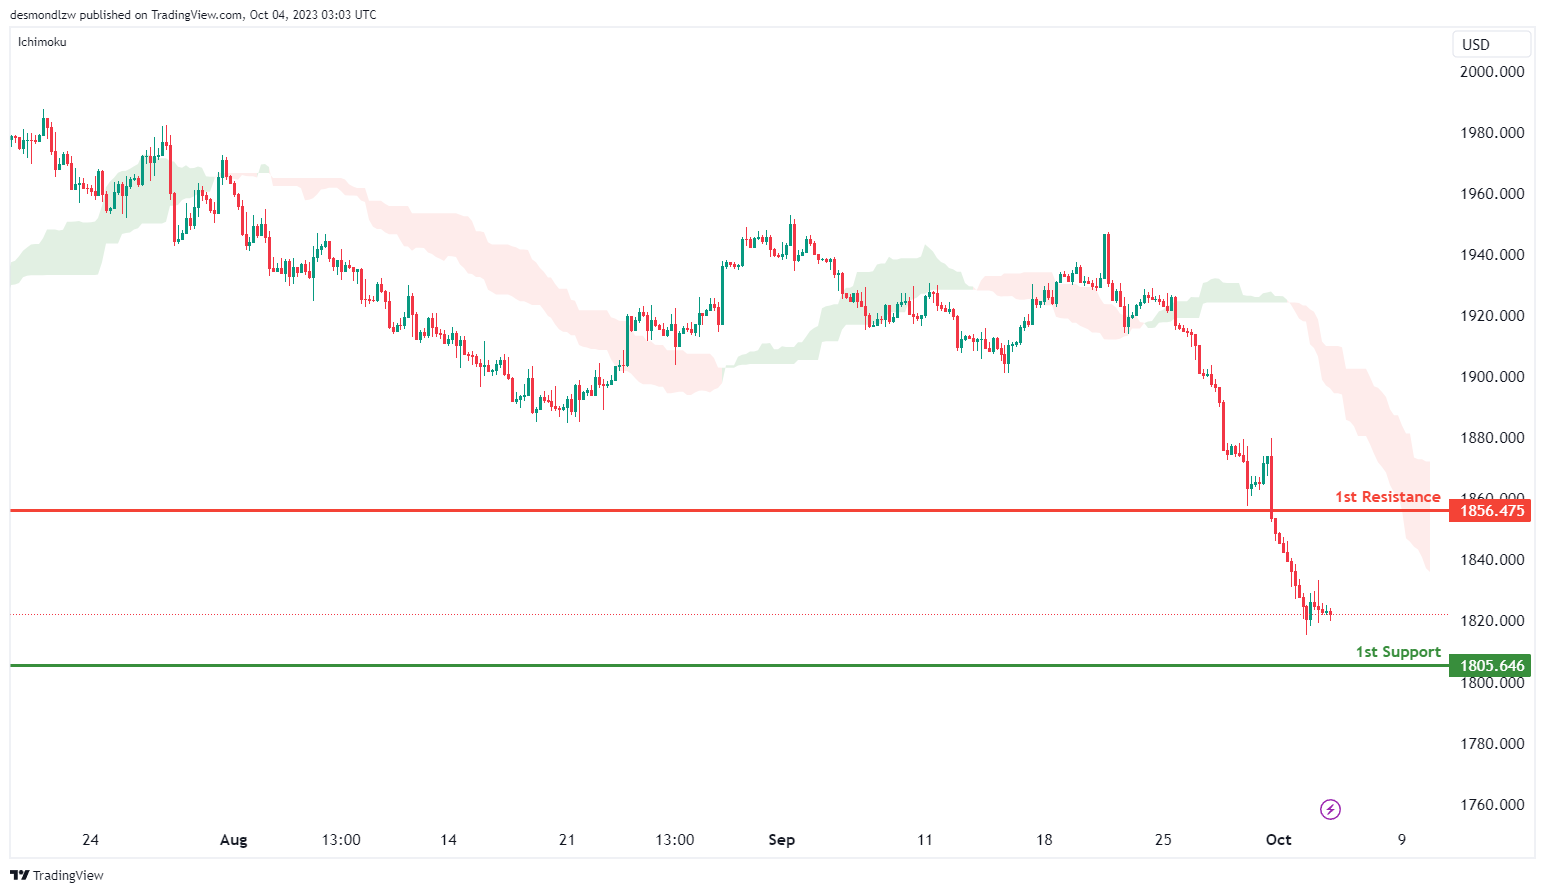
XAU/USD (GOLD):
The XAUUSD chart currently has a bearish momentum, and there is a potential scenario of a bearish continuation towards the 1st support level at 1805.64, which is identified as an overlap support, indicating its significance as a potential zone for price support.
On the resistance side, the 1st resistance level at 1856.47 is marked as a pullback resistance, potentially limiting upward movements.


