
DXY:
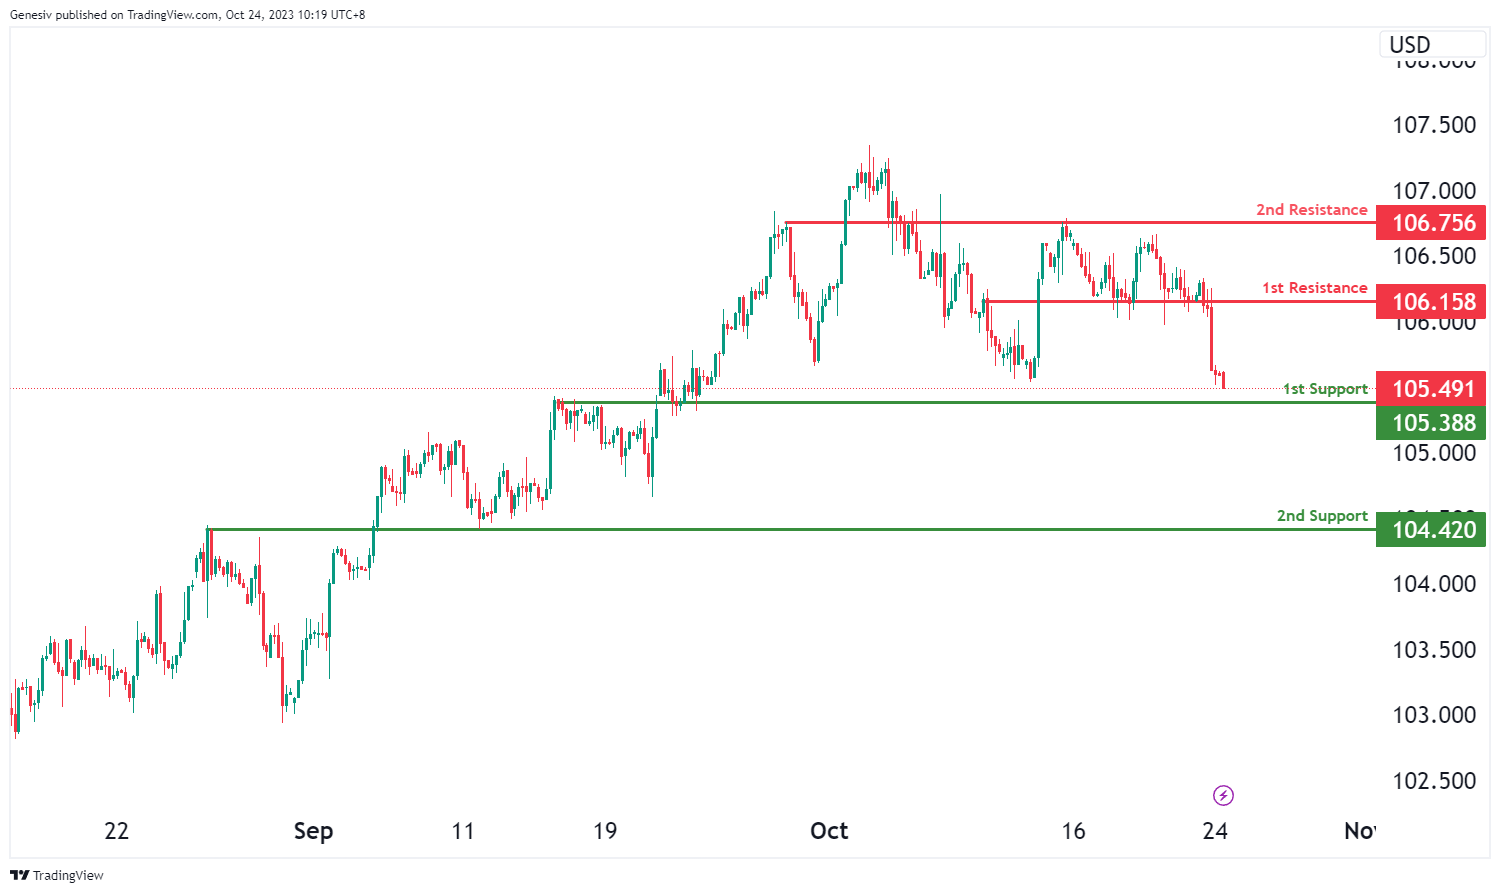
The DXY chart currently exhibits a bearish overall momentum, and there is a potential scenario for a bearish continuation towards the 1st support level.
The 1st support at 105.38 is considered significant as it aligns with an overlap support level. Additionally, the 2nd support at 104.42 is identified as an overlap support, providing a strong foundation of potential support.
On the resistance side, the 1st resistance at 106.15 is characterized as pullback resistance. Beyond this, the 2nd resistance at 106.75 is identified as an overlap resistance.
EUR/USD:
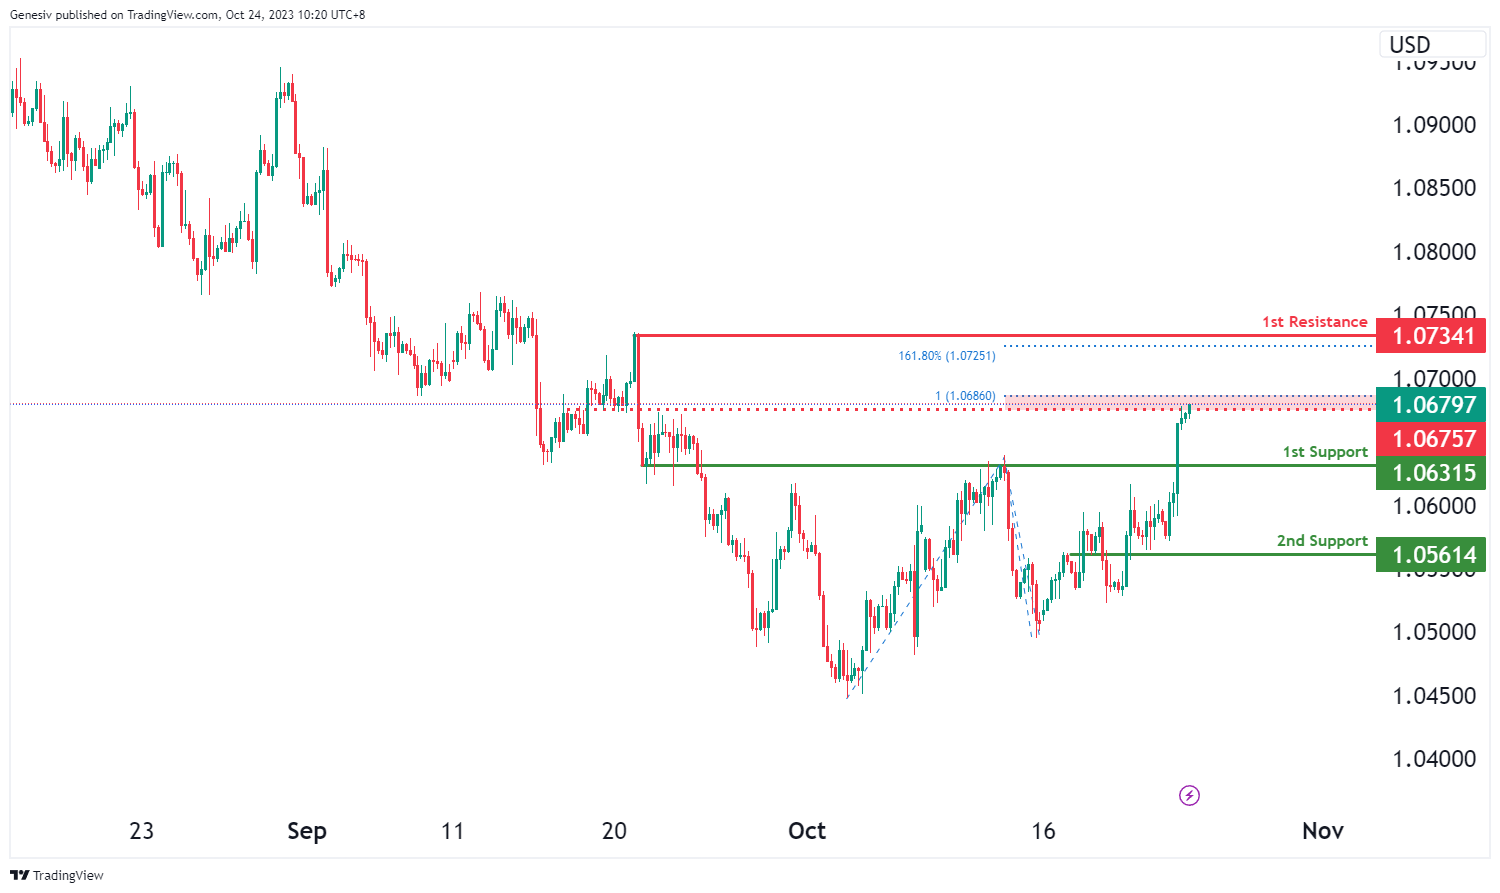
The EUR/USD chart currently has a bullish overall momentum, and there is a potential scenario for a bullish continuation towards the 1st resistance level.
The 1st support at 1.0631 is considered a strong level as it aligns with a pullback support. Additionally, the 2nd support at 1.0561 is identified as an overlap support, providing further potential support.
On the resistance side, the 1st resistance at 1.0734 is characterized as a swing high resistance, and beyond this, the intermediate resistance at 1.0675 is identified as an overlap resistance and coincides with the 100% Fibonacci Projection.
EUR/JPY:
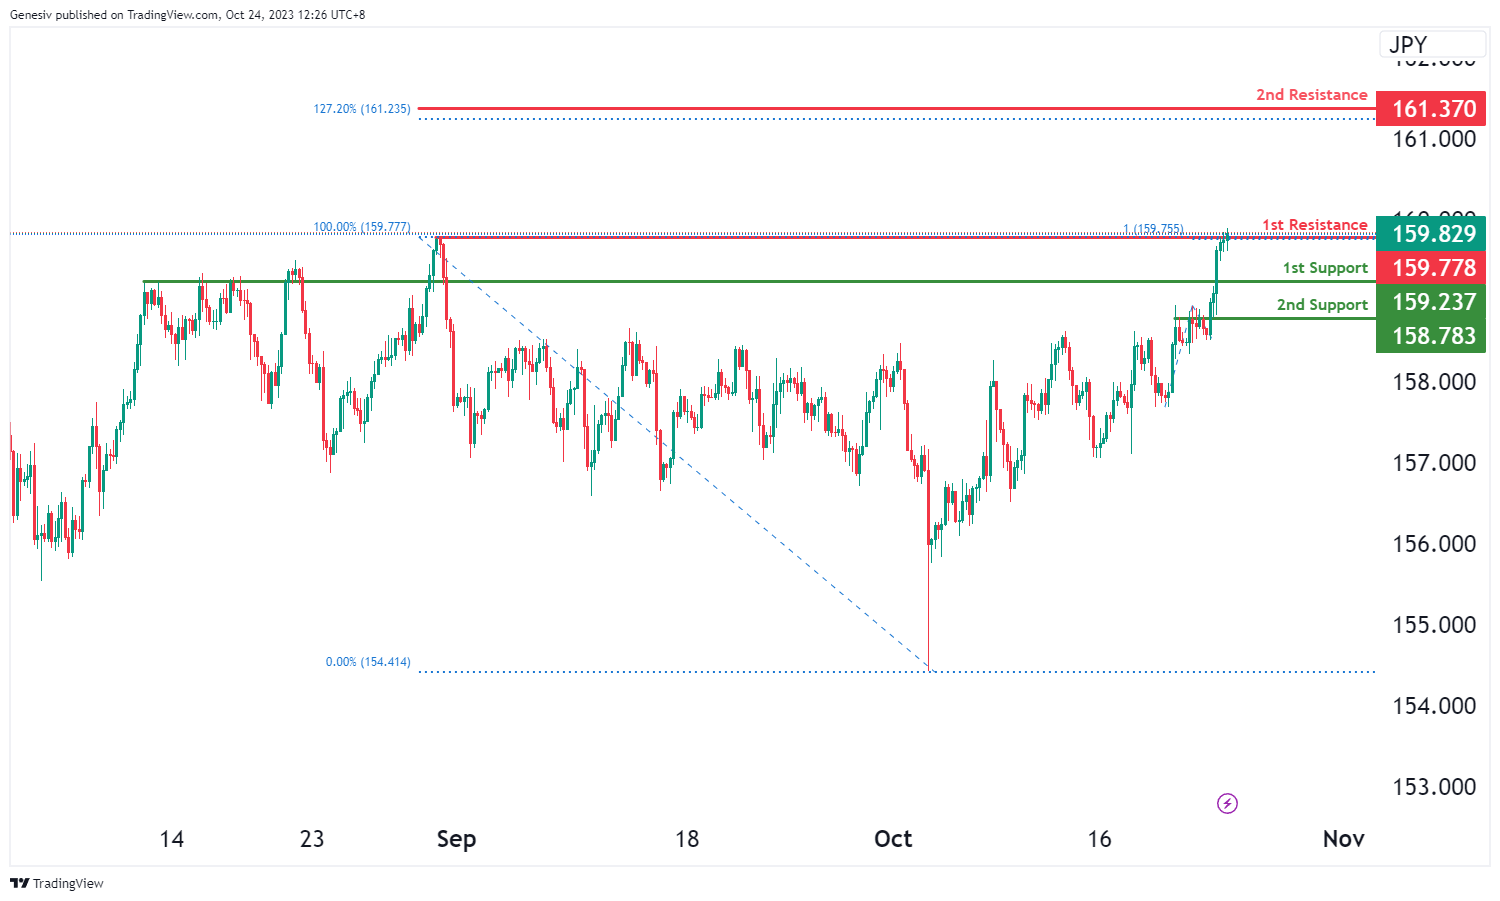
The instrument under analysis is EUR/JPY, and the overall momentum of the chart indicates a bullish trend.
There is a possibility that the price may experience a bullish breakout through the first resistance level and rise to the second resistance level.
The first support level is at 159.23, and it’s considered strong because it represents a pullback support.
The second support level is at 158.78, and it’s also significant as it marks an overlap of support.
On the resistance side, the first resistance level is at 159.77, and it’s noteworthy because it represents a swing high resistance and aligns with a 100% Fibonacci Projection.
The second resistance level is at 161.37, and it’s significant as well, as it marks a significant level indicated by a 127.20% Fibonacci Extension.
EUR/GBP:
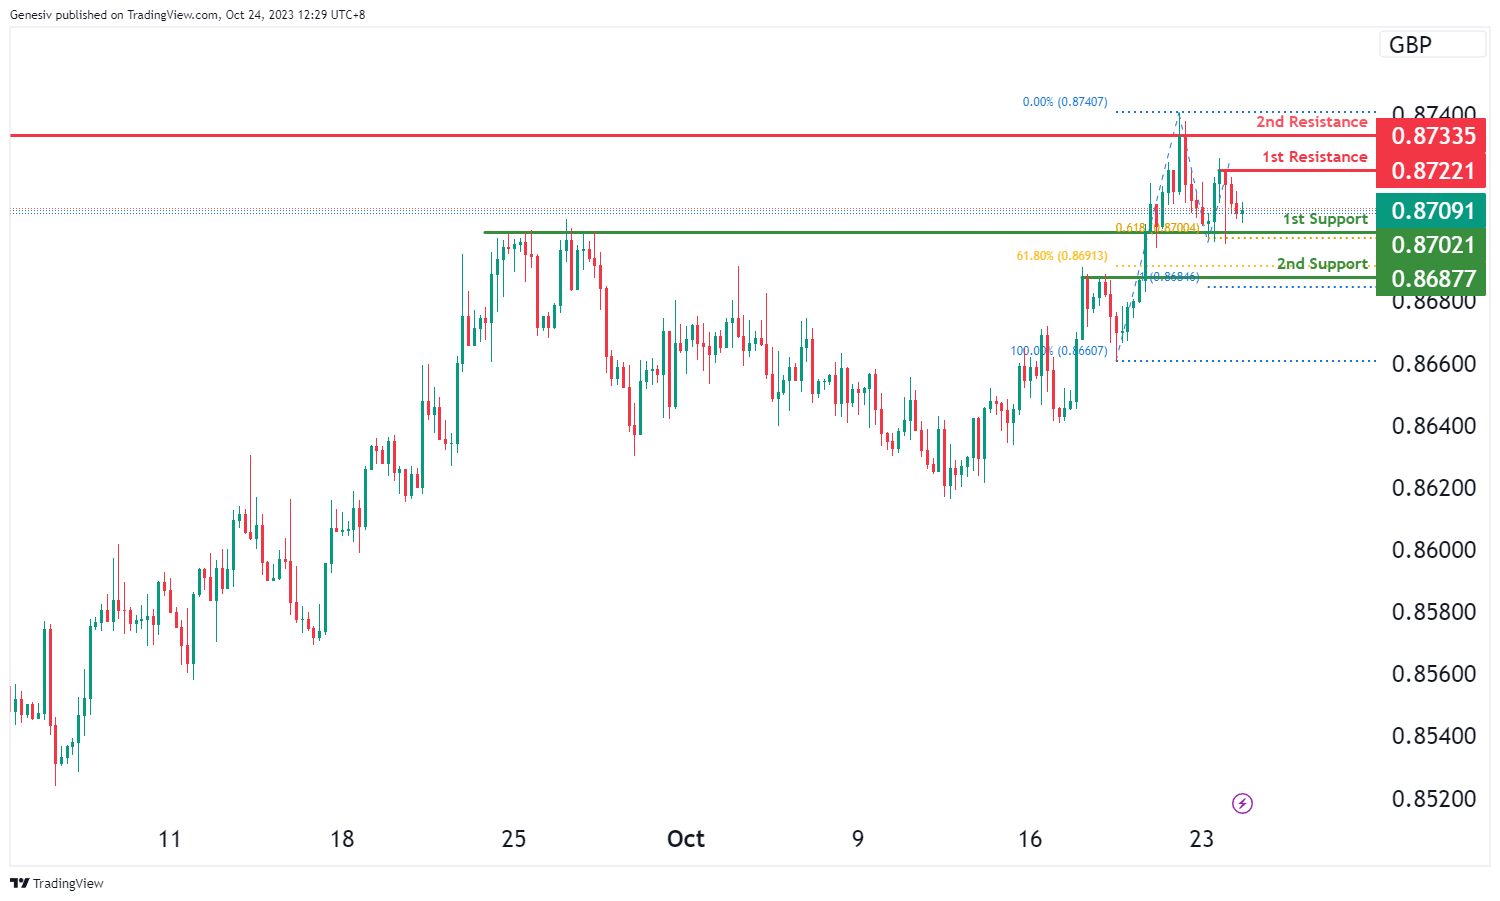
The instrument we are examining is EUR/GBP, and the overall momentum of the chart indicates a bullish trend.
There is a possibility that the price may experience a bullish bounce off the first support level and head towards the first resistance level.
The first support level is at 0.8702, and it’s considered strong because it represents an overlap of support and is in confluence with a 61.80% Fibonacci Projection.
The second support level is at 0.8687, and it’s also significant as it represents a pullback support and aligns with both a 61.80% Fibonacci Retracement and a 100% Fibonacci Projection, indicating Fibonacci confluence.
On the resistance side, the first resistance level is at 0.8722, and it’s noteworthy because it represents a swing high resistance.
The second resistance level is at 0.8733, and it’s significant as well, as it marks an overlap of resistance.
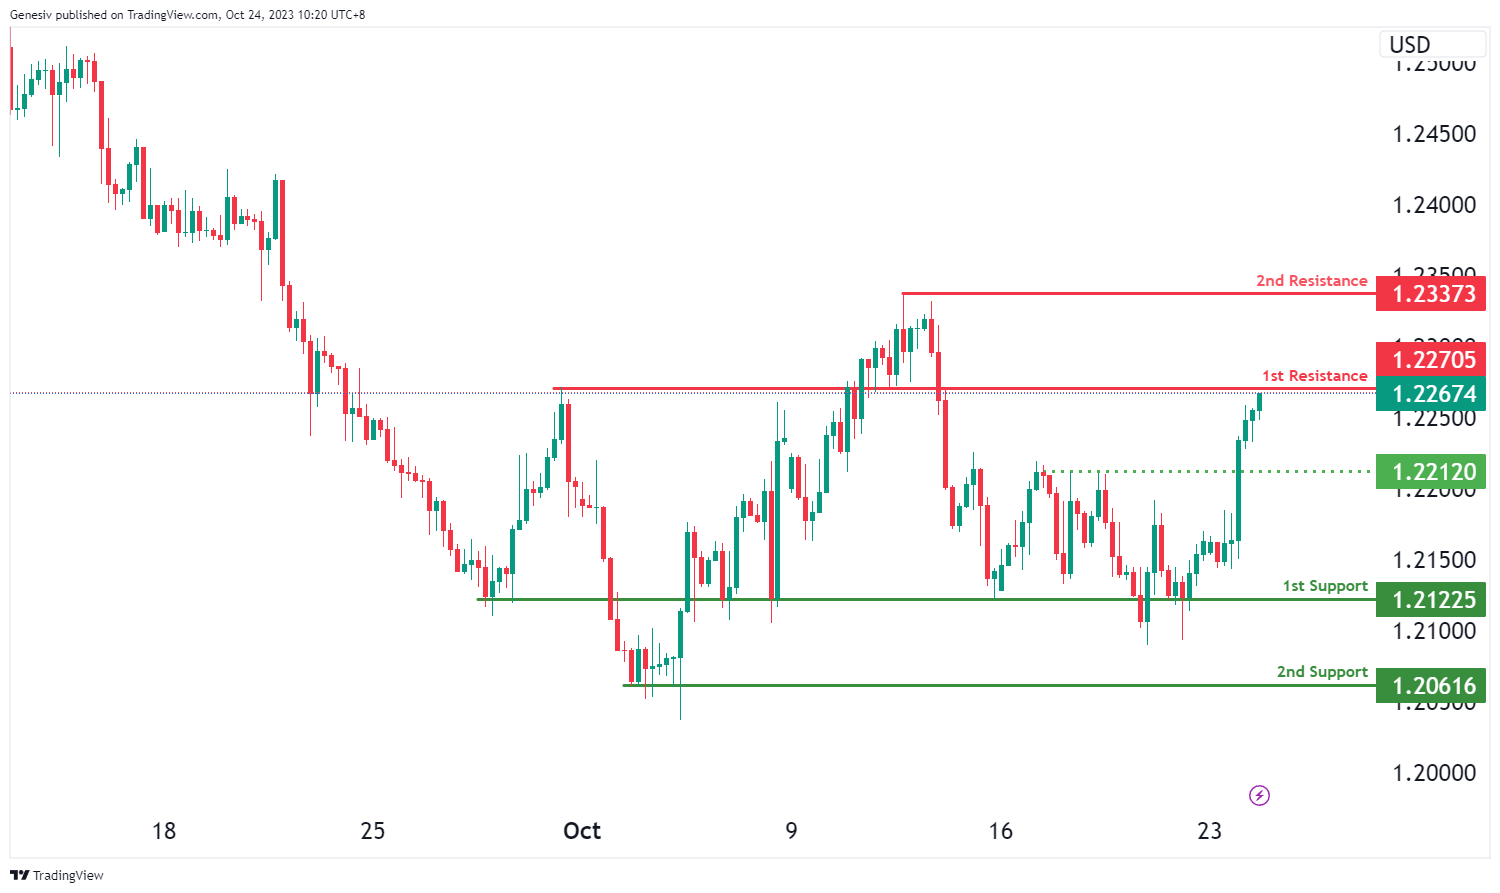
GBP/USD:
The GBP/USD chart currently exhibits bearish overall momentum, and there is a potential scenario for a bearish reaction off the 1st resistance level with a drop towards the 1st support.
The 1st support at 1.2122 is considered significant as it aligns with an overlap support, and the 2nd support at 1.2061 is identified as a multi-swing low support, providing additional potential support.
On the resistance side, the 1st resistance at 1.2270 is characterized as a pullback resistance, and beyond this, the 2nd resistance at 1.2337 is identified as a swing high resistance. There is also an intermediate support level at 1.2212, which can act as pullback support.
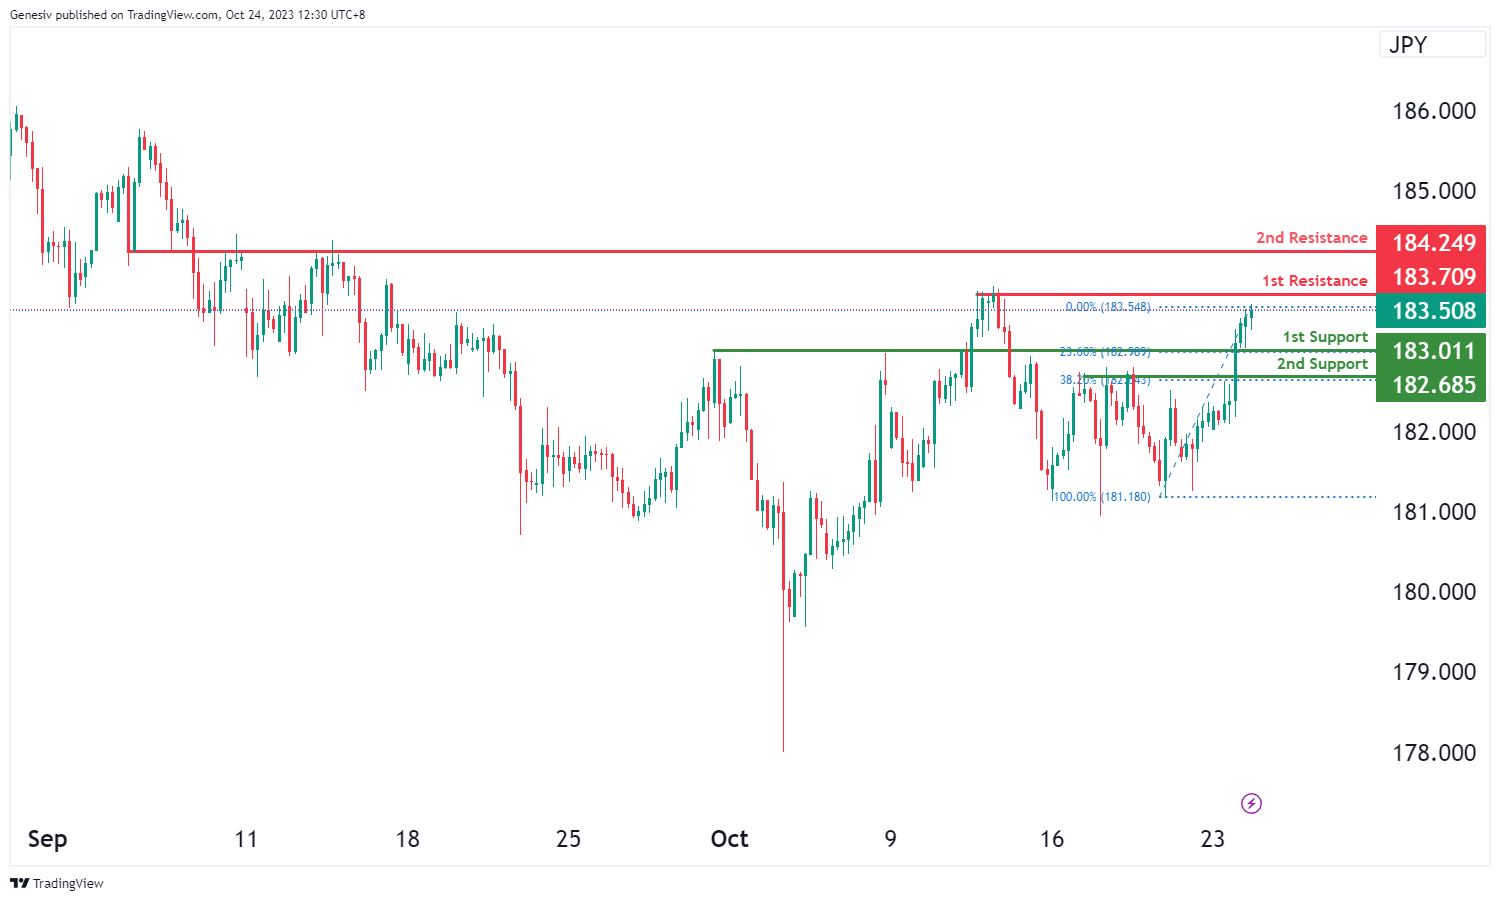
GBP/JPY:
In the analysis of GBP/JPY, the overall momentum of the chart indicates a bullish trend.
It is anticipated that the price may continue to move in a bullish direction, potentially heading towards the first resistance level.
The first support level is at 183.01, and it’s considered significant due to being an overlap support and aligning with a 23.60% Fibonacci Retracement.
The second support level is at 182.68, and it is also of importance as it represents a pullback support and coincides with a 38.20% Fibonacci Retracement.
On the resistance side, the first resistance level is at 183.70, which is notable because it marks a swing high resistance.
The second resistance level is at 184.24, and it is significant as well as it represents an overlap resistance.
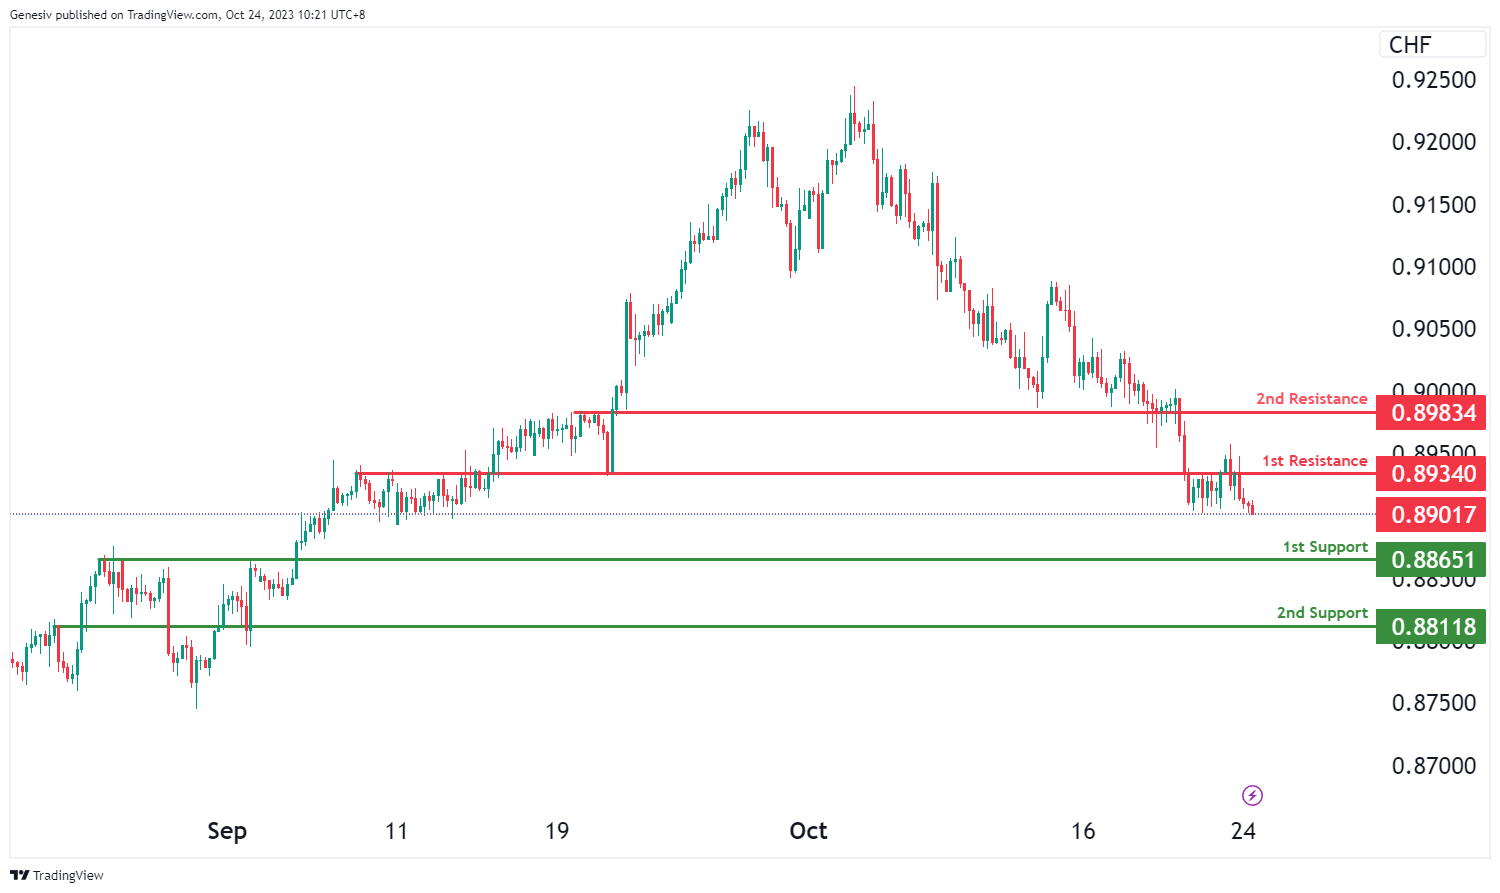
USD/CHF:
The USD/CHF chart currently exhibits bearish overall momentum, and there is a potential scenario for a bearish continuation towards the 1st support level.
The 1st support at 0.8865 is considered significant as it aligns with a pullback support level, and the 2nd support at 0.8811 is identified as another pullback support, further reinforcing the potential for a bearish move.
On the resistance side, the 1st resistance at 0.8934 is characterized as an overlap resistance, and beyond this, the 2nd resistance at 0.8983 is identified as a pullback resistance.
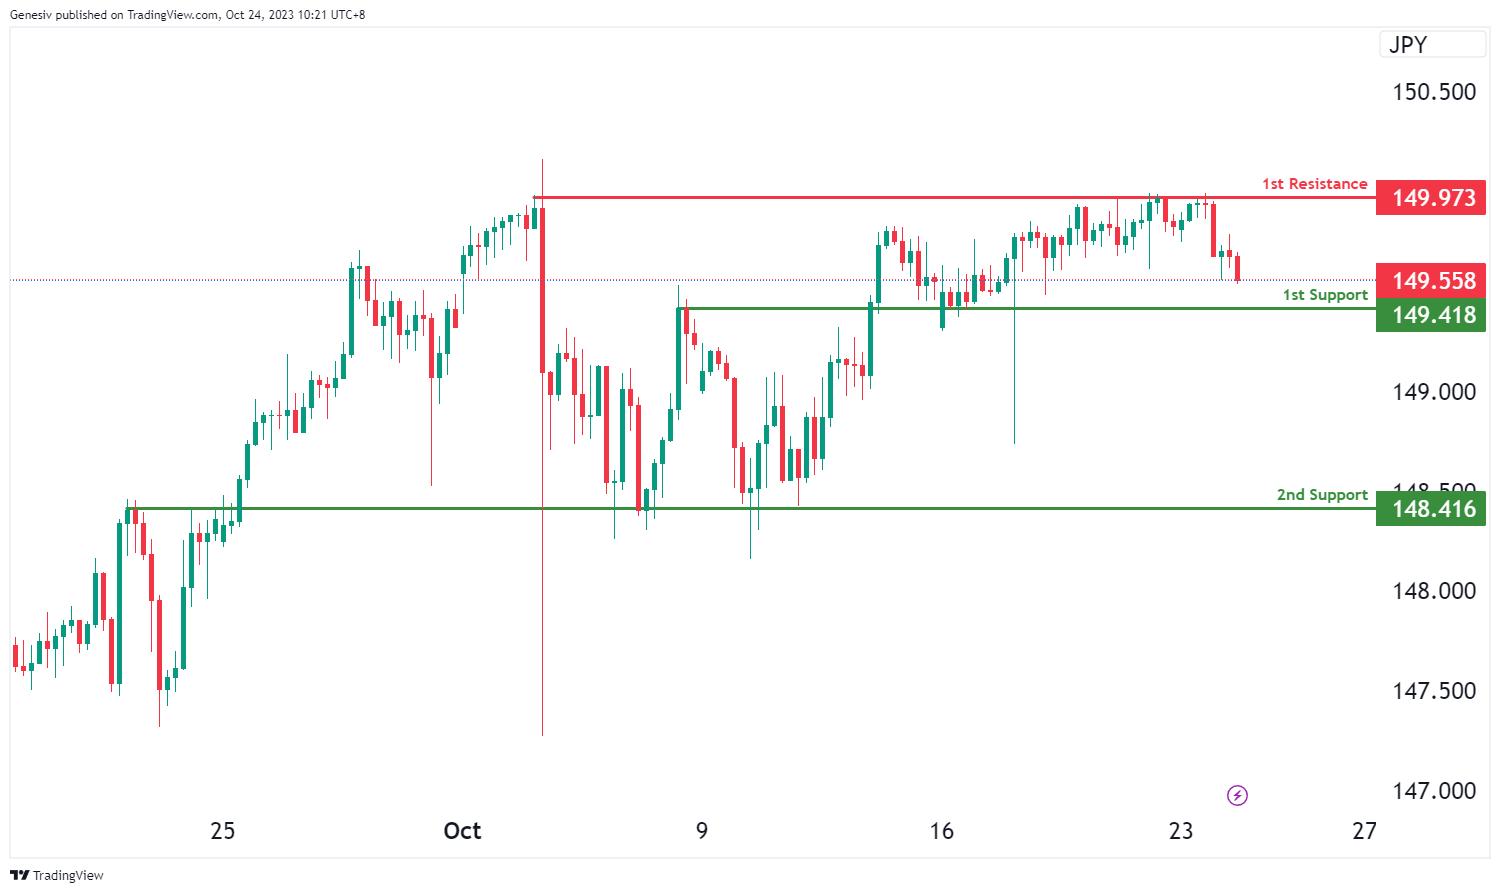
USD/JPY:
The USD/JPY chart currently exhibits bearish overall momentum, and there is a potential scenario for a bearish continuation towards the 1st support level.
The 1st support at 149.41 is considered significant as it aligns with an overlap support level, indicating a potential area of price support. Additionally, the 2nd support at 148.41 is also identified as an overlap support, further reinforcing the potential for a bearish move.
On the resistance side, the 1st resistance at 149.97 is characterized as a multi-swing high resistance level, suggesting potential price barriers for an upward movement.
USD/CAD:
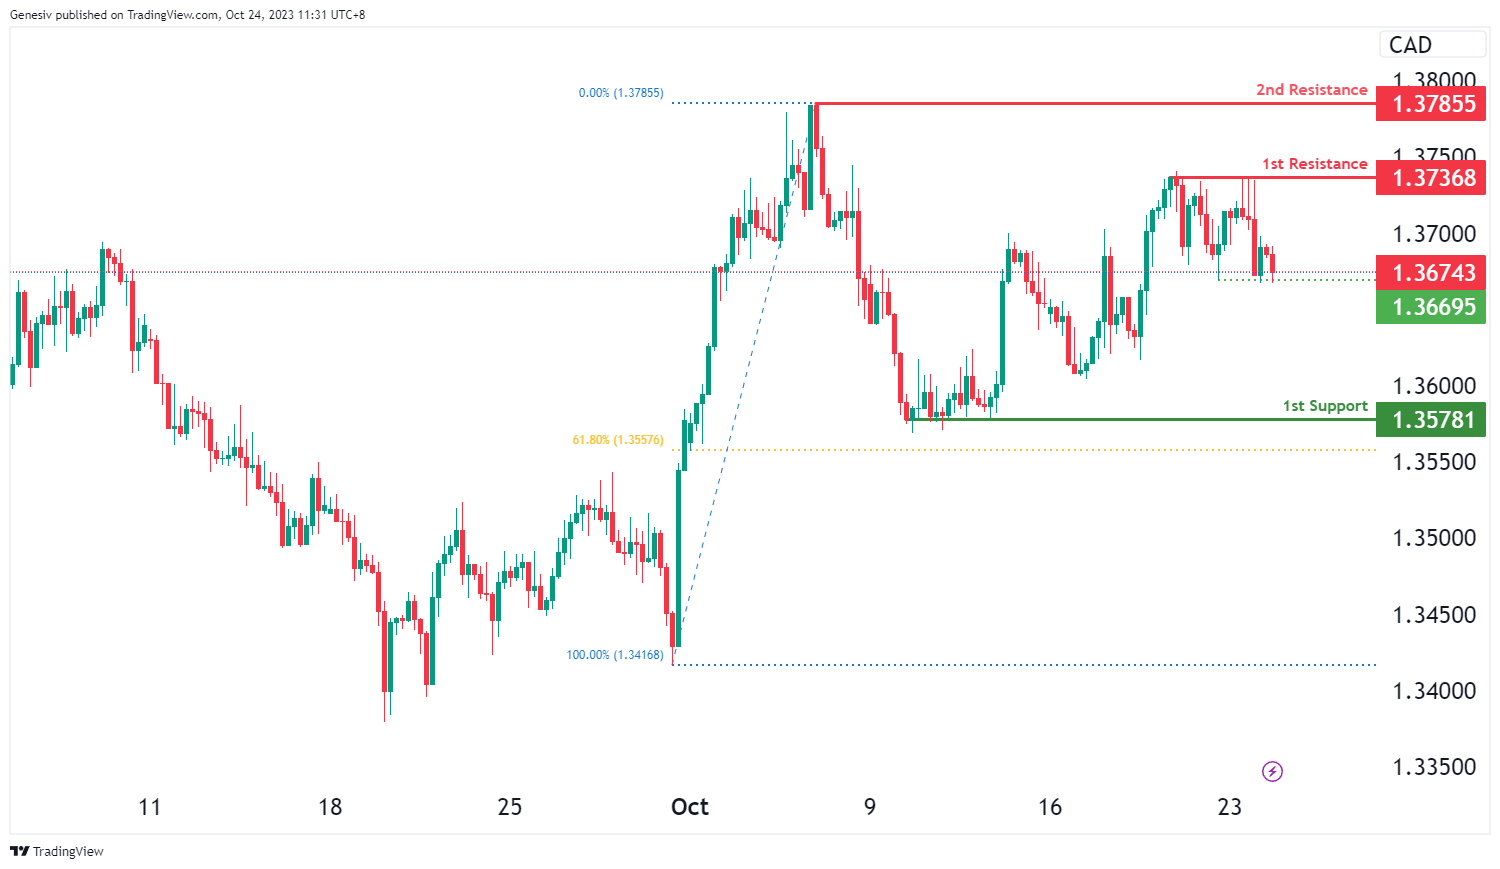
The USD/CAD chart currently exhibits an overall bearish momentum. Should price break below the intermediate support, there is a potential scenario for price to make a bearish continuation towards the 1st support level.
The intermediate support level at 1.3669 is identified as a pullback support. Further below, the 1st support level at 1.3578 is marked as a major pullback support that aligns close to the 61.80% Fibonacci retracement level, adding to its significance as a potential support zone.
To the upside, the 1st resistance level at 1.3737 is identified as a pullback resistance. Higher up, the 2nd resistance level at 1.3786 is marked as a swing-high resistance, potentially acting as a barrier to further bullish advances.
AUD/USD:
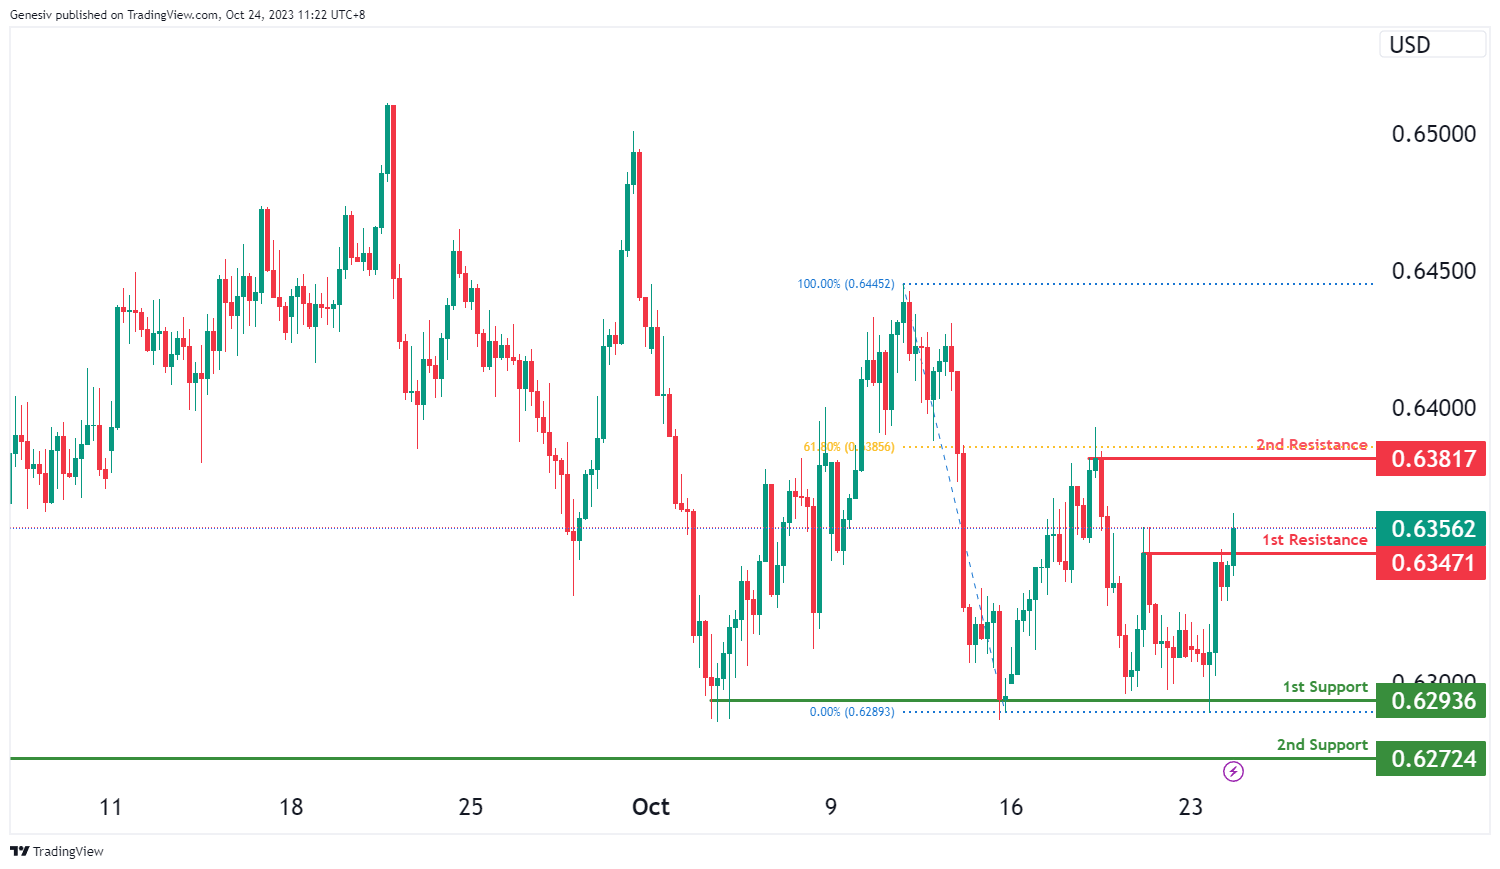
The AUD/USD chart currently exhibits an overall bullish momentum. Price could make a further bullish continuation towards the 2nd resistance level should it break above the 1st resistance level.
The 1st resistance level at 0.6347 is identified as a pullback resistance. Higher up, the 2nd resistance level at 0.6382 is marked as a swing-high resistance that aligns with the 61.80% Fibonacci retracement level, making it a potentially strong resistance level.
To the downside the 1st support level at 0.6294 is identified as a multi-swing-low support. Additionally, the 2nd support level at 0.6272 is also noted as a multi-swing-low support, further reinforcing its importance as a potential support area.
NZD/USD
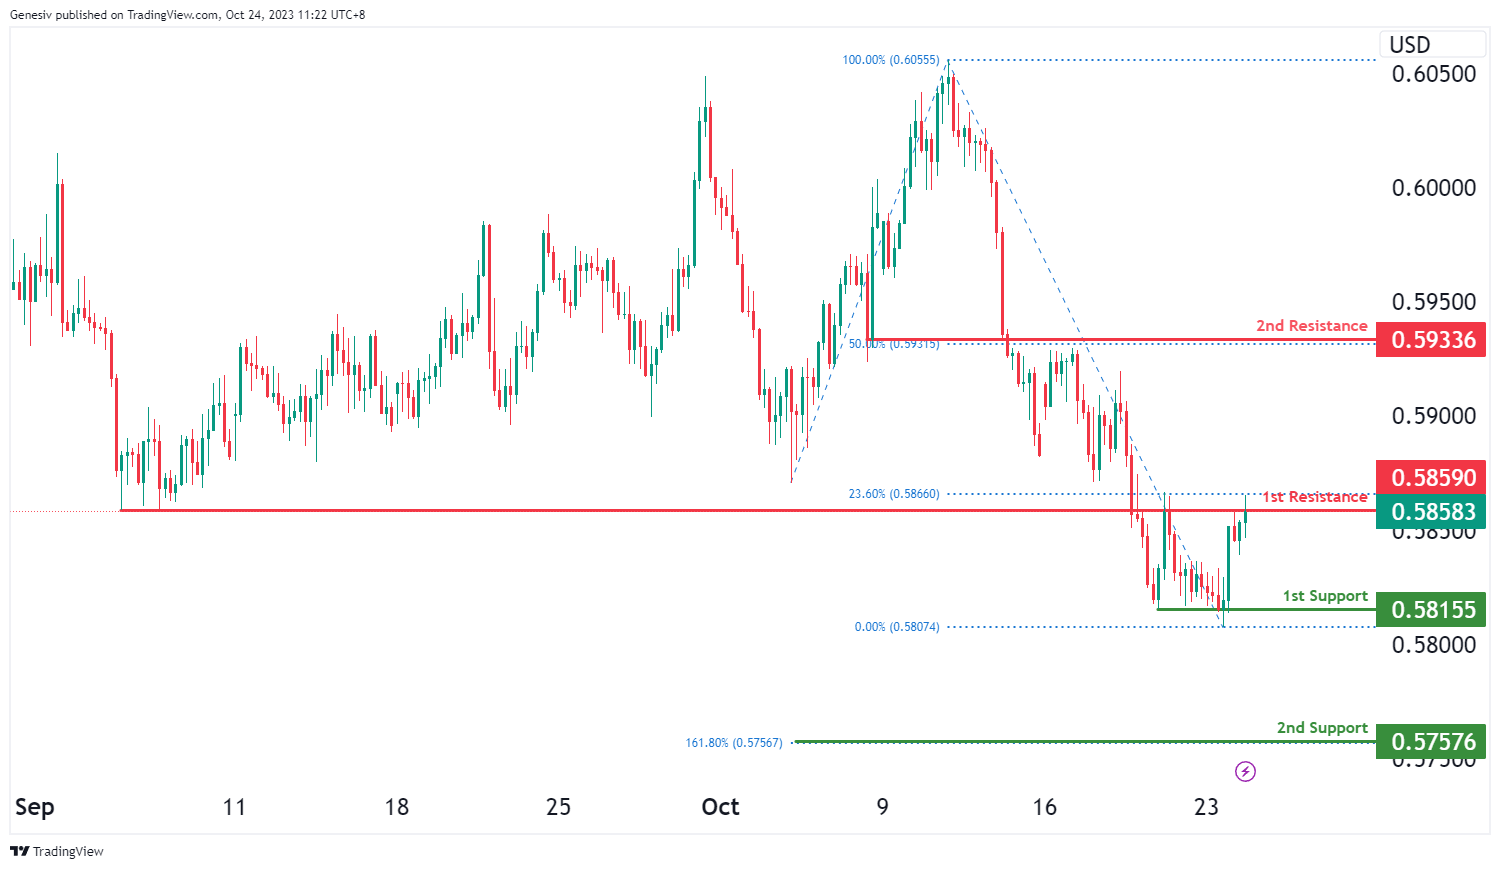
The NZD/USD chart currently exhibits an overall bullish momentum. Price could make a further bullish continuation towards the 2nd resistance level should it break above the 1st resistance level.
The 1st resistance level at 0.5859 is identified as an overlap resistance that aligns close to the 23.60% Fibonacci retracement level. Higher up, the 2nd resistance level at 0.5934 is also marked as an overlap resistance that aligns with the 50.00% Fibonacci retracement level, making it a potentially strong resistance level.
To the downside the 1st support level at 0.5816 is identifed as a pullback support. Additionally, the 2nd support level at 0.5758 is noted as a support level that aligns with the 161.80% Fibonacci extension level, further reinforcing its importance as a potential support area.
DJ30:
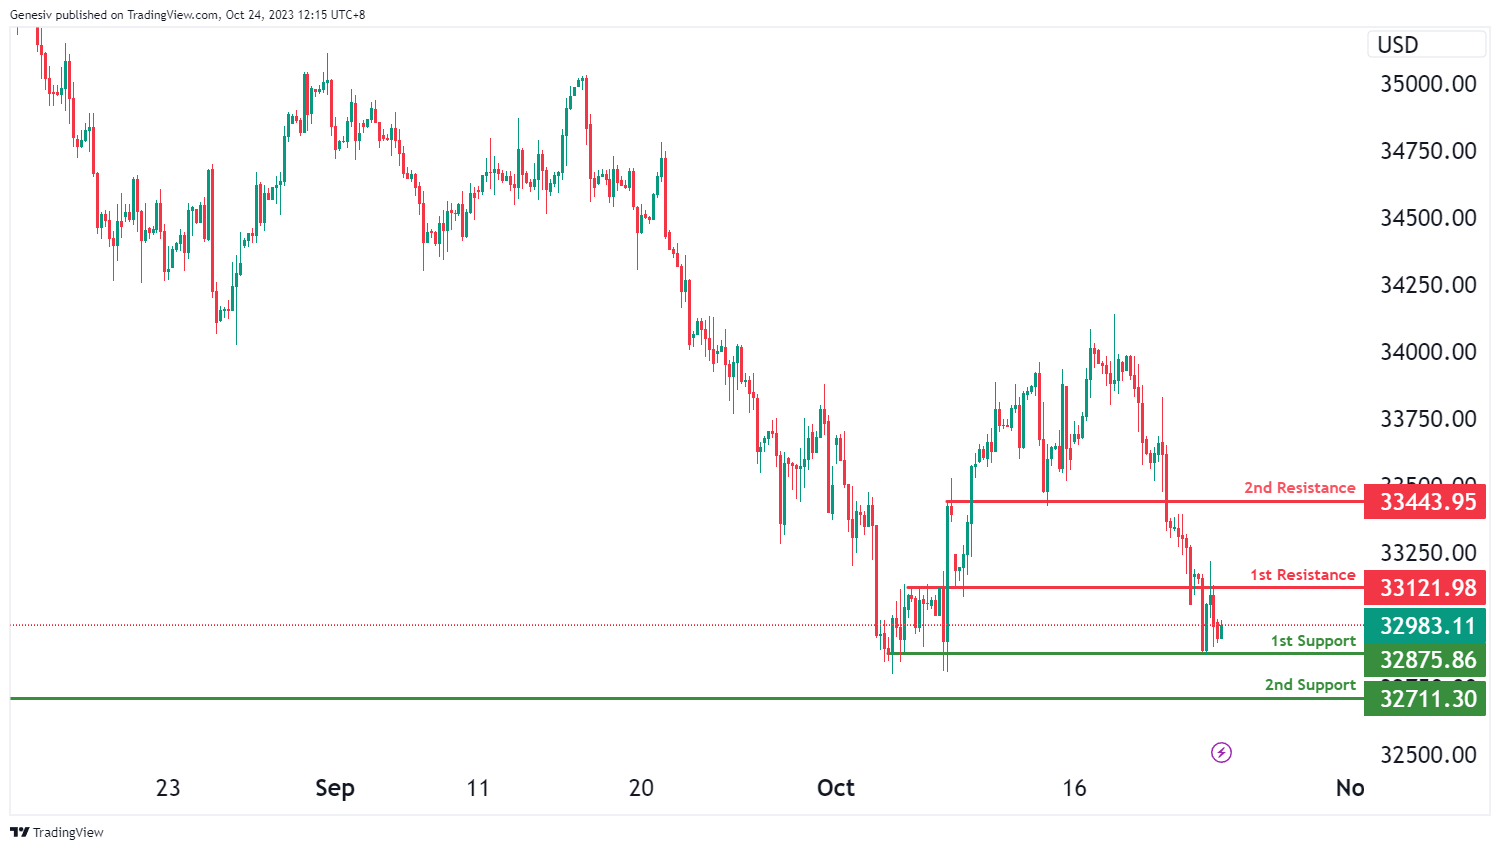
The instrument under analysis is DJ30, and the overall momentum of the chart indicates a bullish trend.
There is a possibility that the price may experience a bullish bounce when approaching the first support level and then head towards the first resistance level.
The first support level is at 32,875.86, and it’s considered strong because it represents a multi-swing low support.
The second support level is at 32,711.30, and it’s also significant as it marks another multi-swing low support.
On the resistance side, the first resistance level is at 33,121.98, and it’s noteworthy because it represents an overlap of resistance.
The second resistance level is at 33,443.95, and it’s significant as well, as it functions as a pullback resistance.
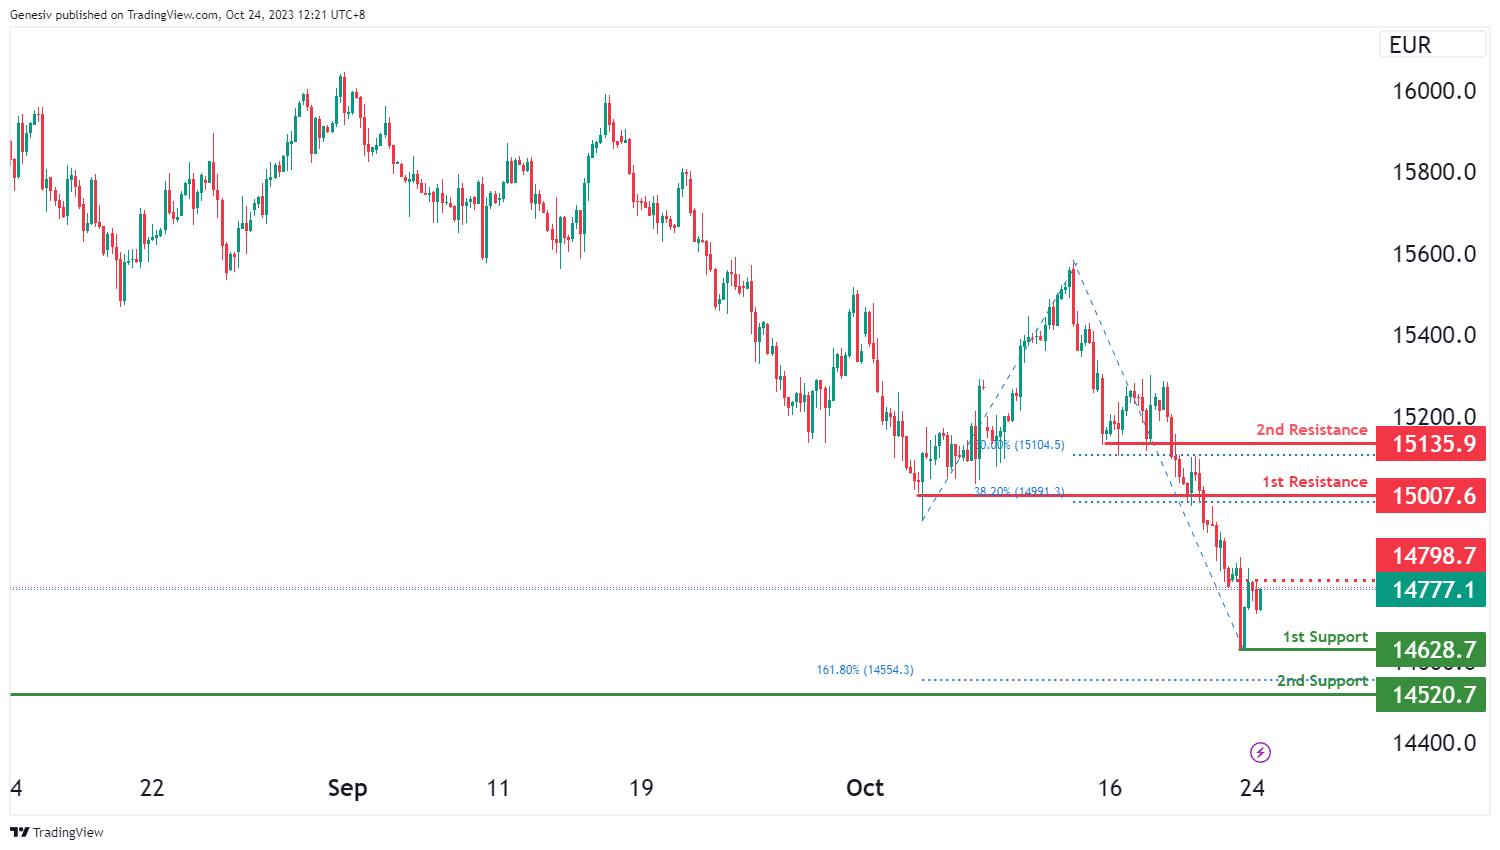
GER40:
The instrument we are examining is GER40, and the overall momentum of the chart indicates a bullish trend.
There is a possibility that the price may continue its bullish momentum, potentially reaching the first resistance level.
The first support level is at 14,628.70, and it’s considered strong because it represents a swing low support.
The second support level is at 14,520.70, and it’s also significant as it marks a pullback support and aligns with a 161.80% Fibonacci Extension.
On the resistance side, the first resistance level is at 15,007.60, and it’s noteworthy because it represents a pullback resistance and aligns with a 38.20% Fibonacci Retracement.
The second resistance level is at 15,135.90, and it’s significant as well, as it functions as a pullback resistance and aligns with a 50% Fibonacci Retracement.
Additionally, there is an intermediate resistance level at 14,798.70, which is significant because it represents an overlap of resistance.
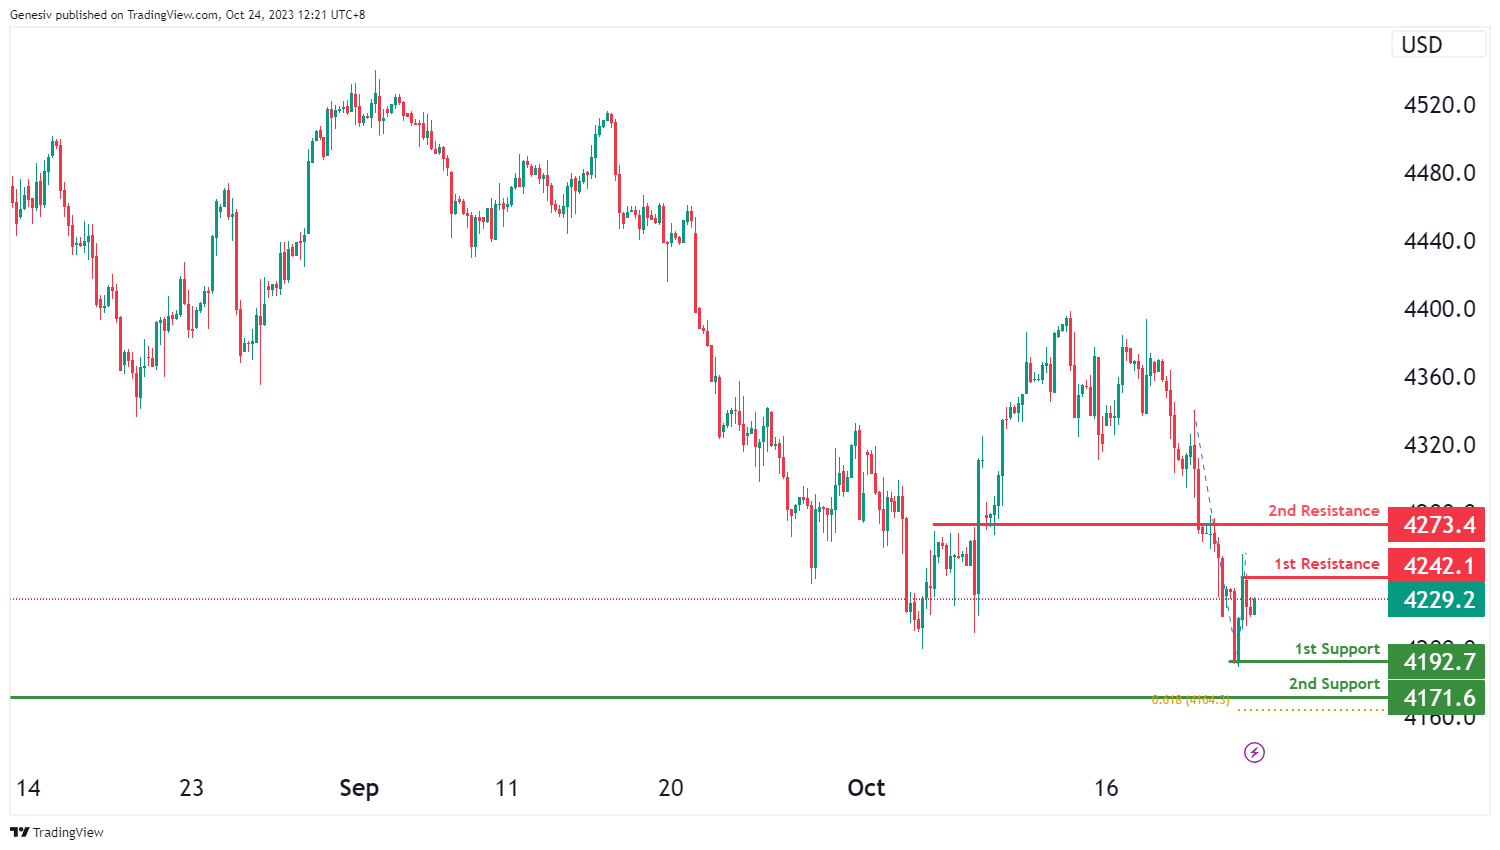
US500
The instrument we are examining is US500, and the overall momentum of the chart indicates a bearish trend.
There is a possibility that the price may experience a short-term rise towards the first resistance level before reversing off it and dropping towards the first support level.
The first support level is at 4,192.7, and it’s considered strong because it represents a swing low support.
The second support level is at 4,171.6, and it’s also significant as it marks another swing low support and aligns with a 61.80% Fibonacci Projection.
On the resistance side, the first resistance level is at 4,242.1, and it’s noteworthy because it represents a swing high resistance.
The second resistance level is at 4,273.4, and it’s significant as well, as it functions as an overlap of resistance.
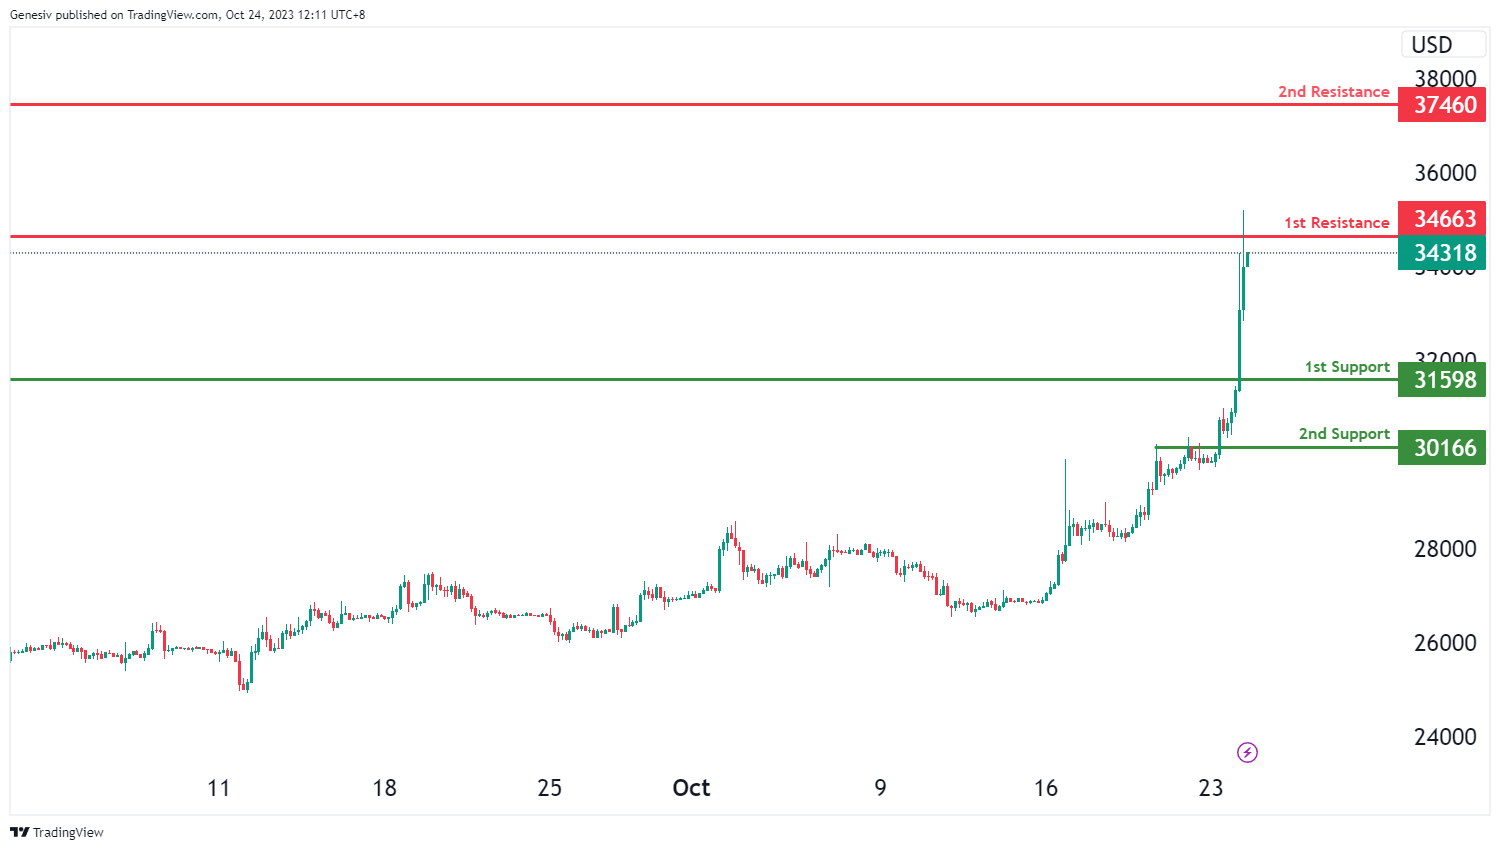
BTC/USD:
The instrument we are examining is BTC/USD, and the overall momentum of the chart indicates a bullish trend.
There is a possibility that the price may continue its bullish momentum, potentially reaching the first resistance level.
The first support level is at 31,598, and it’s considered strong because it represents a pullback support.
The second support level is at 30,166, and it’s also significant as it marks another pullback support.
On the resistance side, the first resistance level is at 34,663, and it’s noteworthy because it represents a pullback resistance.
The second resistance level is at 37,460, and it’s significant as well, as it functions as a pullback resistance.
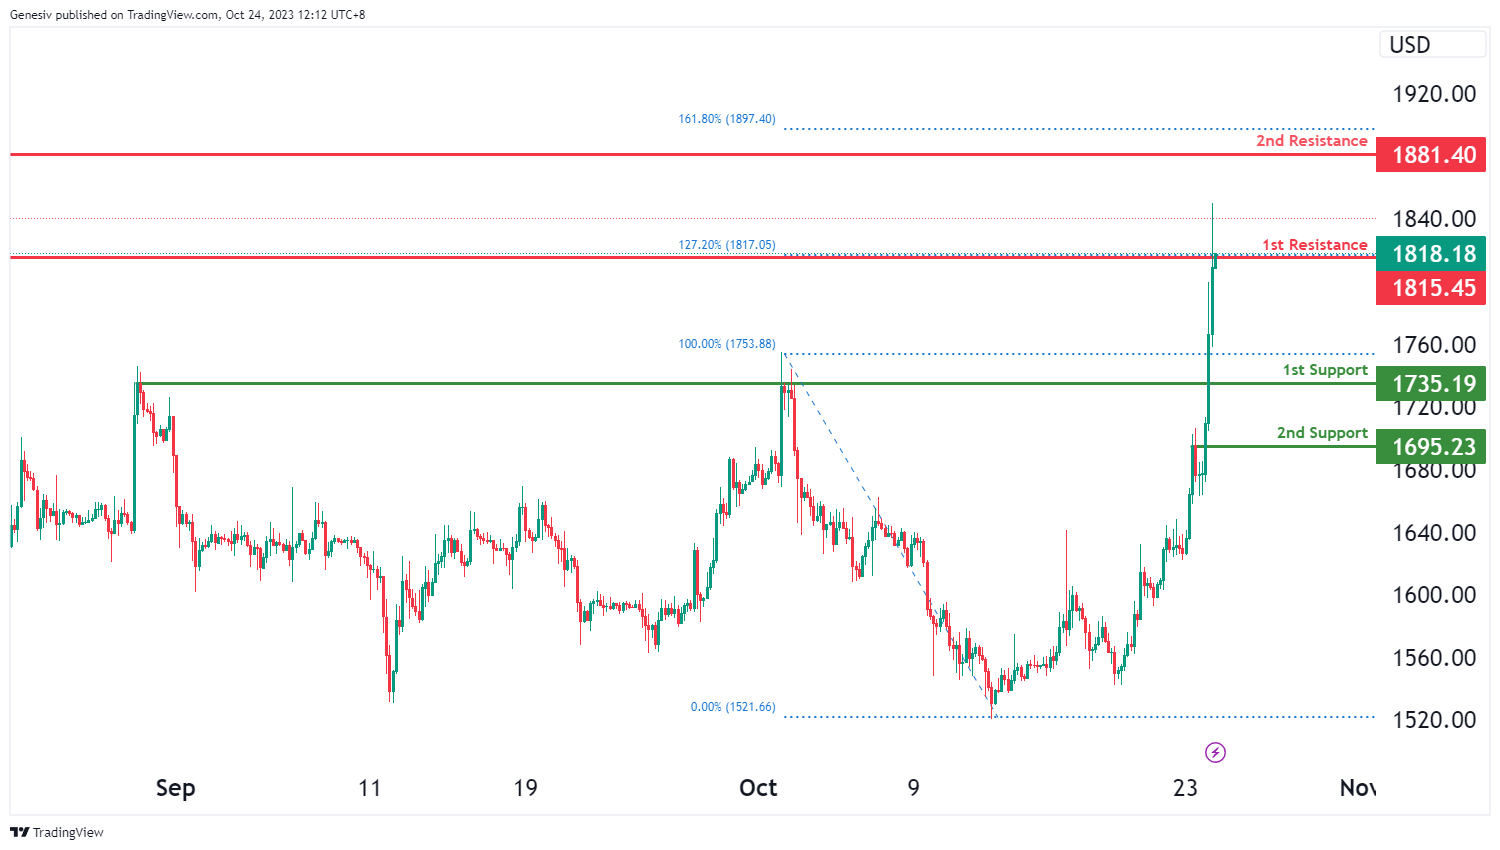
ETH/USD:
The instrument under analysis is ETH/USD, and the overall momentum of the chart indicates a bearish trend.
There is a possibility that the price may experience a bearish reaction when approaching the first resistance level and then drop to the first support level.
The first support level is at 1,735.19, and it’s considered strong because it represents a pullback support.
The second support level is at 1,695.23, and it’s also significant as it marks another pullback support.
On the resistance side, the first resistance level is at 1,815.45, and it’s noteworthy because it represents a pullback resistance and aligns with a 127.20% Fibonacci Extension.
The second resistance level is at 1,881.40, and it’s significant as well, as it functions as a multi-swing high resistance and aligns with a 161.80% Fibonacci Extension.
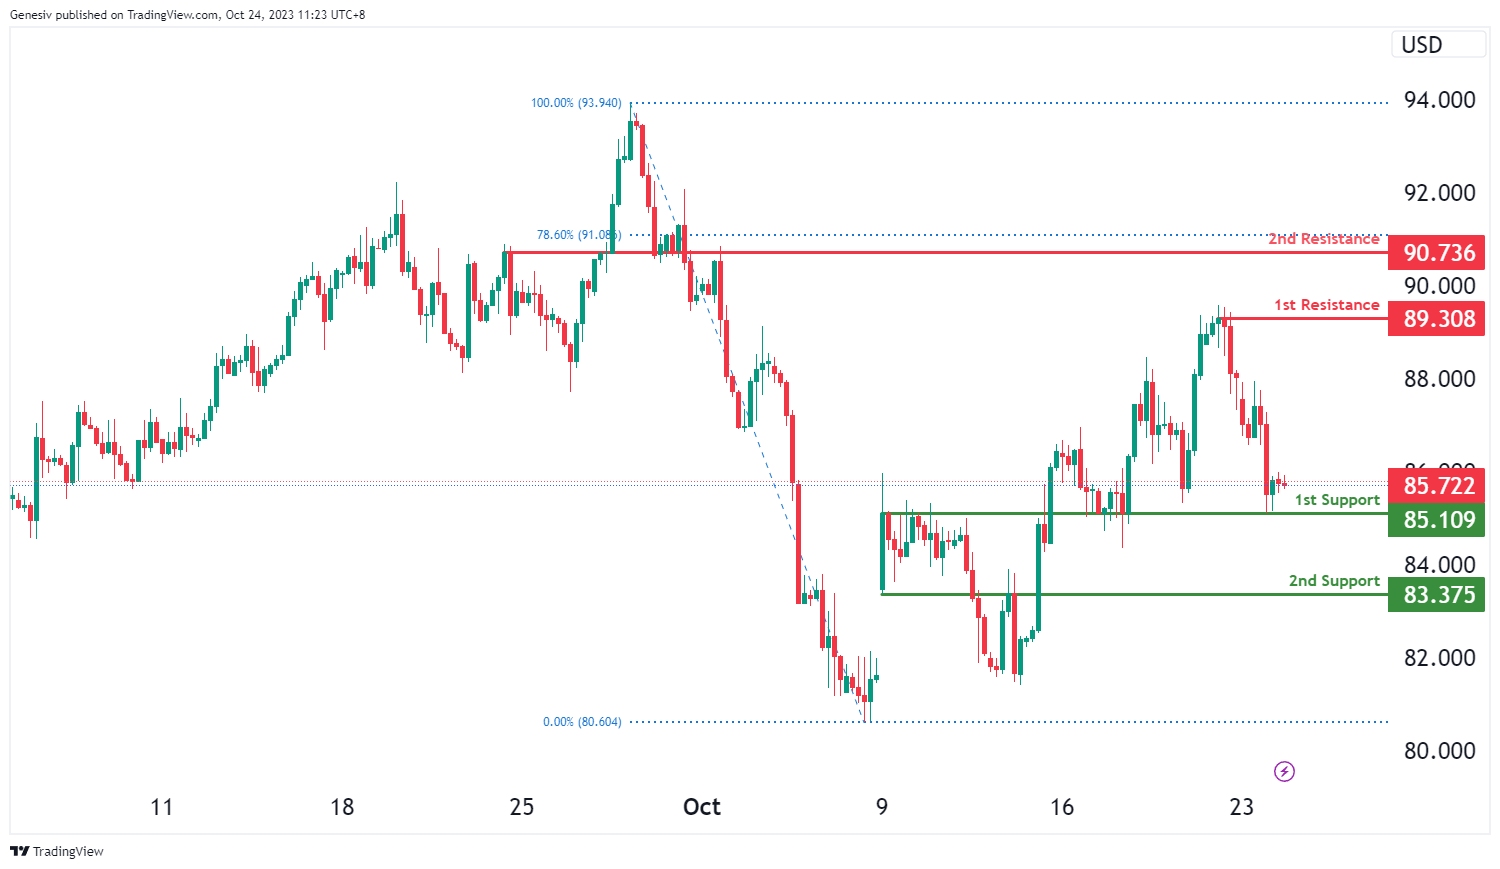
WTI/USD:
The WTI chart currently exhibits a weak bullish momentum, indicating a potential scenario for price to make a bullish reaction off the 1st support level.
The 1st support level at 85.11 is identified as an overlap support. Further below, the 2nd support level at 83.38 is also marked as an overlap support, indicating a potential support zone.
To the upside, the 1st resistance level at 89.31 is identified as a swing-high resistance. Beyond this, the 2nd resistance level at 90.74 is noted as an overlap resistance that aligns close to the 78.60% Fibonacci retracement level, making it a potentially strong resistance level.
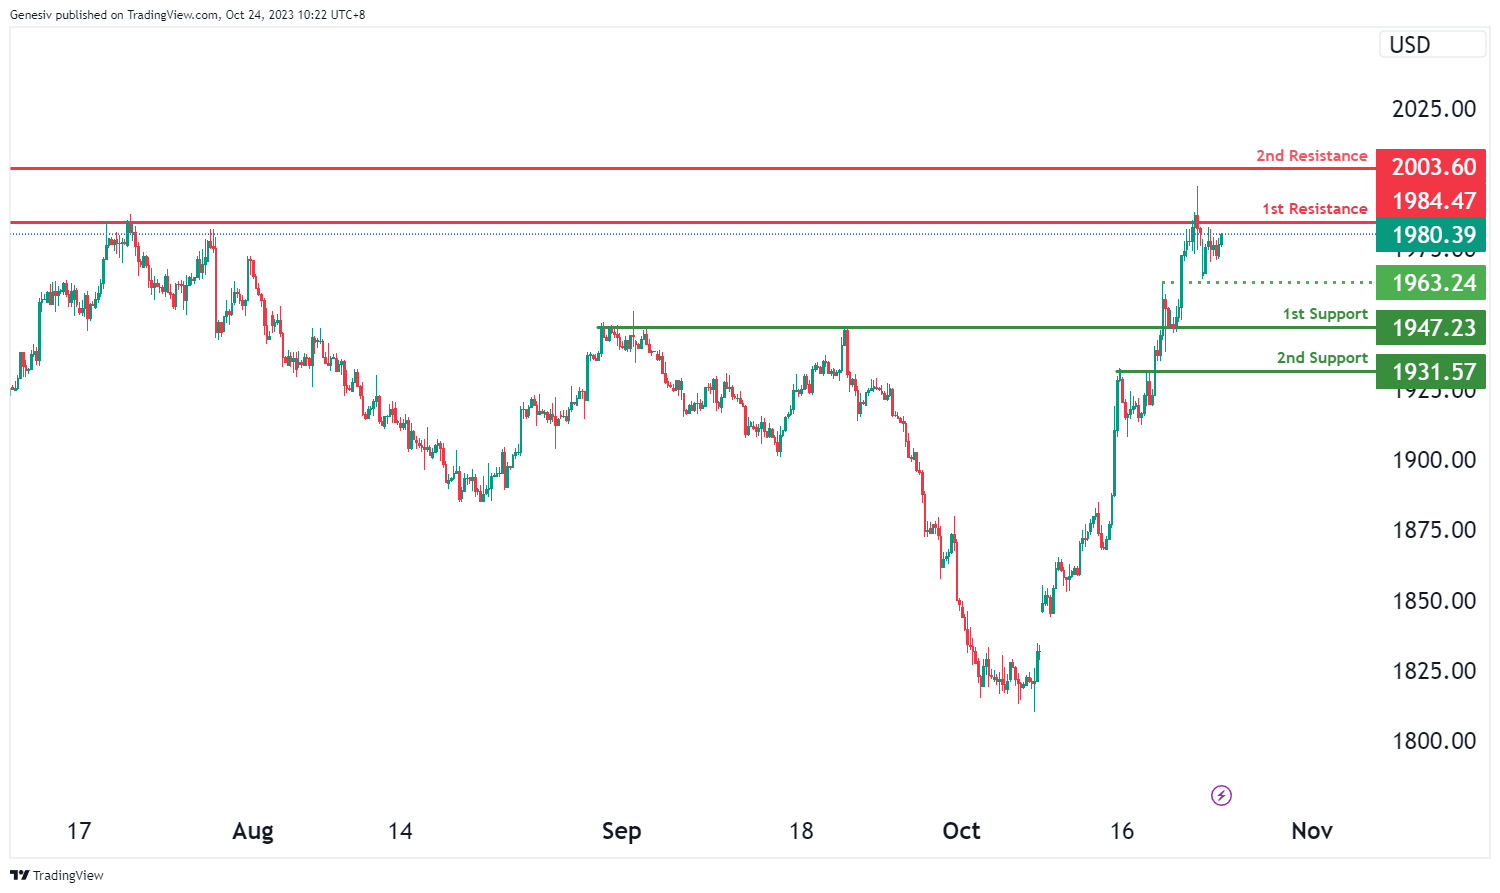
XAU/USD (GOLD):
The XAU/USD chart is currently influenced by a bearish overall momentum, indicating the potential for a bearish continuation towards the 1st support level.
The 1st support at 1947.23 holds significance as it coincides with an overlap support, underscoring its potential as a crucial price support zone. Additionally, the presence of a 2nd support level at 1931.57, identified as a pullback support, further strengthens the case for potential bearish movement.
On the resistance side, the 1st resistance at 1984.47 is characterized as a multi-swing high resistance. This designation implies that it has previously acted as a robust barrier to upward price movements, making it a key area to monitor for potential reversals or slowdowns in the bearish trend. Additionally, the 2nd resistance at 2003.60, identified as a swing high resistance, could provide added resistance if the price attempts to move higher.
An intermediate support level is also observed at 1963.24, labeled as a pullback support. This level may serve as a temporary resting point for the price during its bearish trajectory.


