
DXY:
The DXY chart currently maintains a bearish overall momentum, suggesting the potential for a bearish continuation towards the 1st support level.
The 1st support at 105.38 is considered significant as it aligns with an overlap support level, indicating its potential importance as a substantial area of price support. Additionally, there is an intermediate support at 106.02, which is identified as a pullback support. This further reinforces the notion of potential support in this region and may act as a key level where buyers could step in to counter further downward movement.
On the resistance side, the 1st resistance at 106.72 is characterized as a swing high resistance level, signifying a potential barrier to upward price movements. Beyond this, the 2nd resistance at 107.37 is also marked as a swing high resistance, emphasizing the presence of resistance zones that could impede any upward price advances.

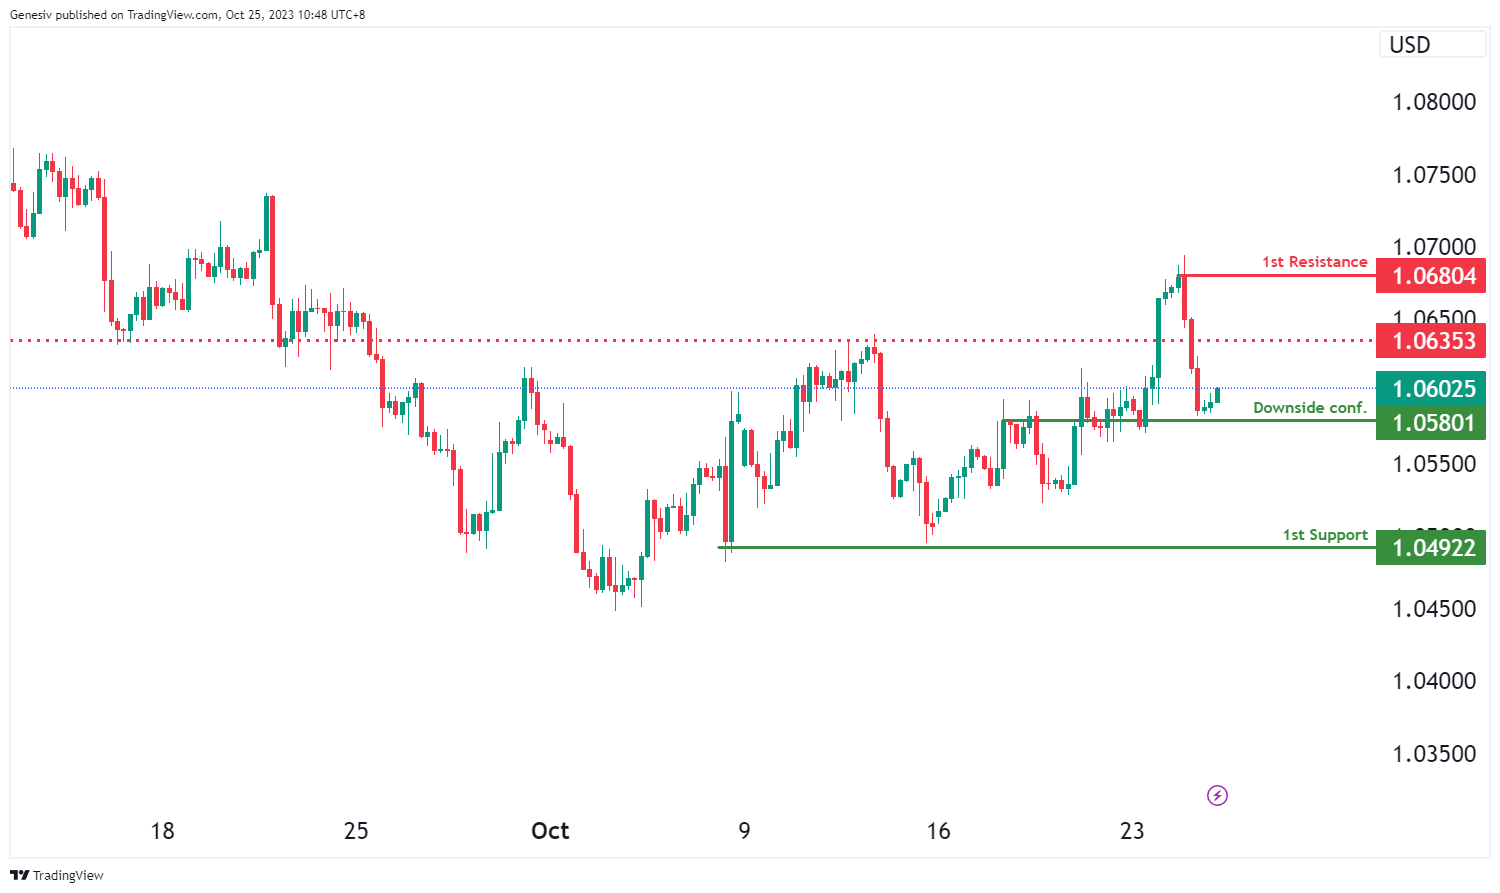
EUR/USD:
The EUR/USD chart currently exhibits a bullish overall momentum, indicating the potential scenario of a bullish continuation towards the 1st resistance level.
The 1st support at 1.0492 is considered significant as it aligns with a swing low support level, suggesting a potential area of price support. Additionally, there is a level at 1.0580 where traders are waiting for downside confirmation, and it’s identified as an overlap support. This level may serve as a key reference point for potential reversals.
On the resistance side, the 1st resistance at 1.0680 is characterized as a swing high resistance level, indicating a potential barrier to further upward price movements. Additionally, there is an intermediate resistance at 1.0635, marked as an overlap resistance, which could further impede upward price advances.
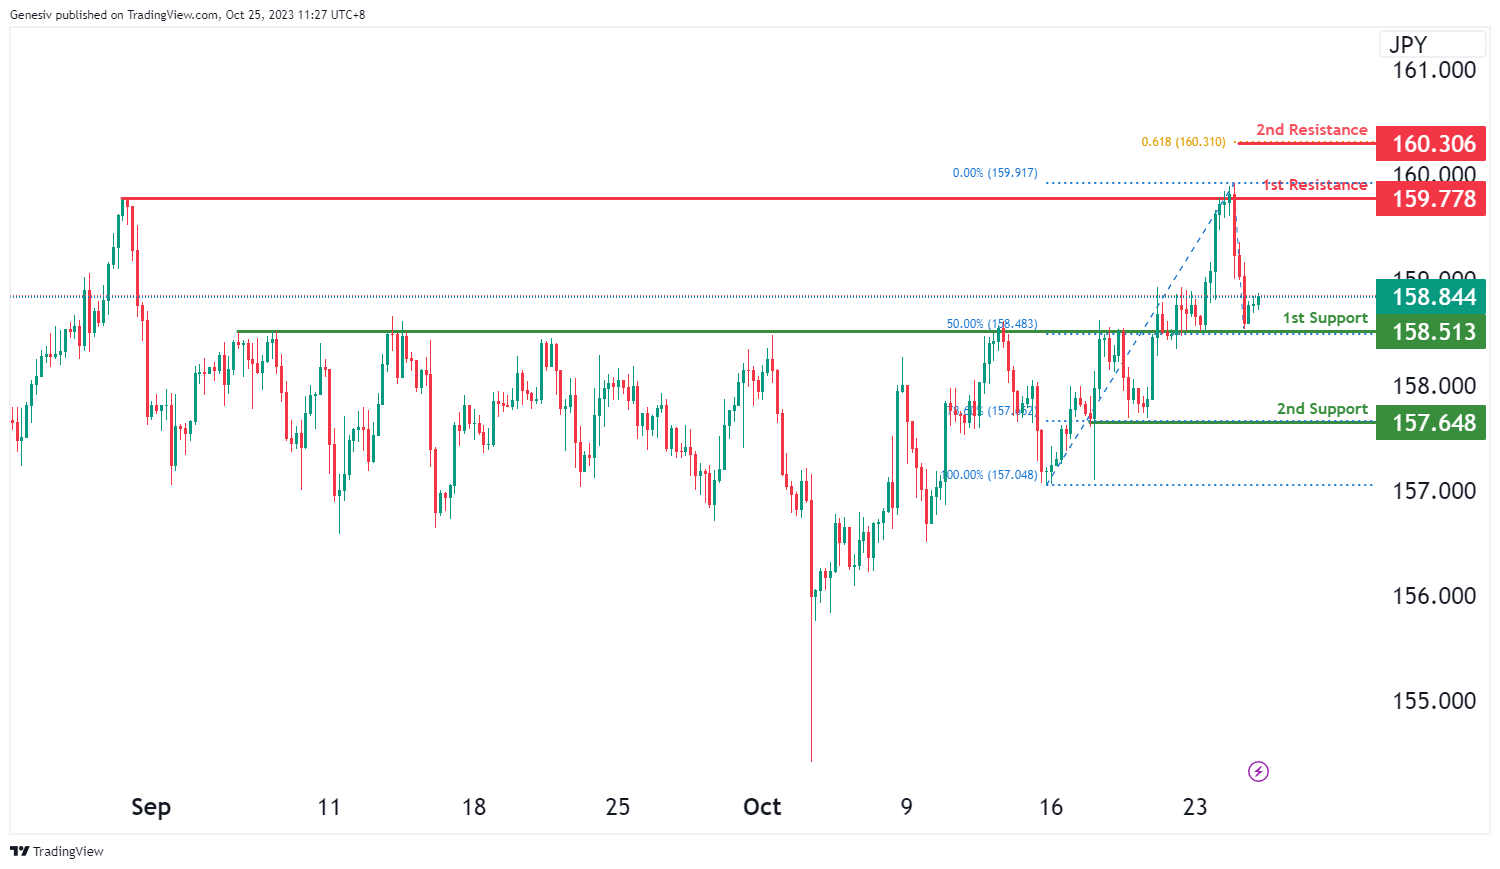
EUR/JPY:
The EUR/JPY chart is exhibiting a weak bullish momentum with price making a bullish reaction off the 1st support level to rise towards the 1st resistance level.
The 1st support level at 158.51 is identified as an overlap support that aligns with the 50.00% Fibonacci retracement level. Further below, the 2nd support level at 157.65 is marked a pullback support that aligns with the 78.60% Fibonacci retracement level.
On the resistance side, the 1st resistance level at 159.78 is identified as a pullback resistance. The 2nd resistance level at 160.31 is identified as a level that aligns with the 61.80% Fibonacci projection level.
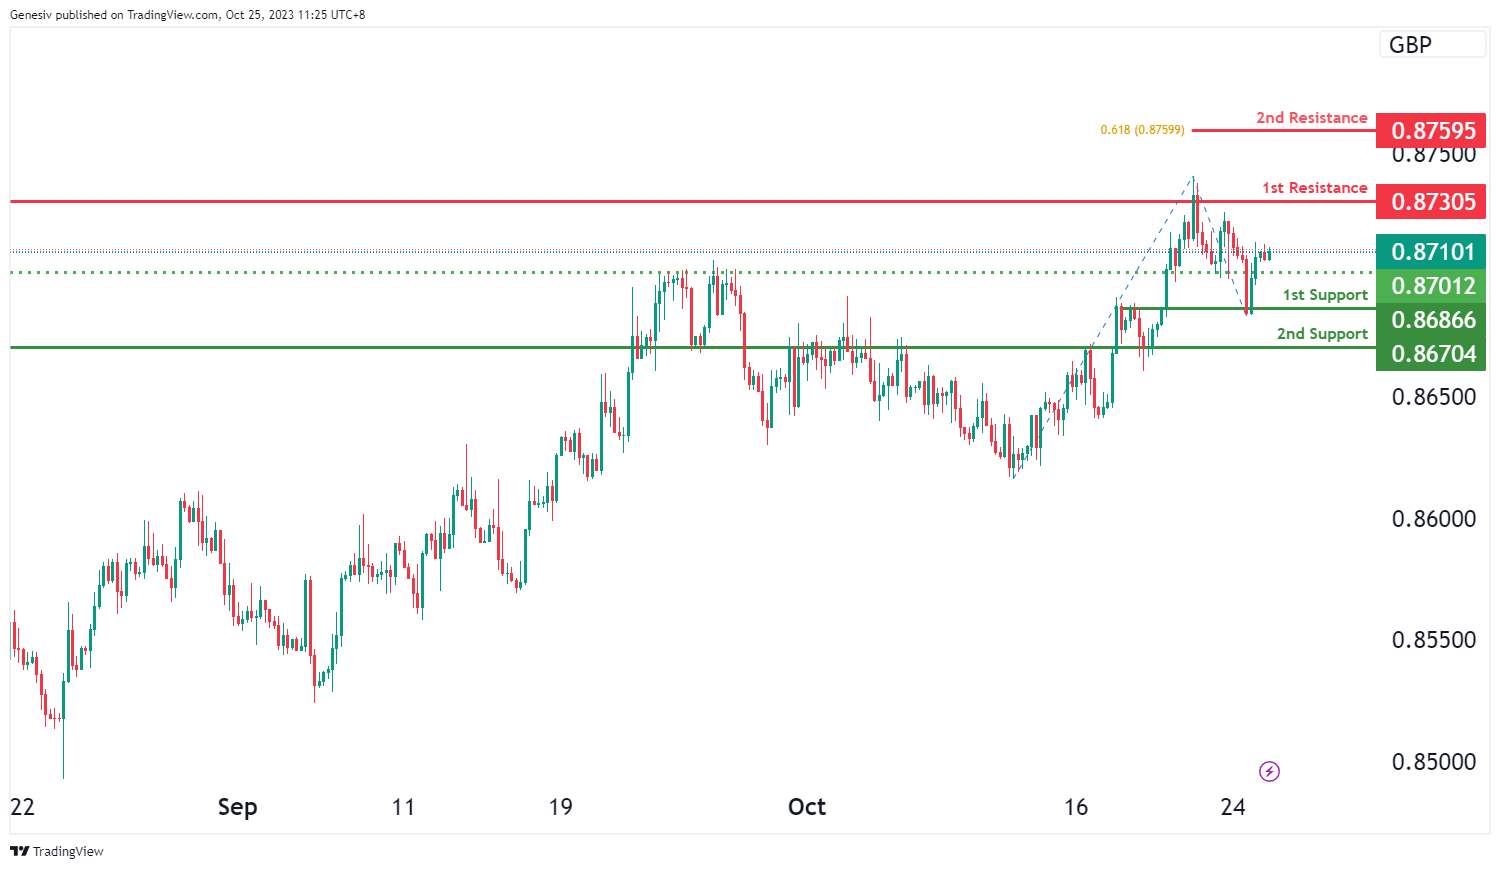
EUR/GBP:
The EUR/GBP chart is exhibiting a bullish momentum with price making a bullish continuation towards the 1st resistance level.
The 1st resistance level at 0.8731 is identified as an overlap resistance. Higher up, the 2nd resistance level at 0.8759 is identified as a level that aligns with the 61.80% Fibonacci projection level.
To the downside, the intermediate support level at 0.8701 is identified as an overlap support while the 1st support level at 0.8687 is also marked as an overlap support. Further below, the 2nd support level at 0.8670 is identified as an overlap support.
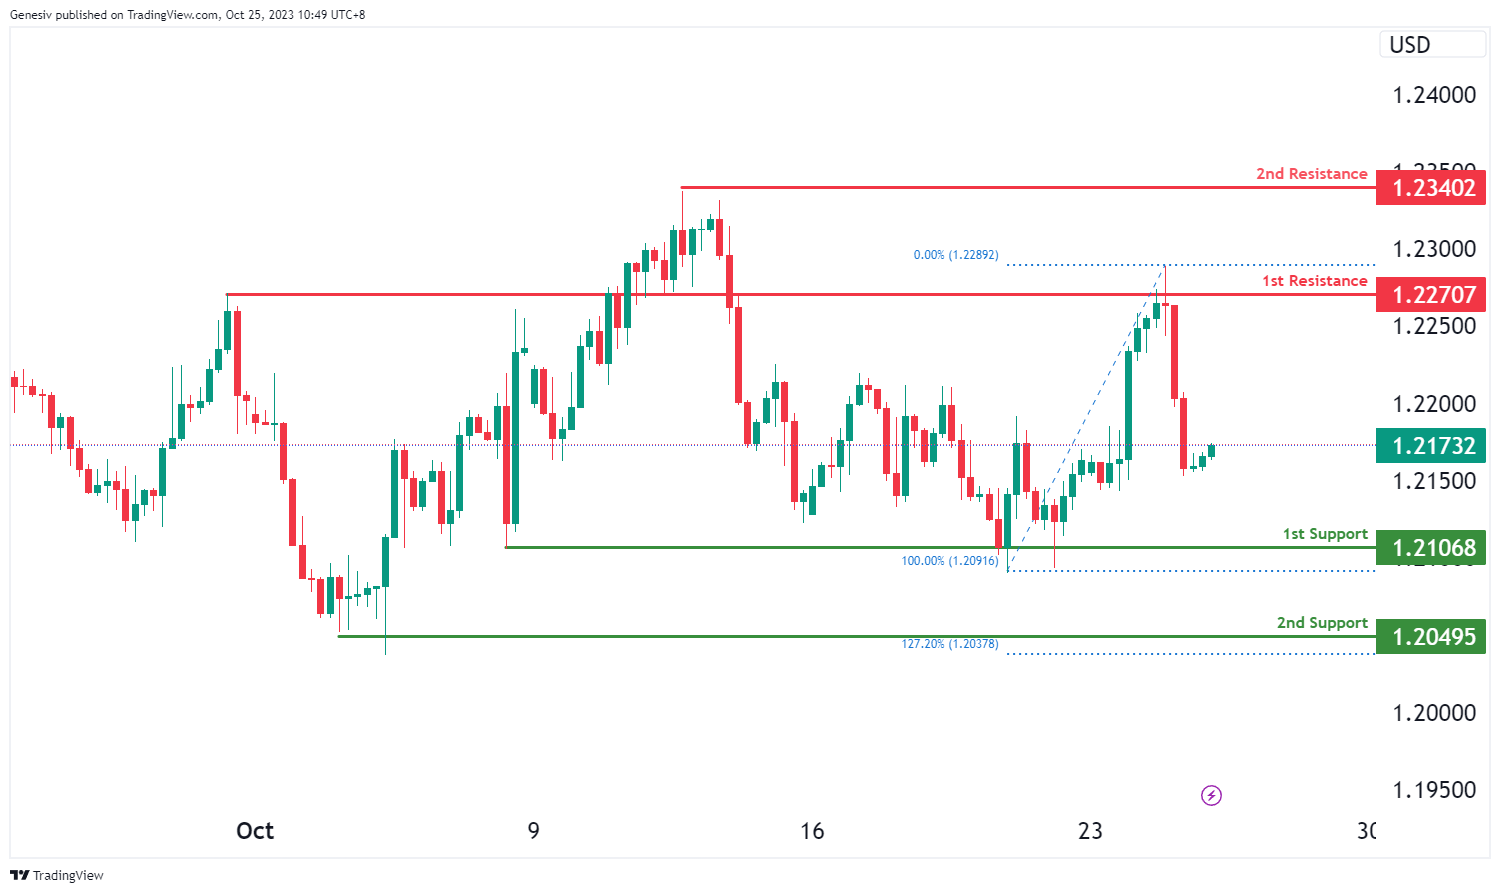
GBP/USD:
The GBP/USD chart currently exhibits bearish overall momentum, suggesting the potential for a bearish continuation towards the 1st support level.
The 1st support at 1.2106 is considered significant as it aligns with a multi-swing low support level, indicating a potential area of price support. Additionally, the 2nd support at 1.2049 is identified as another multi-swing low support, and it coincides with the 127.20% Fibonacci Extension level, which adds to its significance as a potential strong support level.
On the resistance side, the 1st resistance at 1.2270 is characterized as an overlap resistance level, which could pose as a barrier to further upward price movements. Furthermore, the 2nd resistance at 1.2340 is marked as a swing high resistance, indicating another potential level where the price may face resistance.
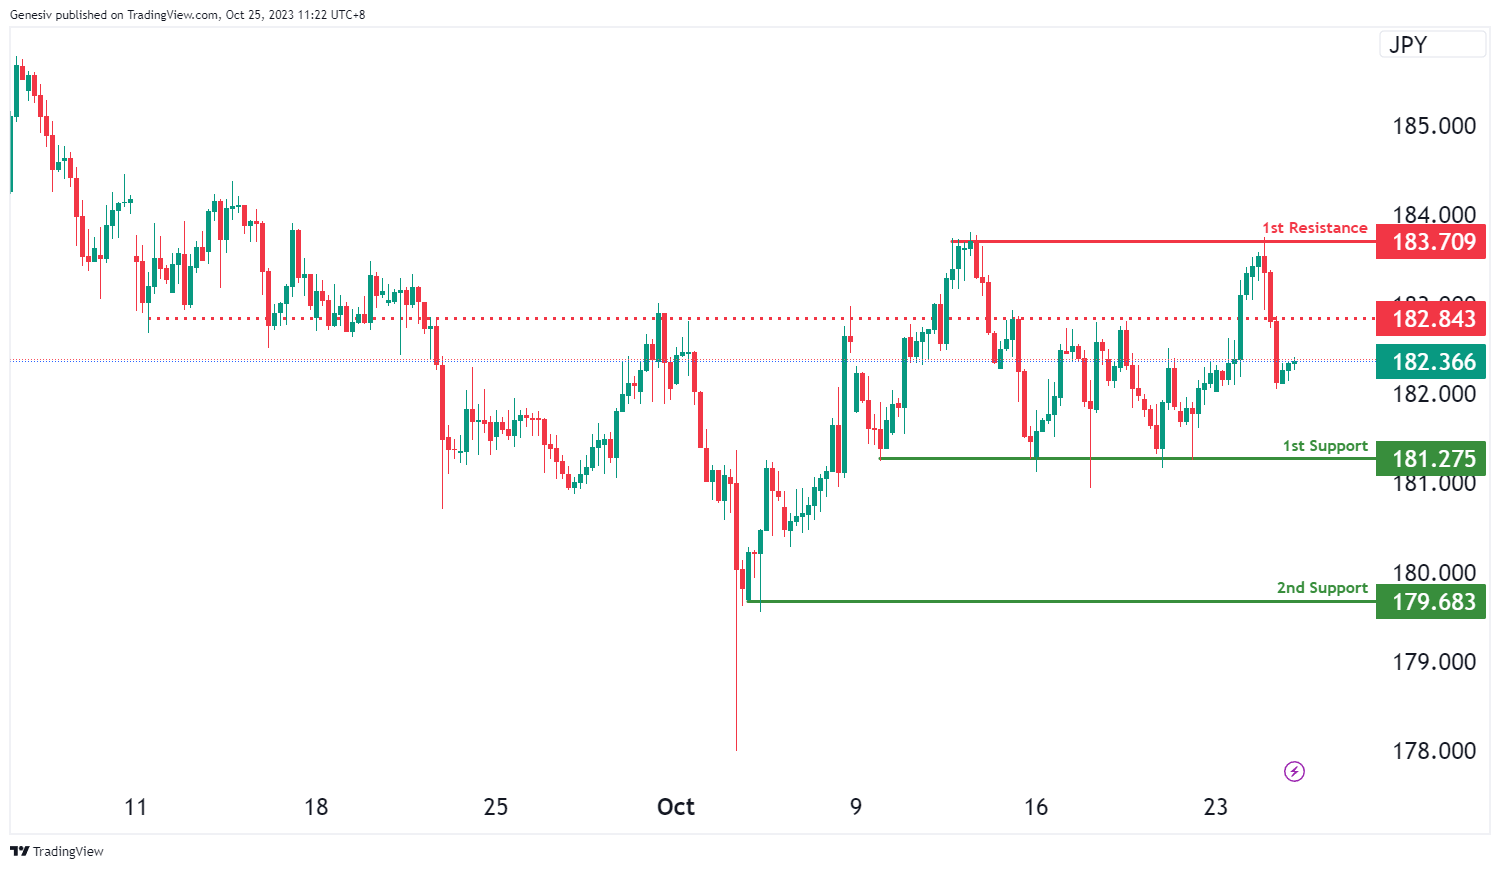
GBP/JPY:
The GBP/JPY chart currently exhibits a neutral momentum with price potentially fluctuating between the 1st resistance and the 1st support levels.
The 1st support level at 181.28 is identified as a pullback support. Further below, the 2nd support level at 179.68 is marked as a swing-low support.
On the resistance side, the intermediate resistance level at 182.84 is identified as an overlap resistance. Higher up, the 1st resistance level at 183.71 is noted as a pullback resistance.
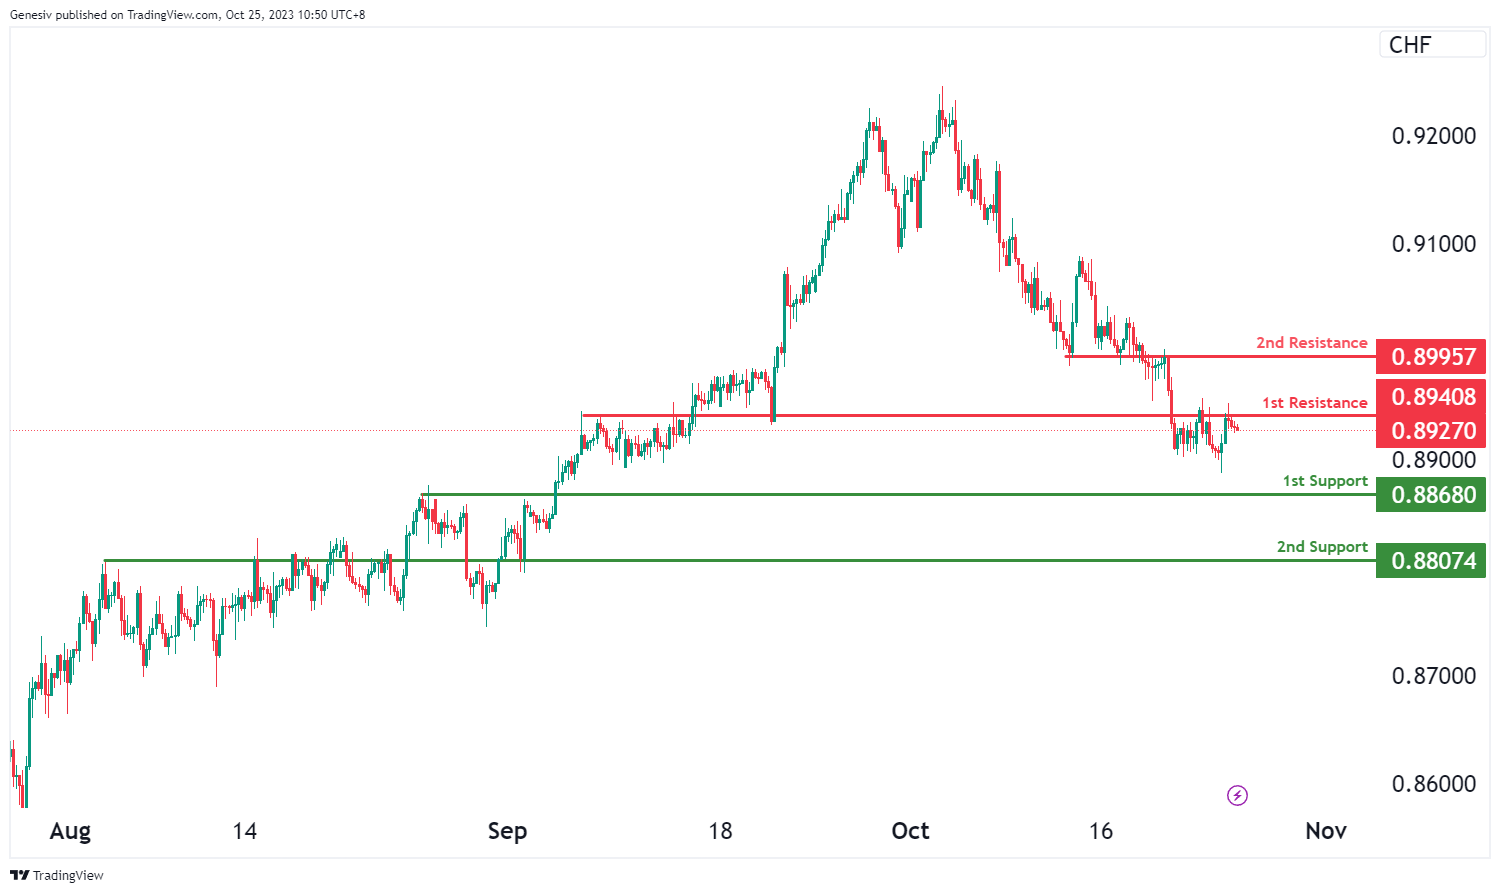
USD/CHF:
The USD/CHF chart currently exhibits bearish overall momentum, indicating the potential for a bearish continuation towards the 1st support level.
The 1st support at 0.8868 is considered significant as it aligns with a pullback support level, suggesting it could act as a potential area of price support. Additionally, the 2nd support at 0.8807 is identified as an overlap support, further reinforcing the potential for it to provide strong support to the price.
On the resistance side, the 1st resistance at 0.8940 is characterized as an overlap resistance level, which could serve as a barrier to any significant upward price movement. Furthermore, the 2nd resistance at 0.8995 is also marked as an overlap resistance, indicating another potential level where the price may face resistance.
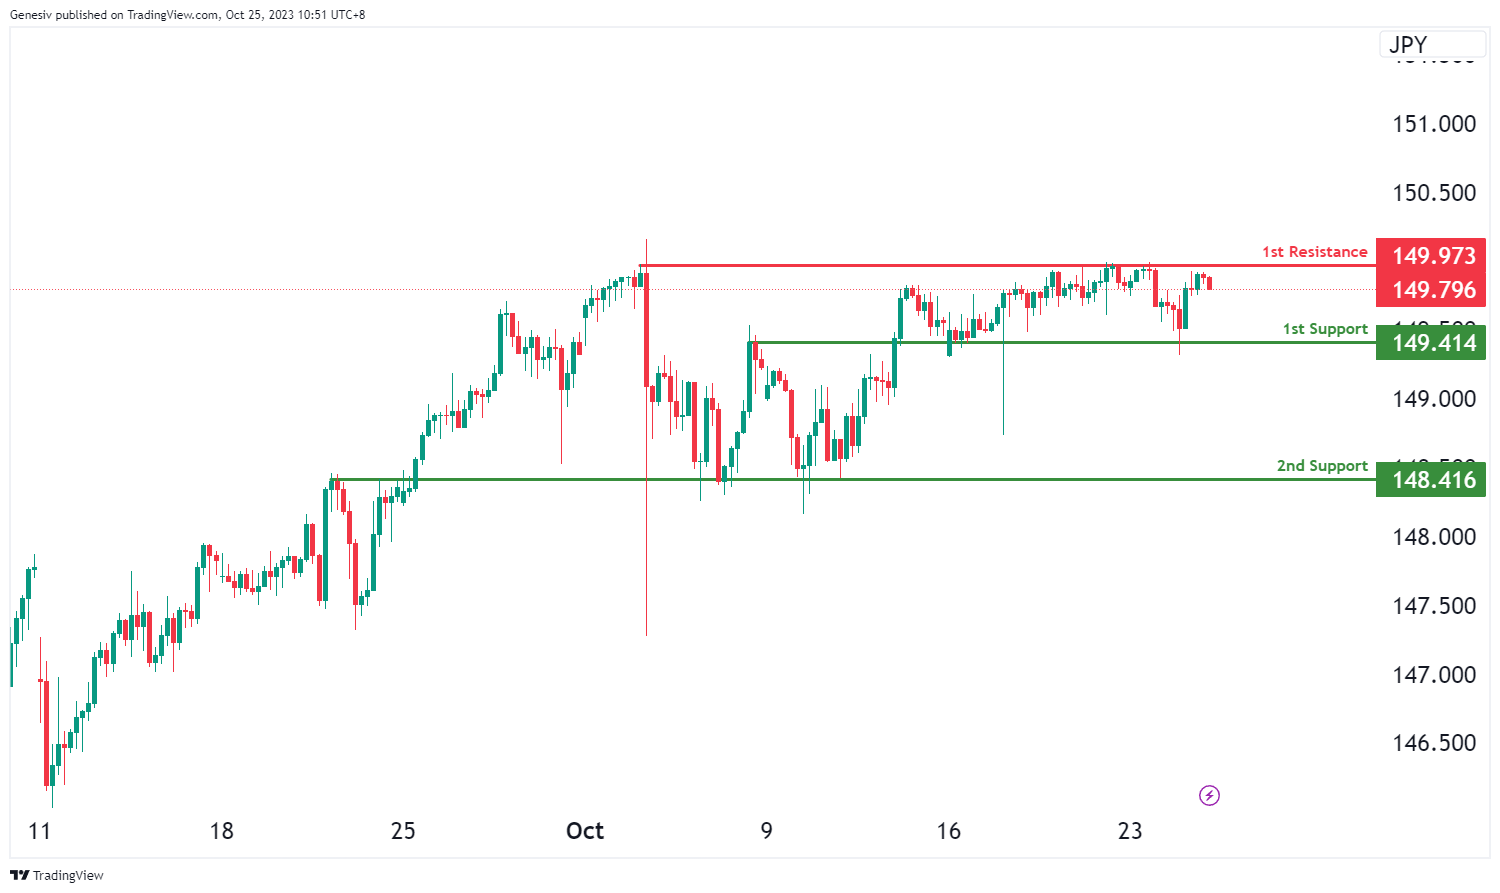
USD/JPY:
The USD/JPY chart currently exhibits a bearish overall momentum, indicating the potential for a bearish continuation towards the 1st support level.
The 1st support at 149.41 is considered significant as it aligns with an overlap support level, suggesting it could act as a potential area of price support. Additionally, the 2nd support at 148.41 is also identified as an overlap support, further reinforcing the potential for it to provide strong support to the price.
On the resistance side, the 1st resistance at 149.97 is characterized as a multi-swing high resistance level, indicating a potential barrier to any significant upward price movement.
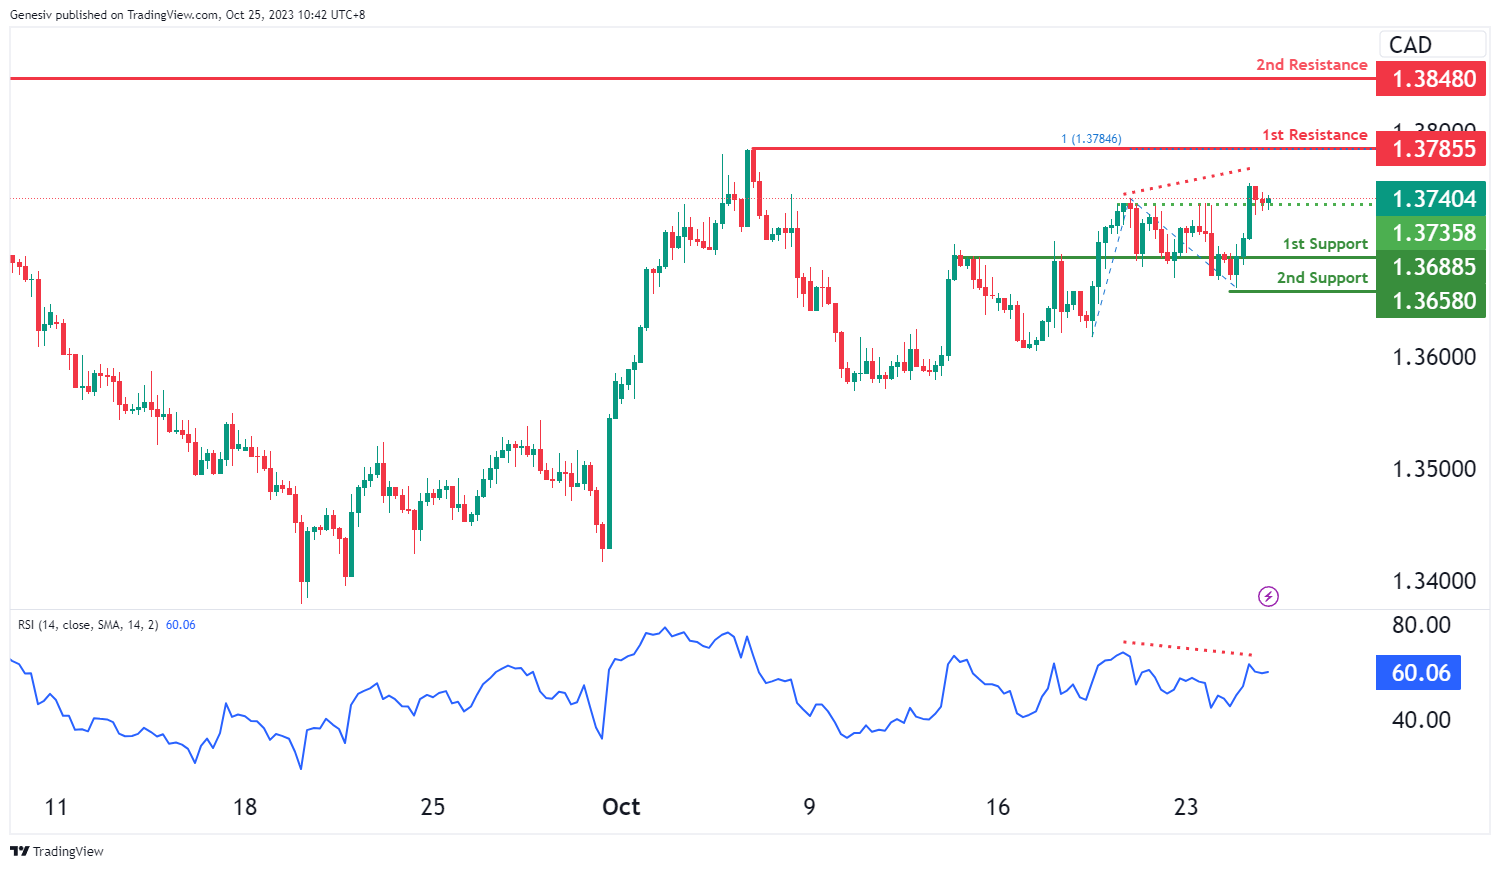
USD/CAD:
The USD/CAD chart currently exhibits an overall bullish momentum. However, the Relative Strength Index (RSI) is displaying bearish divergence versus price, indicating the likelihood of a bearish move towards the 1st support level, especially if price breaks below the intermediate support.
The intermediate support level at 1.3736 is identified as an overlap support while the 1st support level at 1.3689 is also marked as an overlap support. Further below, the 2nd support level at 1.3658 is noted as a pullback support, potentially acting as a strong support zone.
To the upside, the 1st resistance level at 1.3786 is identified as a swing-high resistance that aligns with the 100.00% Fibonacci projection level. Higher up, the 2nd resistance level at 1.848 is also marked as a swing-high resistance, potentially acting as a barrier to further bullish advances.
AUD/USD:
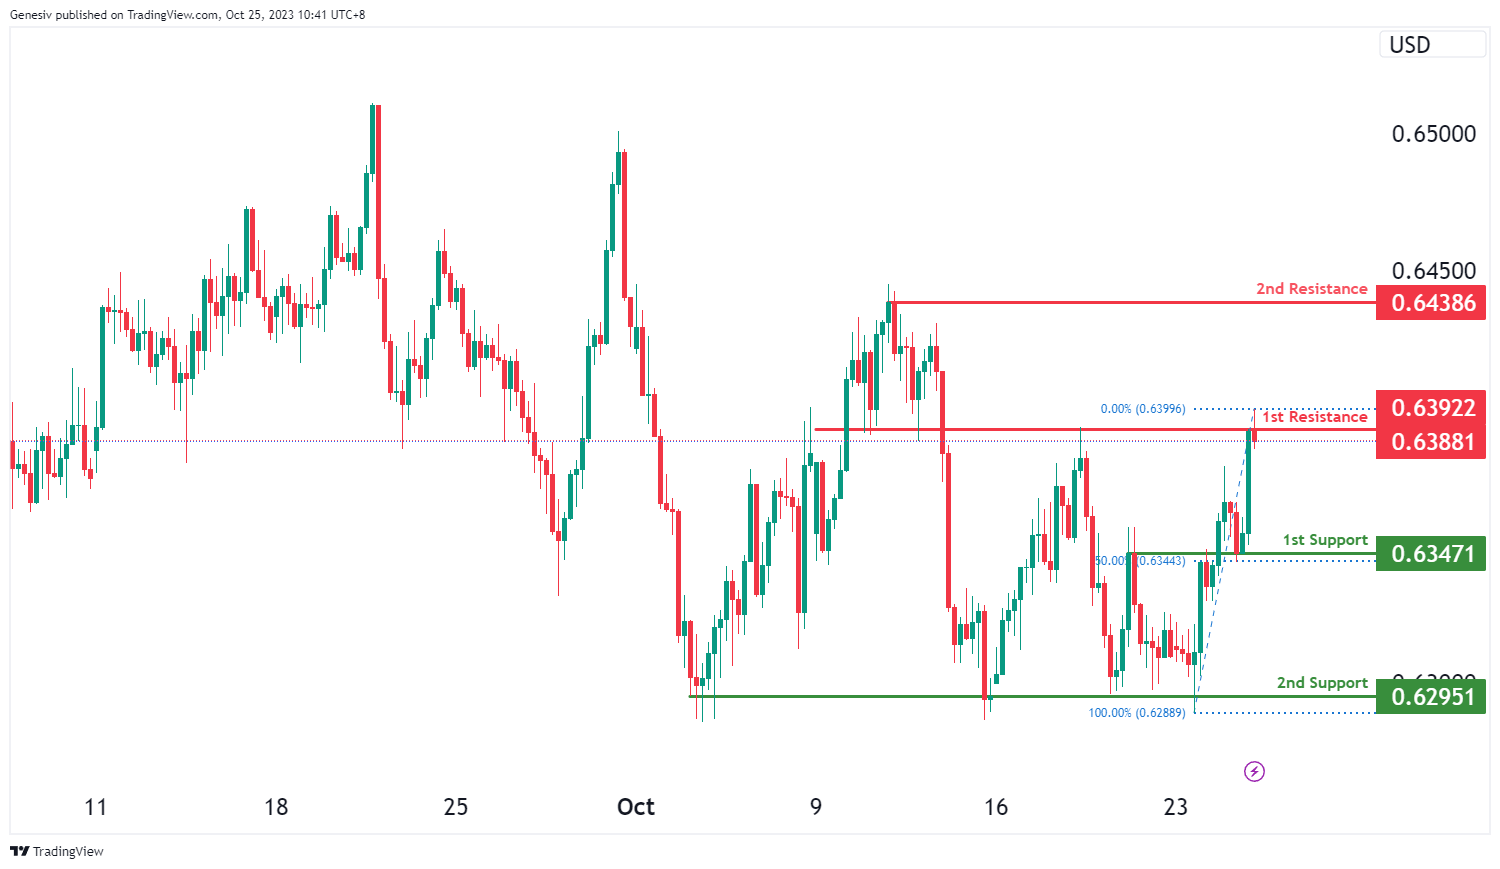
The AUD/USD chart currently exhibits a neutral momentum with price potentially making a bearish reaction off the 1st resistance level to drop lower towards the 1st support level.
The 1st resistance level at 0.6392 is identified as an overlap resistance. Higher up, the 2nd resistance level at 0.6439 is marked as a swing-high resistance, making it a potentially strong resistance level.
To the downside the 1st support level at 0.6347 is identified as an overlap support that aligns with the 50.00% Fibonacci retracement level. Additionally, the 2nd support level at 0.6295 is noted as a multi-swing-low support, further reinforcing its importance as a potential support area.
NZD/USD
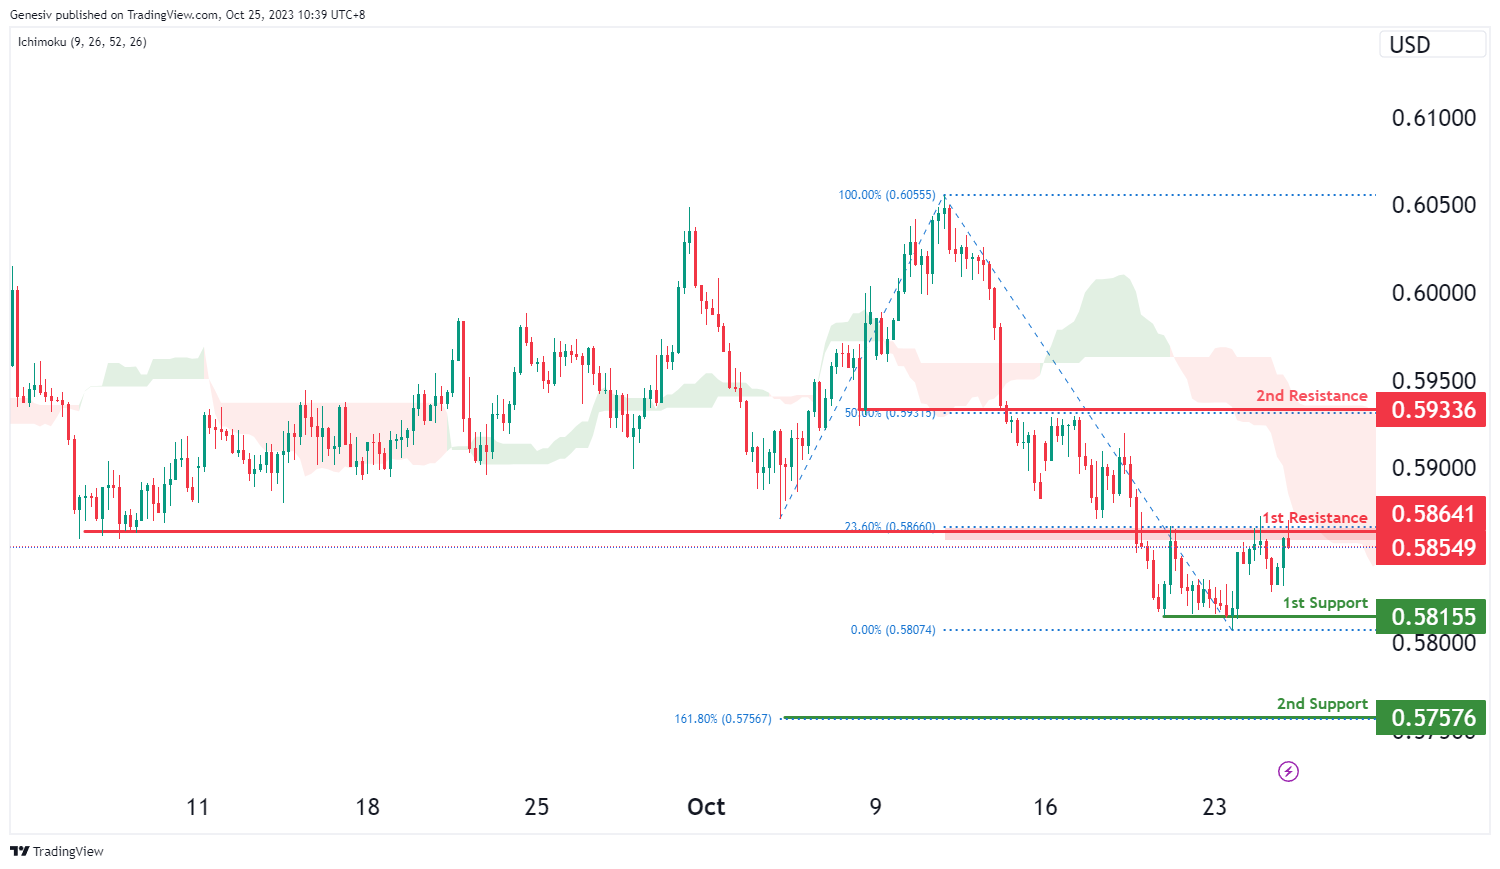
The NZD/USD chart currently exhibits an overall bearish momentum with price potentially making a bearish reaction off the 1st resistance level to drop lower towards the 1st support level. In addition, price is also trading below the bearish Ichimoku cloud to reinforce the bearish momentum.
The 1st resistance level at 0.5864 is identified as an overlap resistance that aligns with the 23.60% Fibonacci retracement level. Higher up, the 2nd resistance level at 0.5934 is also marked as an overlap resistance that aligns with the 50.00% Fibonacci retracement level, making it a potentially strong resistance level.
To the downside the 1st support level at 0.5816 is identified as a pullback support. Additionally, the 2nd support level at 0.5758 is noted as a support level that aligns with the 161.80% Fibonacci extension level, further reinforcing its importance as a potential support area.
DJ30:
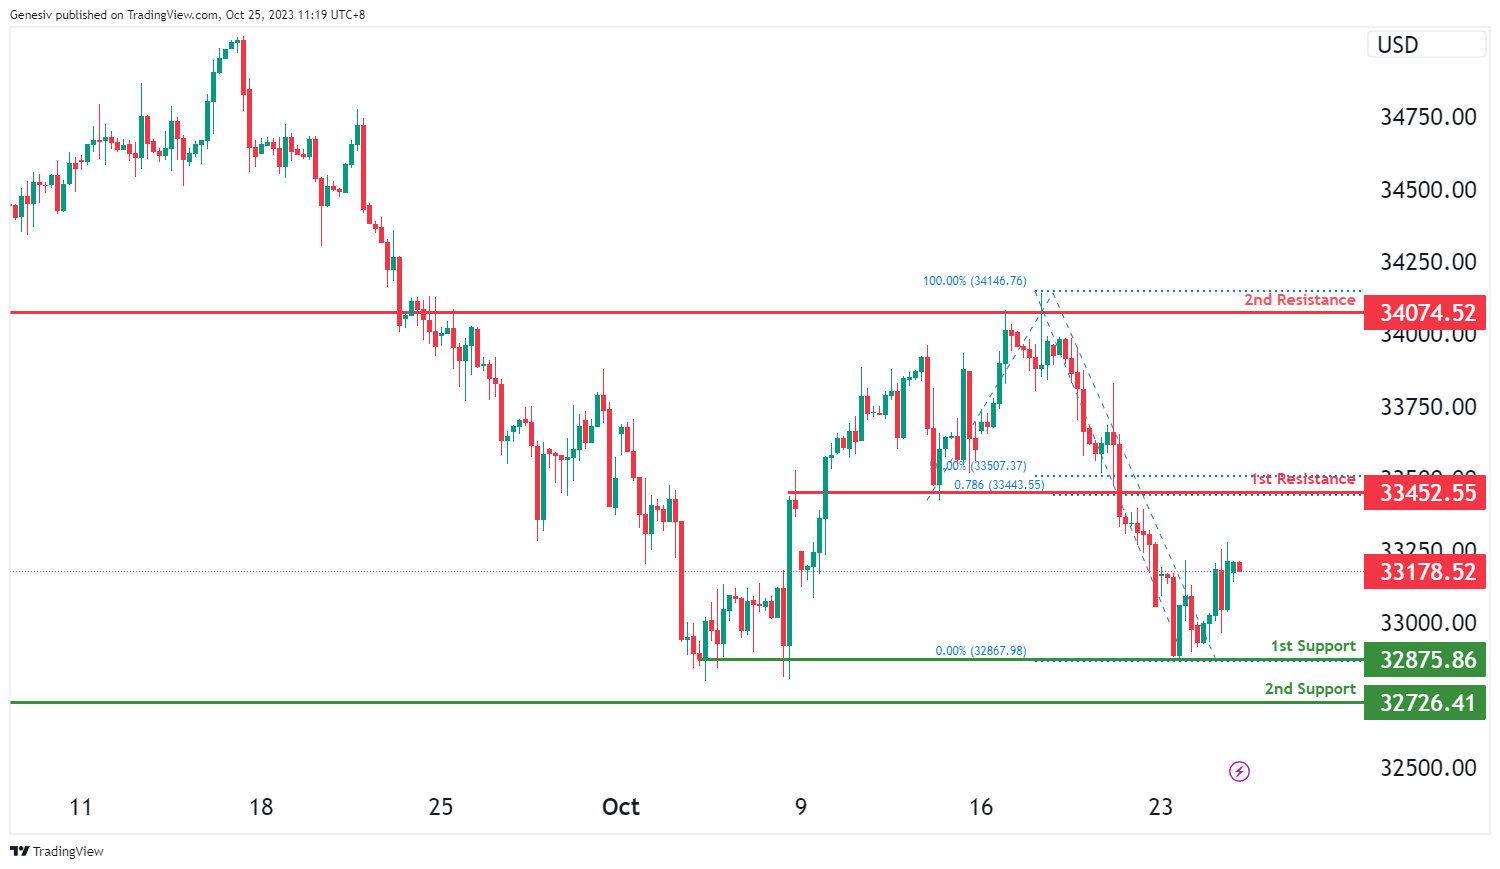
The Dow Jones (DJ30) chart currently exhibits an overall bearish momentum with price potentially making a bearish continuation towards the 1st support level.
The 1st support level at 32,875.86 is identified as a pullback support. Further below, the 2nd support level at 32,726.41 is also noted as a pullback support.
On the resistance side, the 1st resistance level at 33,452.55 is identified as an overlap resistance that aligns with a confluence of Fibonacci levels i.e.e the 50.00% retracement and the 78.60% projection levels. Higher up, the 2nd resistance level at 34,074.52 is marked as an overlap resistance.
GER40:
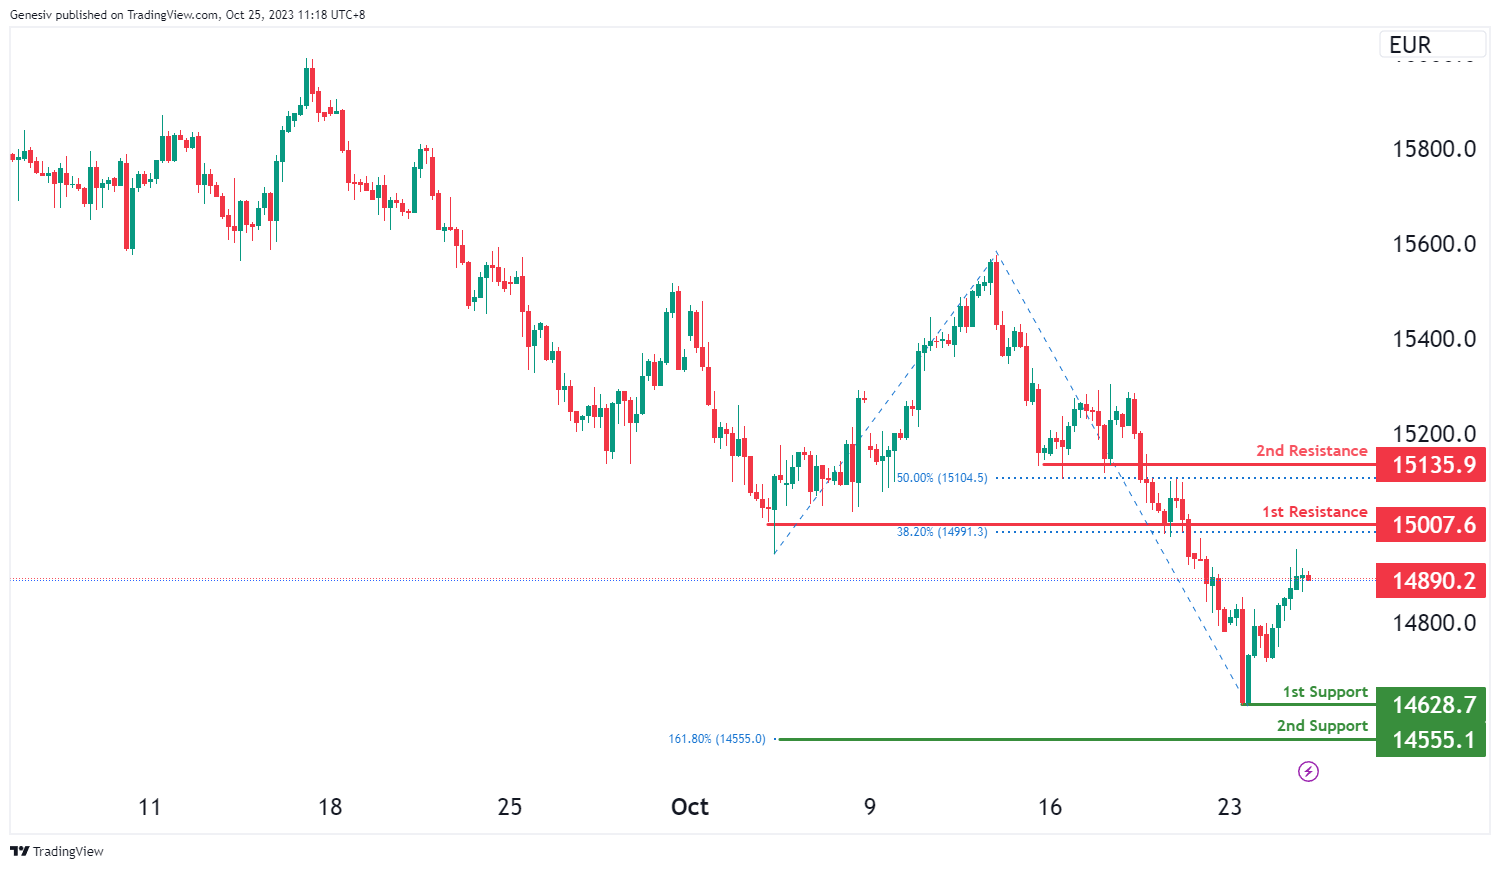
The DAX (GER40) chart currently exhibits an overall bearish momentum with price potentially making a bearish continuation towards the 1st support level.
The 1st support level at 14,628.70 is identified as a swing-low support. Further below, the 2nd support level at 14,555.10 is marked as a level that aligns with the 161.80% Fibonacci extension level.
On the resistance side, the 1st resistance level at 15,007.60 is identified as a pullback resistance that aligns with the 38.20% Fibonacci retracement level. Higher up, the 2nd resistance level at 15,135.90 is noted as a pullback resistance that aligns with the 50.00% Fibonacci retracement level.
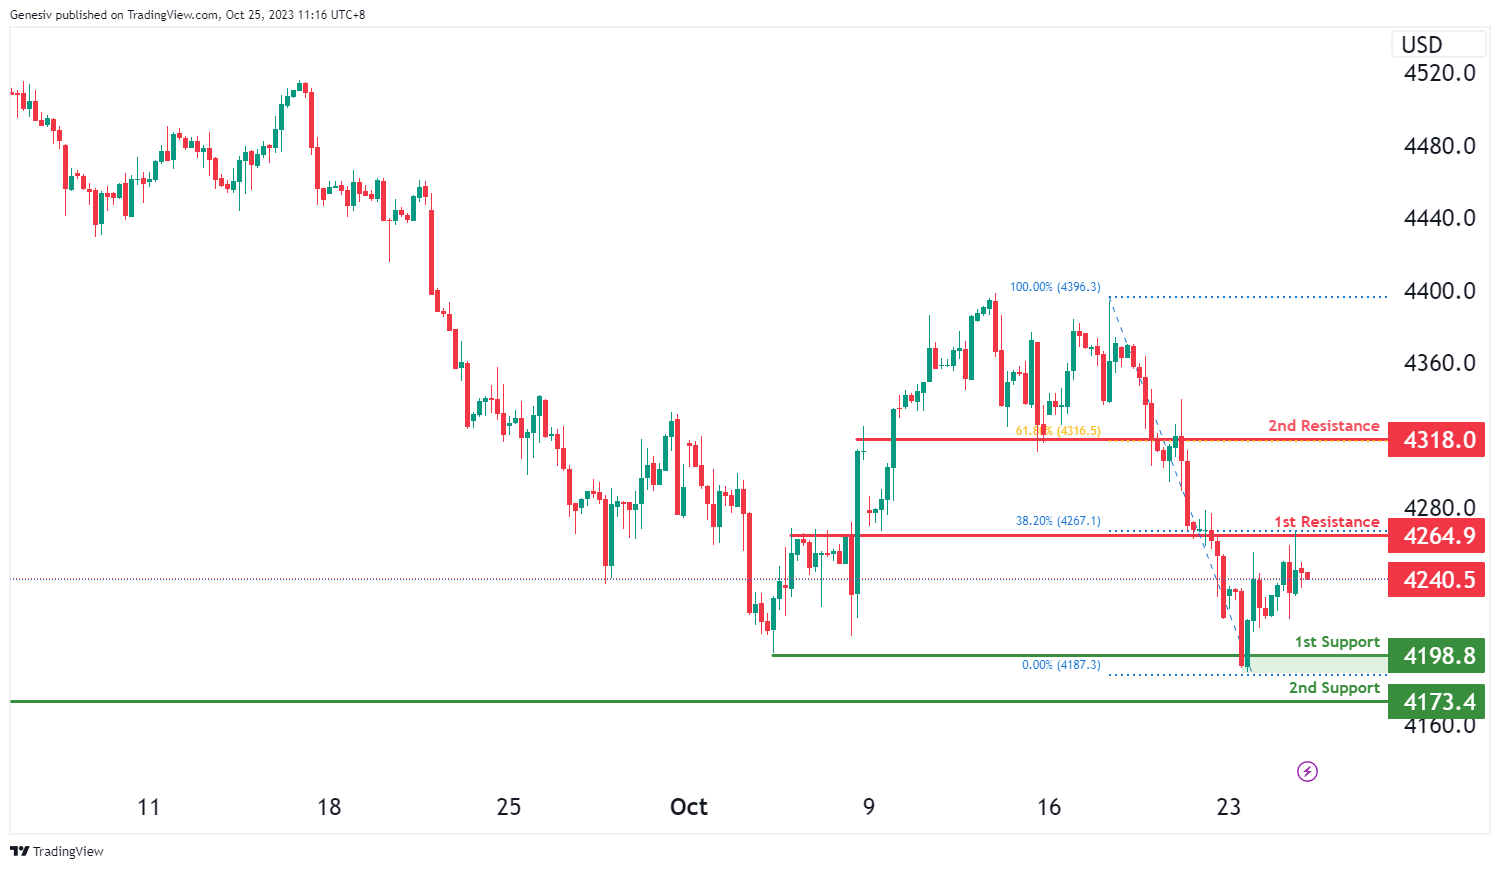
US500
The S&P 500 (US500) chart currently exhibits an overall bearish momentum with price potentially making a bearish continuation towards the 1st support level.
The 1st support level at 4,198.80 is identified as a pullback support. Further below, the 2nd support level at 4,173.40 is also marked as a pullback support.
On the resistance side, the 1st resistance level at 4,264.90 is identified as a pullback resistance that aligns with the 38.20% Fibonacci retracement level. Higher up, the 2nd resistance level at 4,318.00 is noted as an overlap resistance that aligns with the 61.80% Fibonacci retracement level.
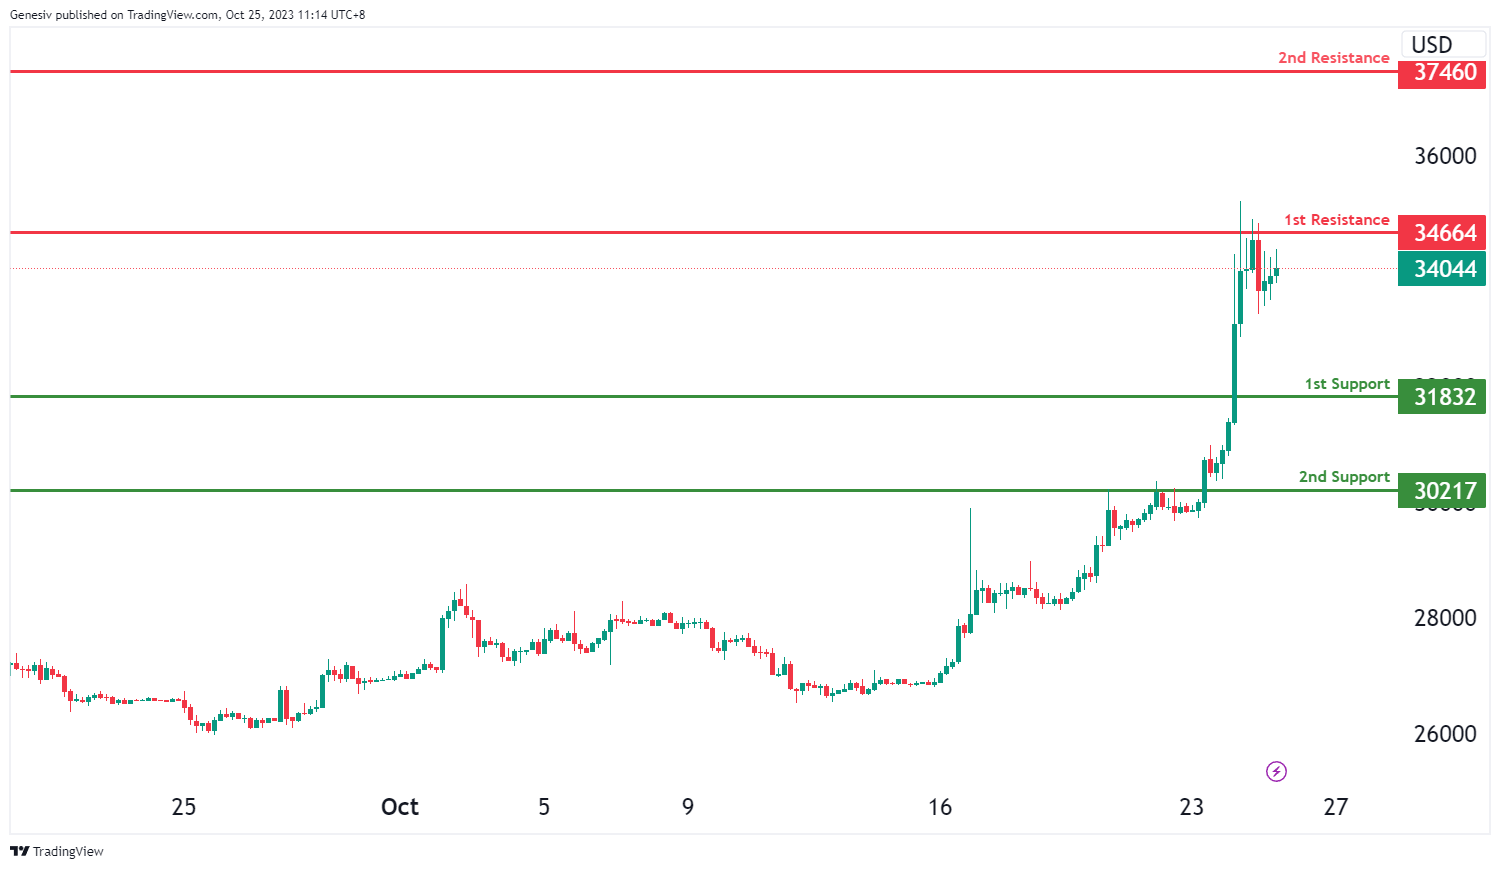
BTC/USD:
The Bitcoin (BTC/USD) chart currently exhibits an overall bullish momentum with price potentially making a bullish continuation towards the 1st resistance level.
The 1st resistance level at 34,664 is identified as an overlap resistance. Higher up, the 2nd resistance level at 37,460 is marked as a pullback resistance.
To the downside, the 1st support level at 31,832 is identified as a pullback support. Further below, the 2nd support level at 30,217 is also noted as pullback support.
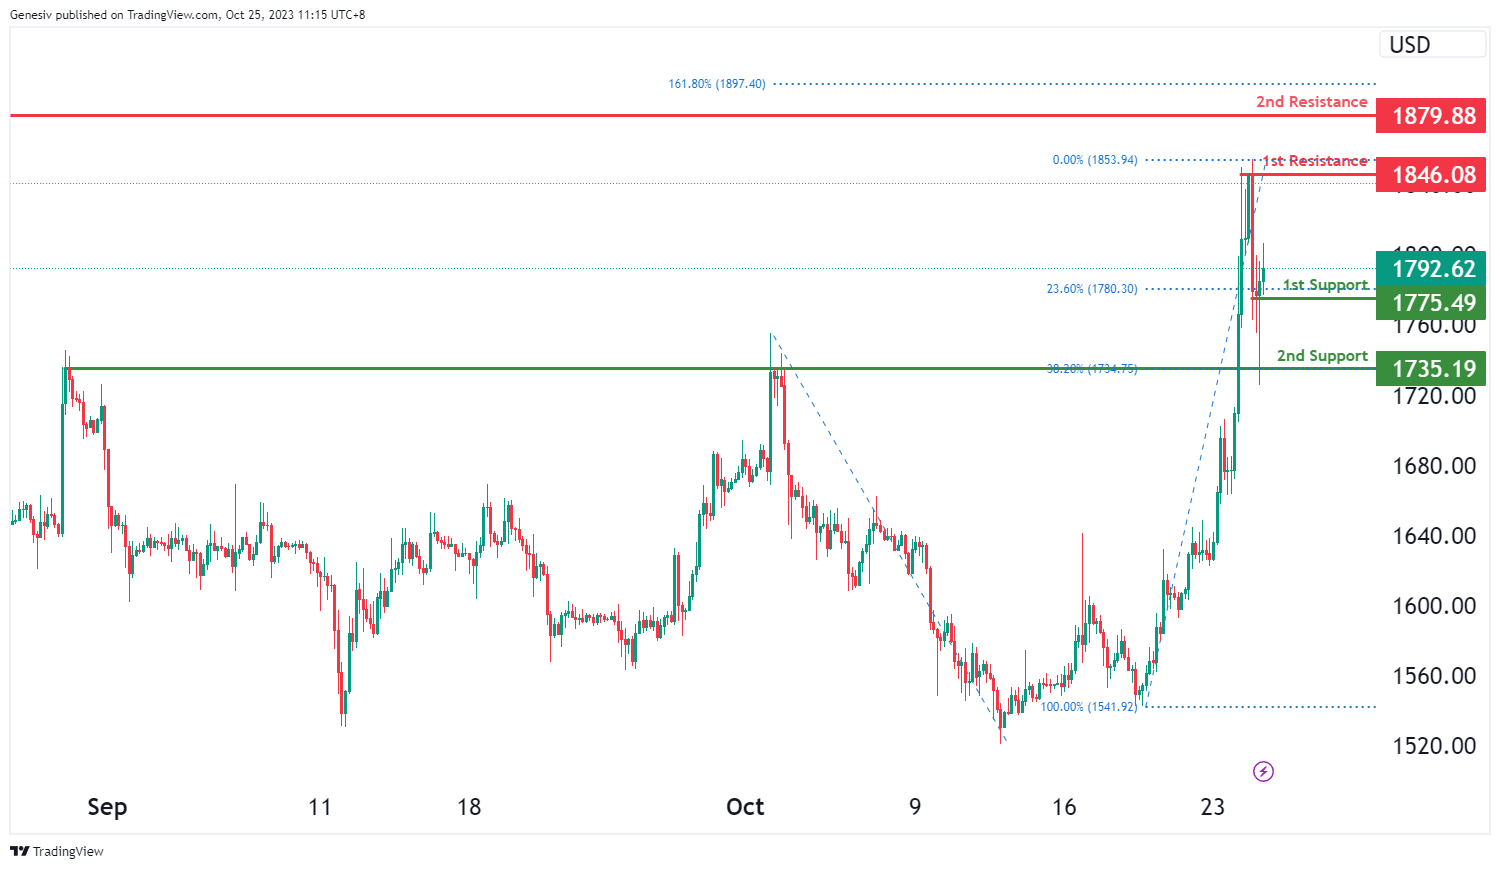
ETH/USD:
The Ethereum (ETH/USD) chart currently exhibits an overall bullish momentum with price potentially making a bullish continuation towards the 1st resistance level.
The 1st resistance level at 1,846.08 is identified as a pullback resistance. Higher up, the 2nd resistance level at 1,879.88 is also marked as a pullback resistance that aligns close to the 161.80% Fibonacci extension level.
To the downside, the 1st support level at 1,775.49 is identified as a pullback support that aligns with the 23.60% Fibonacci retracement level. Further below, the 2nd support level at 1,735.19 is also noted as pullback support that aligns with the 38.20% Fibonacci retracement level.
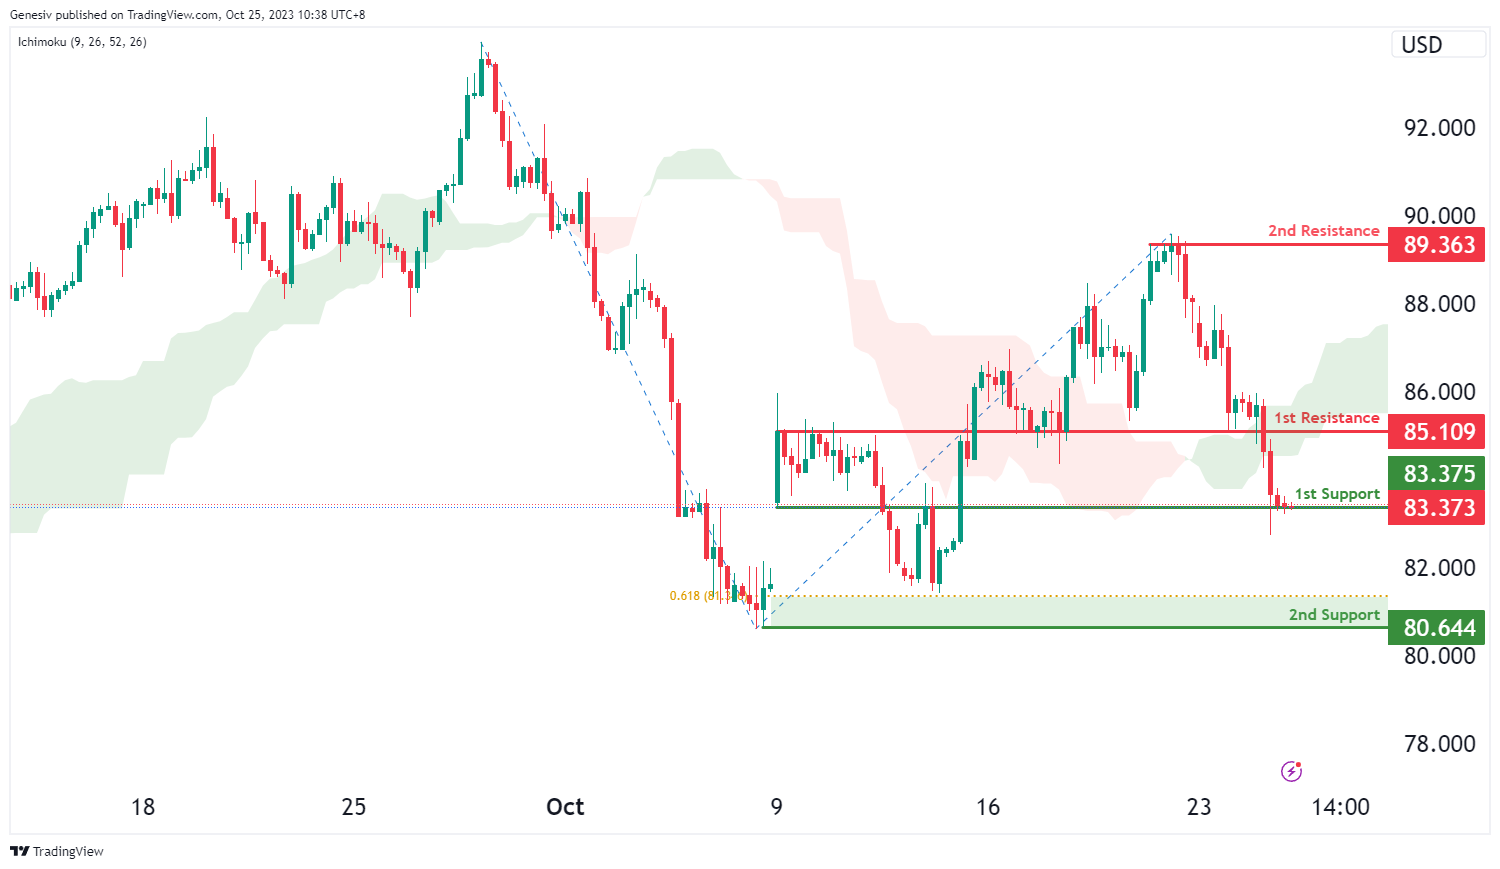
WTI/USD:
The WTI chart currently exhibits an overall bearish momentum, indicating a potential scenario for price to make a bearish continuation towards the 2nd support level should it break below the 1st support level. In addition, price has also broken below the bullish Ichimoku cloud to reinforce the bearish momentum.
The 1st support level at 83.38 is identified as an overlap support. Further below, the 2nd support level at 80.64 is also marked as a swing-low support that aligns with the 61.80% Fibonacci projection level, indicating a potential support zone.
To the upside, the 1st resistance level at 85.11 is identified as an overlap resistance. Beyond this, the 2nd resistance level at 89.36 is noted as a swing-high resistance, making it a potentially strong resistance level.
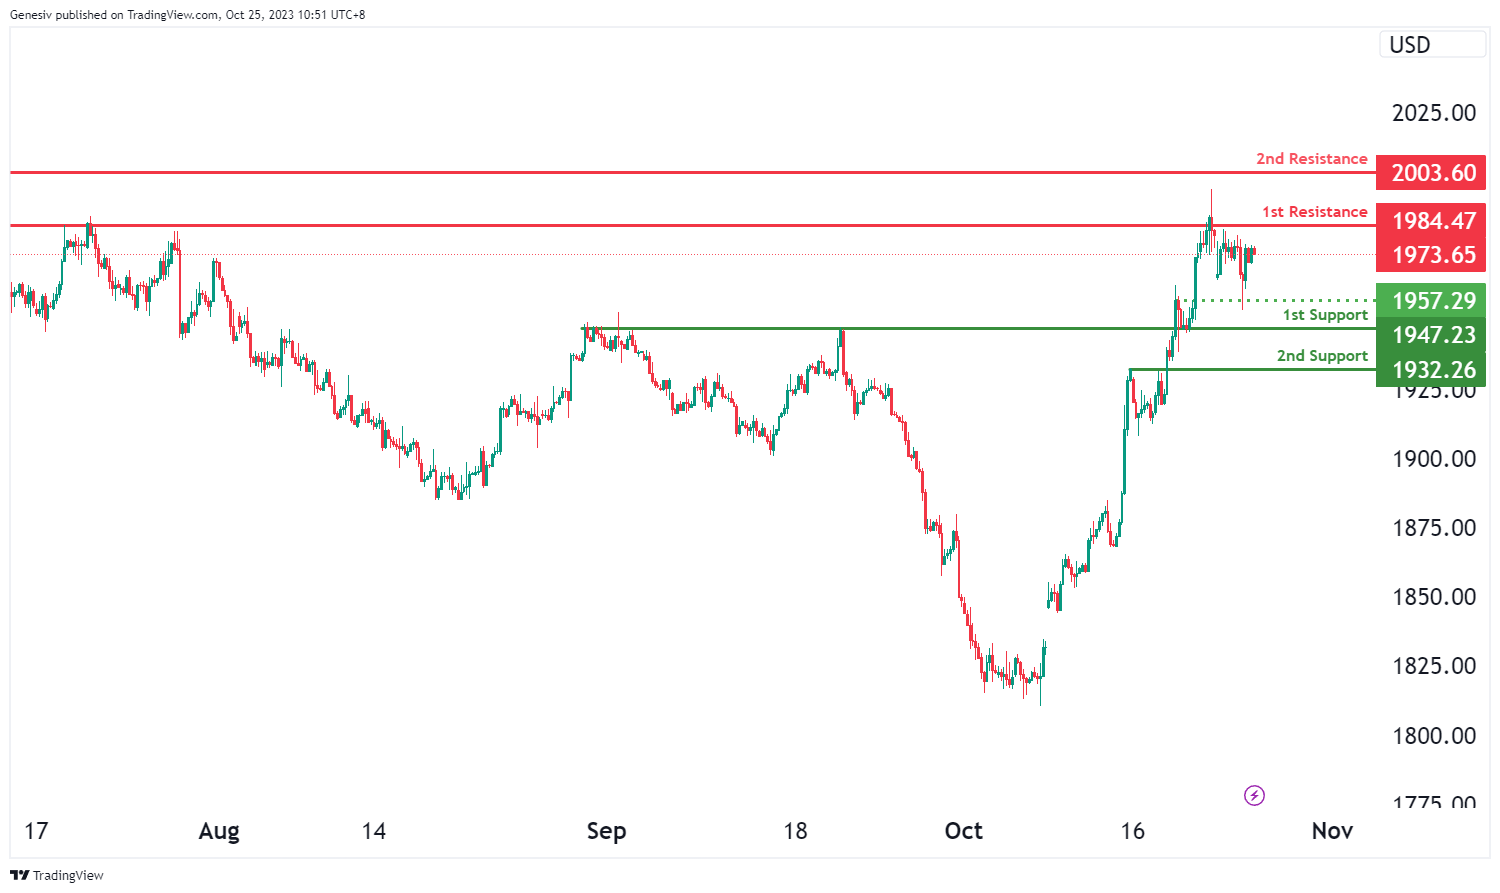
XAU/USD (GOLD):
The XAU/USD (Gold/US Dollar) chart currently demonstrates a bearish overall momentum, suggesting the potential for a bearish continuation towards the 1st support level.
The 1st support at 1947.23 is considered significant as it aligns with an overlap support level, indicating its potential to serve as a substantial area of price support. Additionally, the 2nd support at 1932.26 is identified as a pullback support, further strengthening the potential for it to act as a support level.
On the resistance side, the 1st resistance at 1984.47 is characterized as a multi-swing high resistance level, implying that it could pose a significant obstacle to any notable upward price movement. Furthermore, the 2nd resistance at 2003.60 is identified as a swing high resistance, reinforcing the potential for resistance in this region.
Additionally, there is an intermediate support at 1957.29, which aligns with an overlap support, providing an additional level of potential support for price.


