
- The ongoing rally from last Friday, 27 October low has taken on the form of an impending “bearish flag” formation.
- Coupled with a weak market breadth condition (less than 50% of Nasdaq 100 component stocks are trading above 200-day MA), the rally is likely to be a counter trend rebound within its short and medium-term downtrend phases.
- Watch the 14,590 key short-term resistance ahead of today’s FOMC decision and Apple’s earnings announcement on Thursday, 2 November.
The price actions of the US Nas 100 Index (a proxy for the Nasdaq 100 futures) have shaped the expected slide and traded close to the key 200-day moving average that was acting as a support at 13,960 as highlighted in our report.
It printed an intraday low of 14,060 last Friday, 27 October, and staged a rebound of +2.6% to hit a high of 14,430 in yesterday’s (31 October) US session ahead of key risk events; the FOMC’s monetary policy decision and Fed Chair Powell’s press conference later today followed by Apple (biggest weightage component stock in Nasdaq 100) earnings announcement on Thursday, 2 November after the close of the US session.
There are several key technical elements that suggest the current rebound seen in the Nasdaq 100 from its 27 October 2023 low is likely a counter trend rally within a medium-term downtrend phase in place since the 19 July 2023 high of 15,349.
Weak market breadth condition
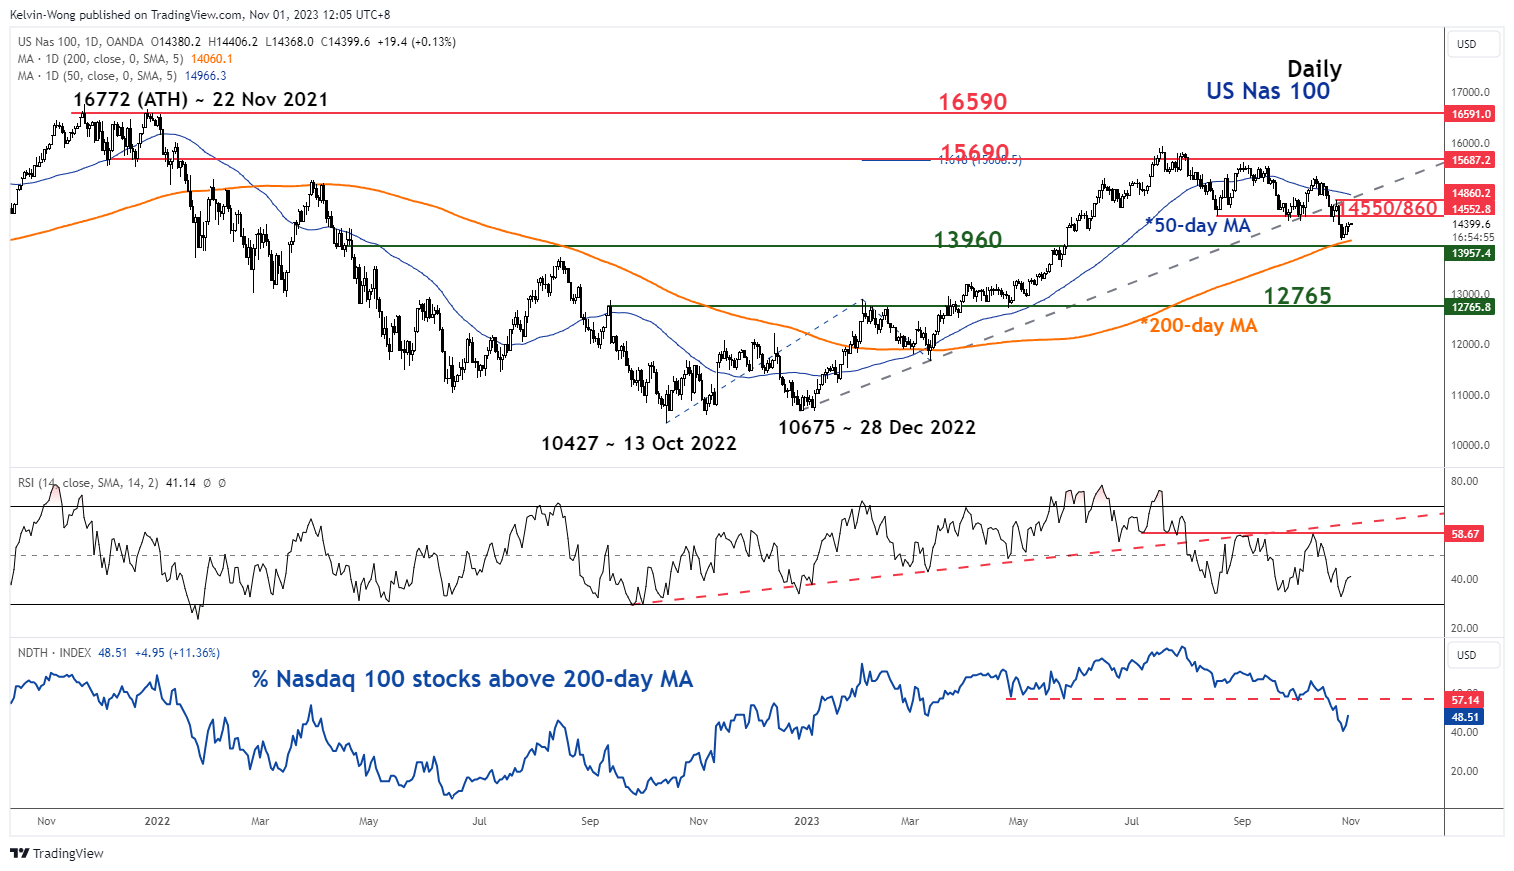
Fig 1: US Nas 100 medium-term trend as of 1 Nov 2023 (Source: TradingView, click to enlarge chart)
Even though the US Nas 100 Index is still holding above the key 200-day moving average, the number of component stocks of the Nasdaq 100 that are still above their respective 200-day moving averages has remained below 50% as of yesterday, 31 October.
A sign of a deteriorating market breadth condition. Also, the daily RSI momentum indicator is still hovering above the oversold region without any bullish divergence signal that indicates a likelihood that medium-term momentum is still bearish.
Formation of a minor “bearish flag”
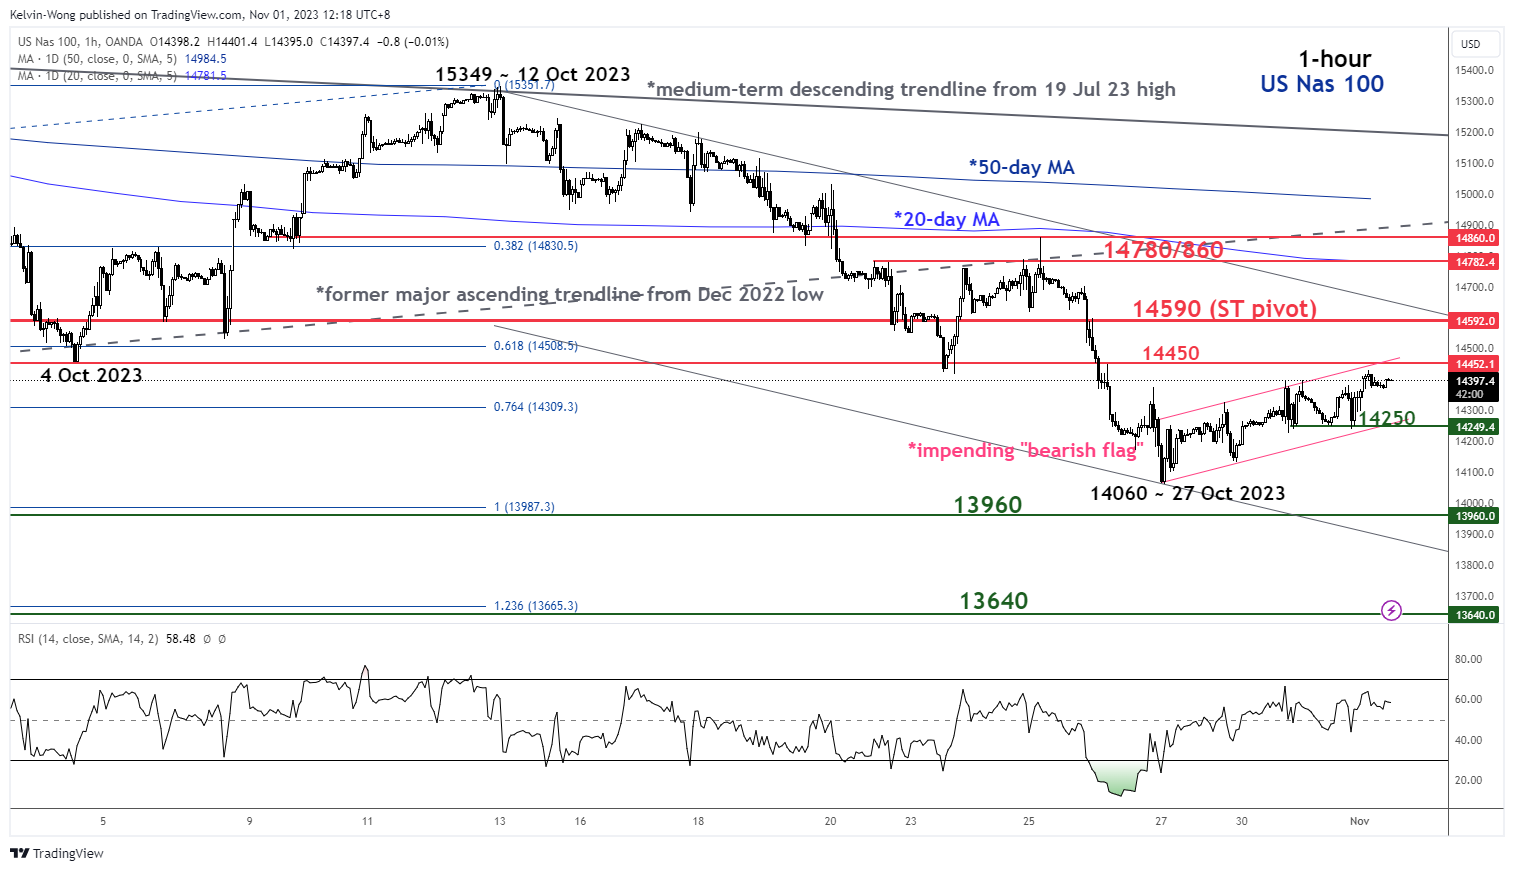
Fig 2: US Nas 100 minor short-term trend as of 1 Nov 2023 (Source: TradingView, click to enlarge chart)
In the short term as seen on the 1-hour chart, the price actions of the Index have formed an impending minor “bearish flag” configuration with its upper limit acting as a near-term resistance at 14,450.
The potential minor “bearish flag” configuration in place since the 27 October 2023 low of 14,060 suggests that it is likely that the ongoing rebound is skewed towards a corrective counter trend rebound within its short-term downtrend phase from the 12 October 2023 high.
Hence, from the lens of technical analysis, the next probable move is likely to be a potential continuation of its bearish impulsive down move sequence.
Watch the 14,590 key short-term pivotal resistance (upper boundary of the short-term descending channel from 12 October 2023 high & close to 38.2% Fibonacci retracement of the recent decline from 12 October high to 27 October 2023 low) and a break below 14,250 (lower limit of the “bearish flag) may ignite another round of decline towards the 13,960 intermediate support (around the 200-day moving average) follow by 13,640 (16/17 August 2022 swing high area & Fibonacci extension) in the first step.
On the flip side, a clearance above 14,590 invalidates the bearish scenario for an extension of the counter trend rebound towards the next intermediate resistance at 14,780/14,860 (former major ascending trendline from the December 2022 low & 20-day moving average).


 have shaped the expected slide and traded close to the key 200-day moving average that was acting as a support at 13,960 as highlighted in our report.)