
- Russell 2000’s week-to-date performance as of 9 November is the weakest among the US benchmark stock indices.
- The bearish reaction that wiped out almost 50% of last week’s gains has occurred right at a former key range support and 50-day moving average.
- Watch the 1,787 key short-term resistance.
The bearish force has started to unleash its paws again against the small-cap Russell 2000 Index where its current week-to-date loss is at -4.17% as of 10 November 2023, the worst underperformer among the US benchmark stock indices; S&P 500 (-0.25%), Nasdaq 100 (+0.59), and Dow Jones Industrial Average (-0.50%) over the same period.
Its latest key technical elements have turned bearish which indicates the start of another potential multi-week bearish impulsive sequence.
Bearish reaction from the former key range support
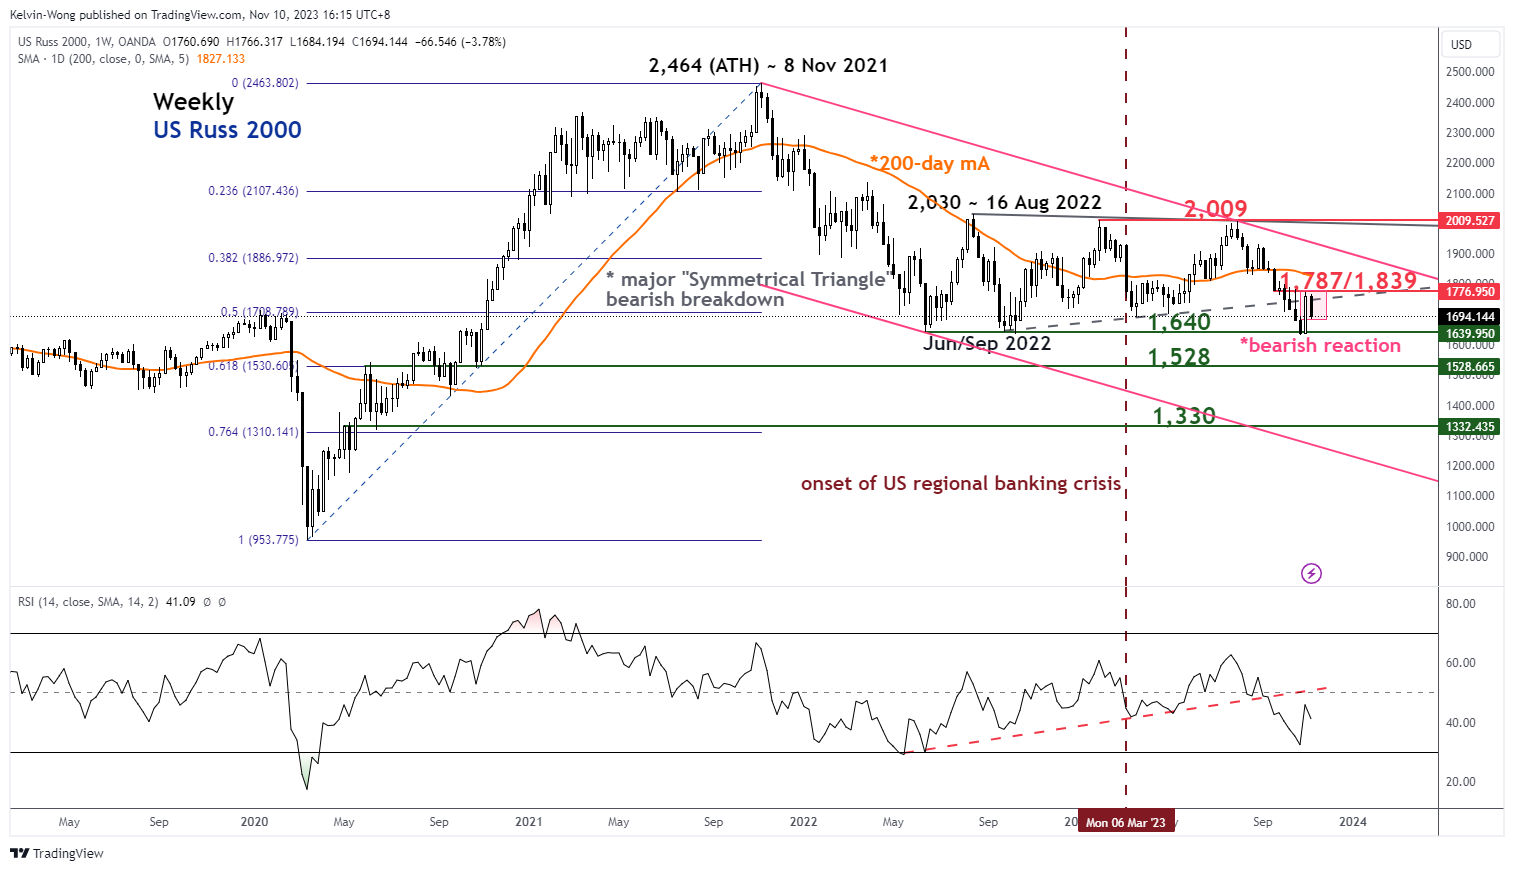
Fig 1: US Russ 2000 major trend as of 10 Nov 2023 (Source: TradingView, click to enlarge chart)
The current price actions of the US Russ 2000 Index (a proxy for the Russell 2000 futures) have almost wiped out 50% of last week’s gains induced by the dovish Fed Chair Powell’s ex-post FOMC press conference and the lacklustre US non-farm payrolls and ISM Services PMI data for October.
Interestingly, the current bout of bearish reaction has coincided with the former key “Symmetrical Triangle” range support from the June 2022 swing low now turns pull-back resistance at around 1,787.
Also, the weekly RSI momentum indicator has started to inch downward below the 50 level which indicates the potential revival of medium-term to major downside momentum.
Oscillating within a medium-term descending channel
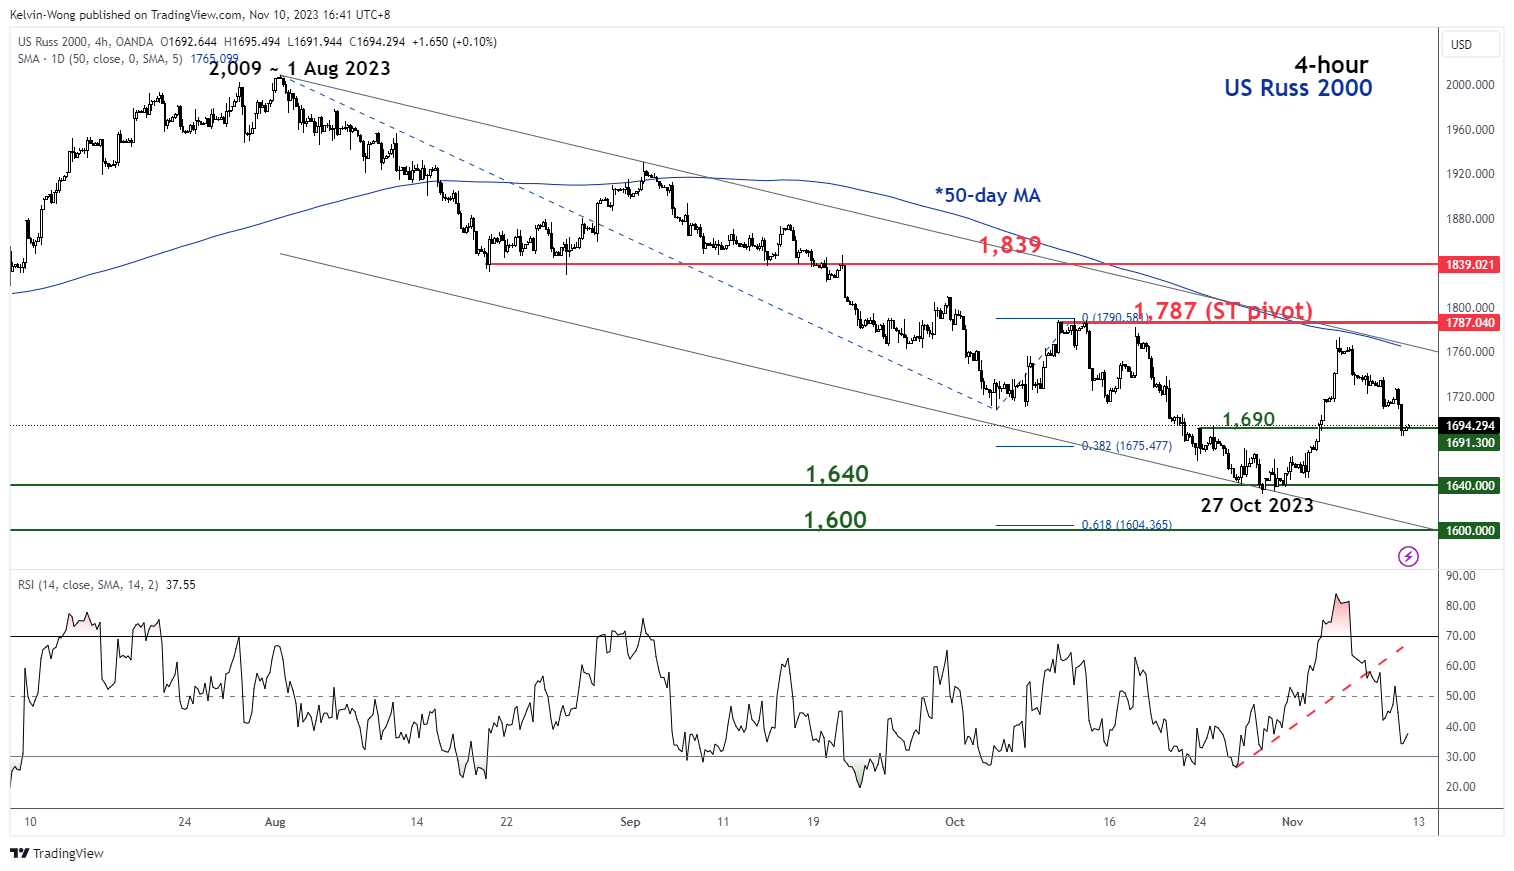
Fig 2: US Russ 2000 short-term trend as of 10 Nov 2023 (Source: TradingView, click to enlarge chart)
In the shorter time frame as seen on the 4-hour chart, the Index has continued to oscillate within a descending channel in place since 1 August 2023 where last week’s rally has been rejected right below the upper boundary of the descending channel and its downward sloping 50-day moving average.
All in all, these observations suggest that the odds are skewed towards the continuation of its short to medium-term downtrend phases of the Index rather than the start of a medium-term bullish reversal.
Watch the 1,787 key short-term pivotal resistance and a breakdown below its 1,690 near-term support may accelerate a further potential down move towards the next immediate supports at 1,640 and 1,600 (also the lower boundary of the descending channel & a Fibonacci extension level) in the first step.
On the other hand, a clearance above 1,787 negates the bearish tone for an extension of the corrective countertrend rebound to see the next intermediate resistance coming in at 1,839 (also the key 200-day moving average).


