
In this technical article we’re going to take a look at the Elliott Wave charts charts of Dollar Index published in members area of the website. As our members know USDX has ended cycle from the 99.5 low as 5 waves structure. We were calling cycle completed at the 107.34 peak. Recently Dollar has reached extreme zone, equal legs area from the 107.34 peak and completed the short term cycle as Elliott Wave Flat.
Before we take a look at the real market example of Expanded Flat, let’s explain the pattern in a few words.
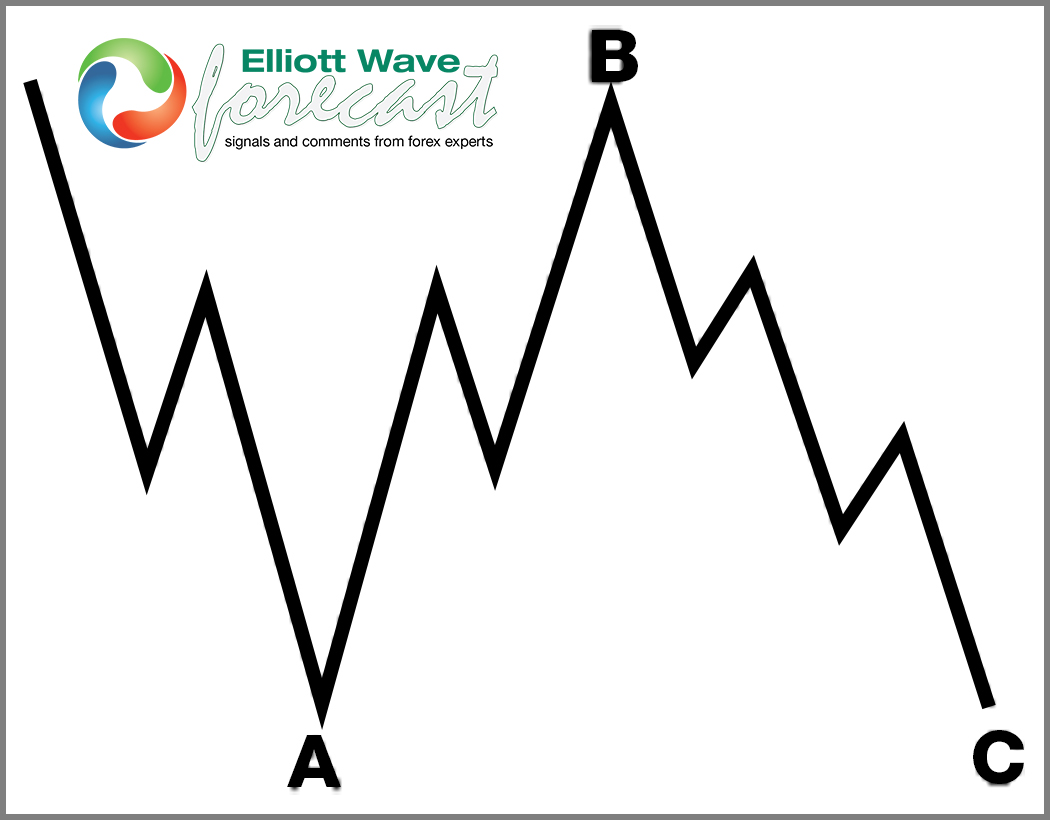
Elliott Wave Expanded Flat Theory
Elliott Wave Flat is a 3 wave corrective pattern. Inner subdivision is labeled as A,B,C , with inner 3,3,5 structure. Waves A and B have forms of corrective structures like zigzag, flat, double three or triple three. Third wave C is always 5 waves structure, either motive impulse or ending diagonal pattern. It’s important to notice that in Irregular Flat Pattern wave B completes below the starting point of wave A. Wave C ends above the ending point of wave A . Wave C of Flat completes usually between 1.00 to 1.236 Fibonacci extension of A related to B, but sometimes it could go up to 1.618 fibs ext.
At the graphic below, we can see what Expanded Flat structure looks like
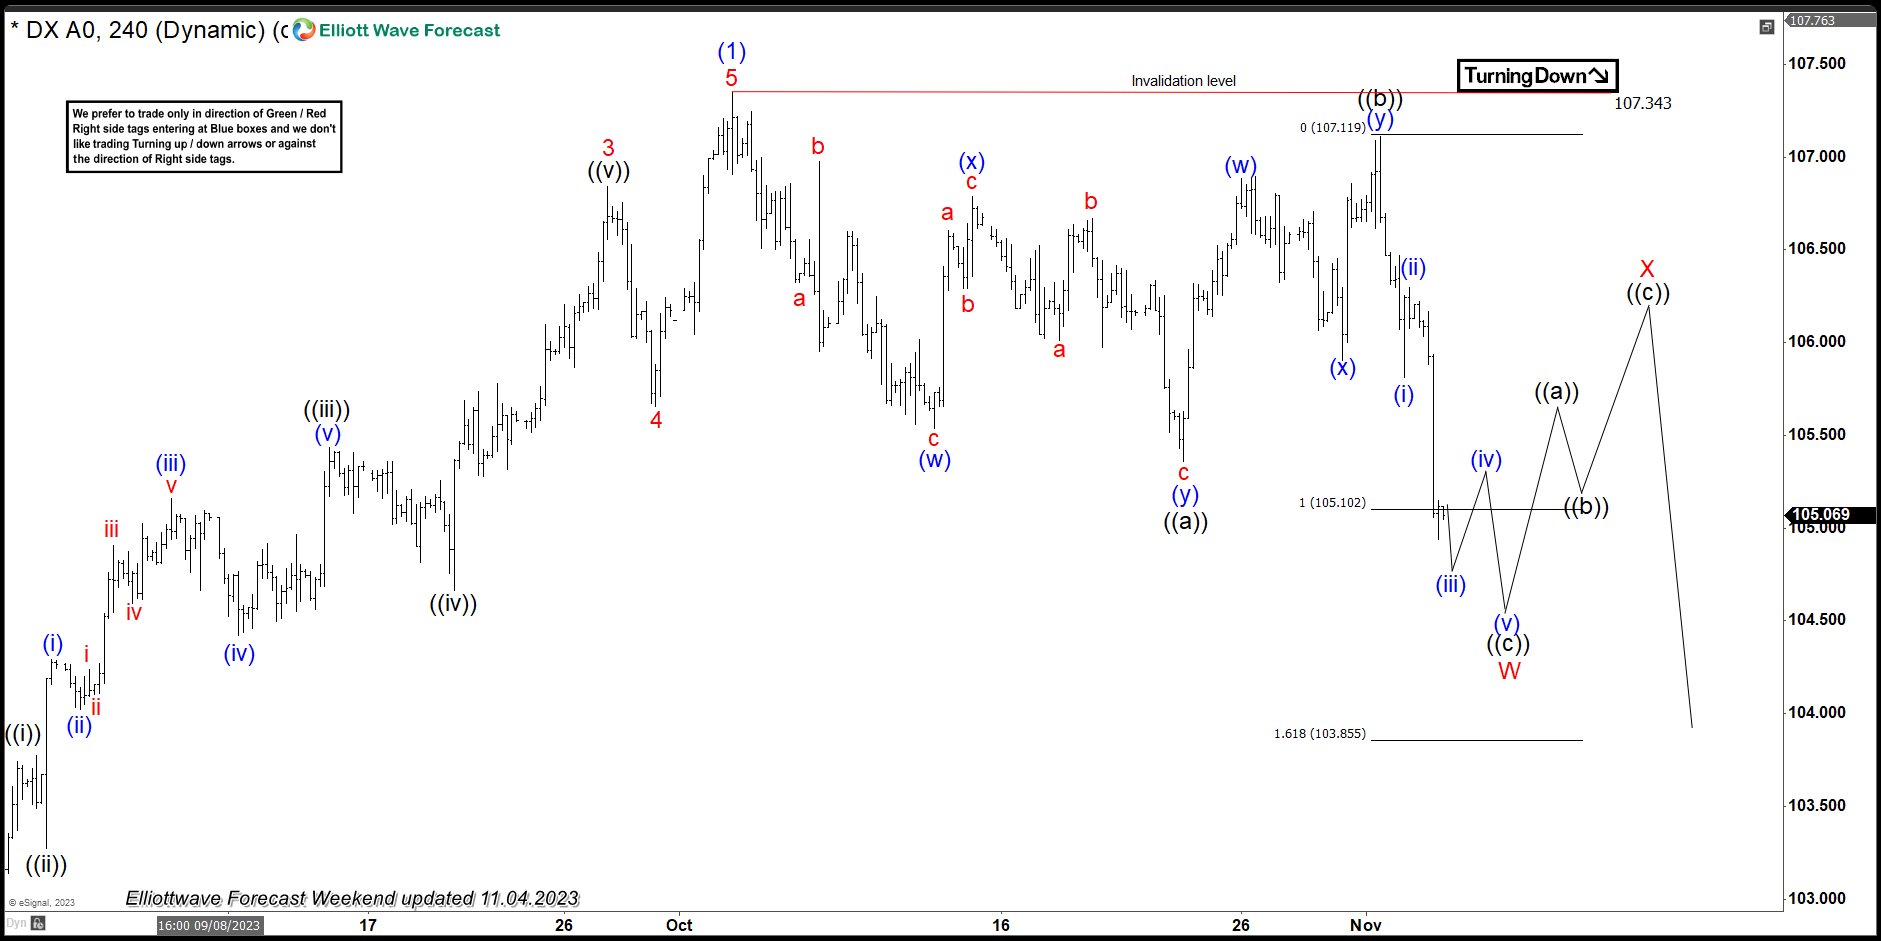
USDX Elliott Wave h4 Chart 11.04.2023
Elliott wave view suggests cycle from the 107.34 peak is unfolding as Flat Pattern. We can notice that inner subdivisions of ((a)) and ((b)) black are having corrective sequences. . Wave ((c)) leg should ideally complete as 5 waves soon. Extreme zone, equal legs is already reached at 105.1 area. We expect to see short term bounce in (iv) and another leg down to complete 5 waves in ((c)) wave. We expect Dollar to complete cycle from the peak at 105.1-103.85 area as Flat Pattern. That zone should find buyers for a 3 waves bounce X red.
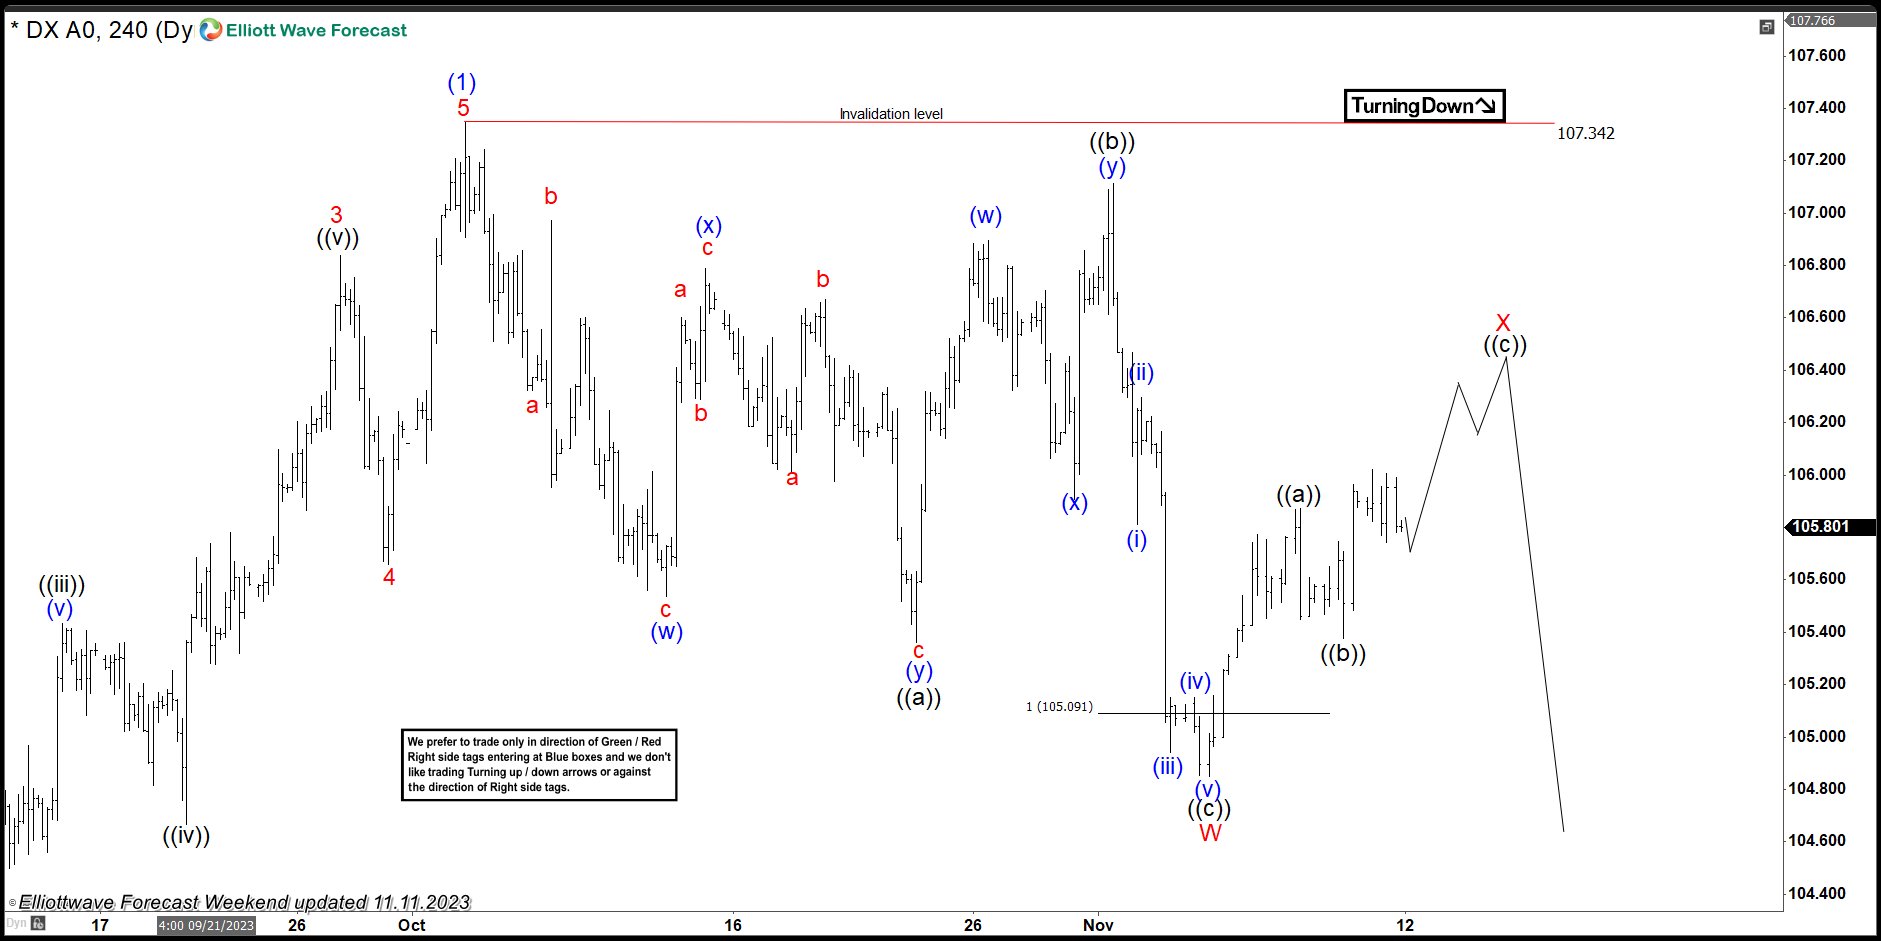
USDX Elliott Wave h4 Chart 11.11.2023
Dollar index made 5 waves down in ((c)) leg and completed Flat Pattern at 104.85 low. Current view suggests we are in X red connector. The price structure shows higher high sequences from the 104.85 low, suggesting we are potentially still in ((c)) of X that can see approximately 106.4-106.6 area.


