
DXY:
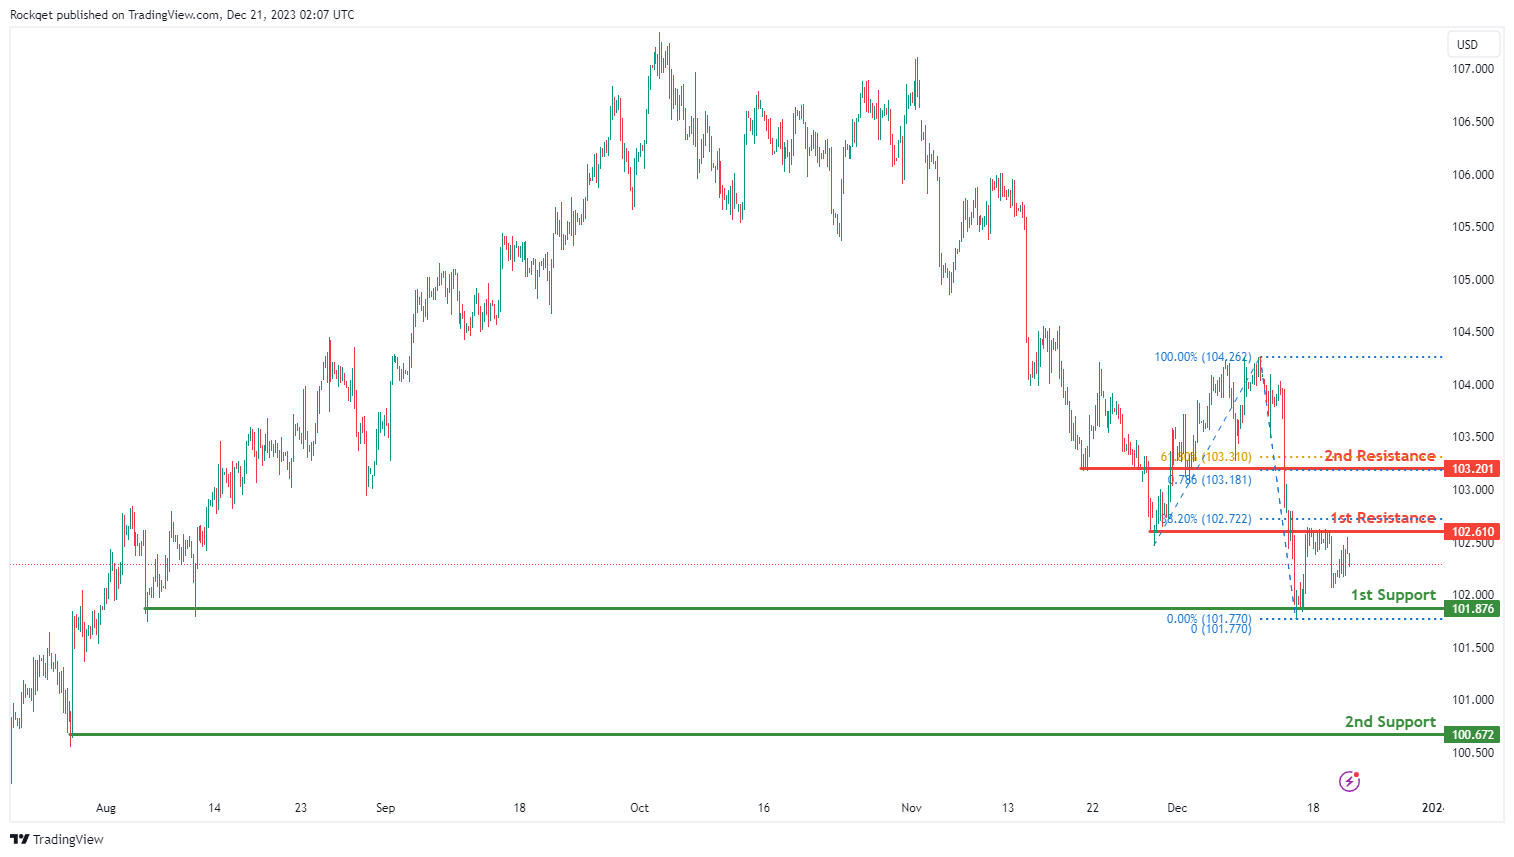
The DXY (US Dollar Index) chart currently shows an overall bearish momentum, indicating a potential for price to make a bearish continuation towards the 1st support.
The 1st support level at 101.87 is identified as a multi-swing-low support. Further below, the 2nd support level at 100.67 is noted as a swing-low support, further reinforcing its importance as a potential key support level.
To the upside, the 1st resistance level at 102.61 is identified as an overlap resistance that aligns close to the 38.20% Fibonacci retracement level. Higher up, the 2nd resistance level at 103.20 is also marked as an overlap resistance that aligns with a confluence of Fibonacci levels i.e. the 61.80% retracement and the 78.60% projection levels, suggesting a potential barrier for further upside movement.
EUR/USD:
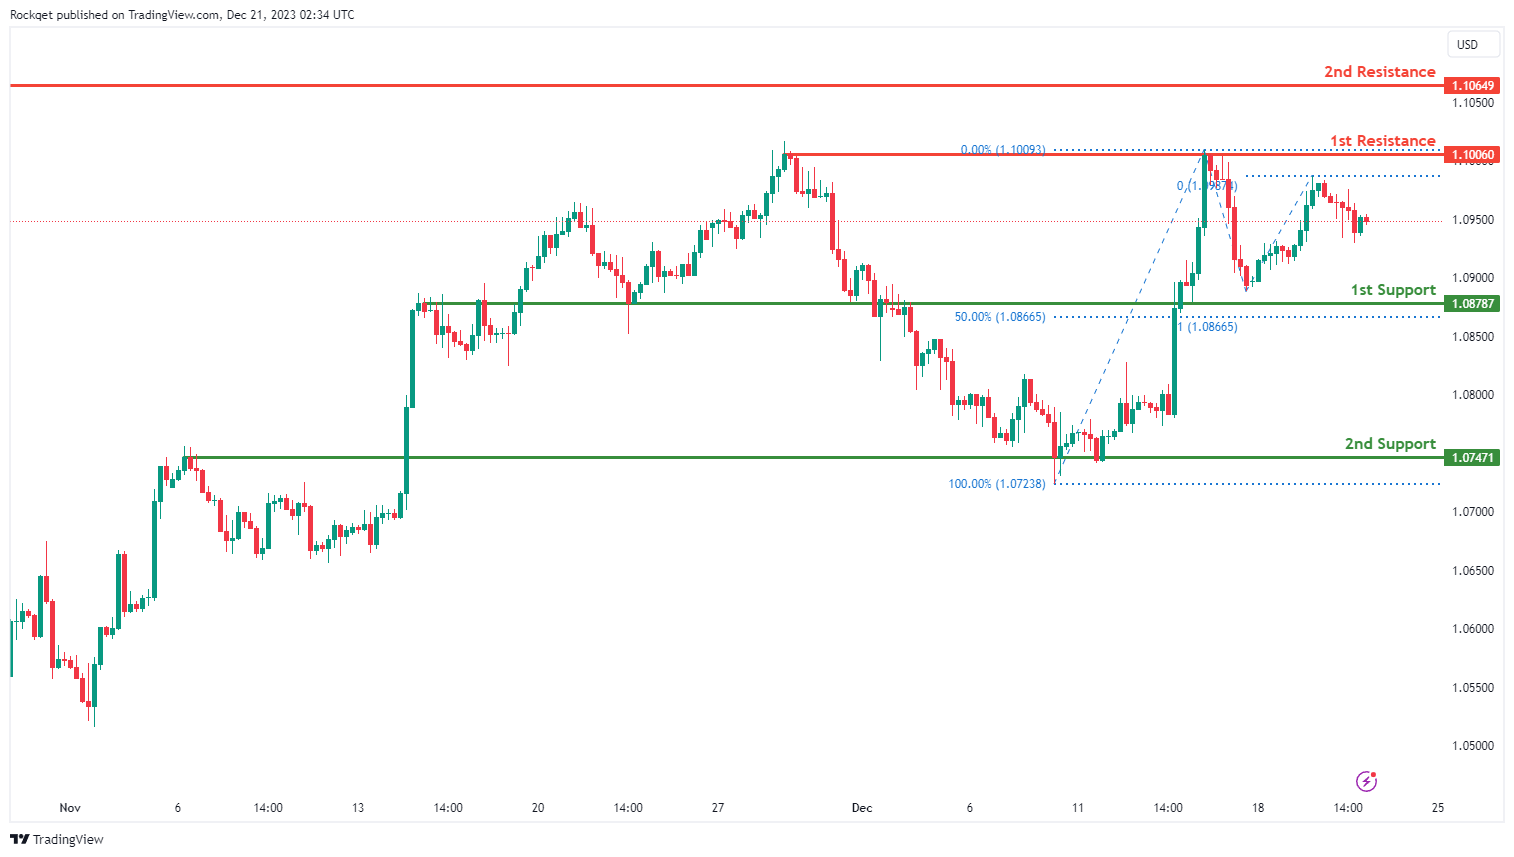
The EUR/USD chart currently exhibits an overall bullish momentum. In this context, there is a potential scenario for price to make a bullish continuation towards the 1st resistance.
The 1st resistance level at 1.1006 is identified as a multi-swing-high resistance. Higher up, the 2nd resistance level at 1.1064 is noted as a swing-high resistance, suggesting a potential barrier for further upside movement.
To the downside, the 1st support level at 1.0878 is identified as an overlap support that aligns close to the 50.00% Fibonacci retracement level. Further below, the 2nd support level at 1.0747 is also marked as an overlap support, further reinforcing its importance as a potential key support level.
EUR/JPY:
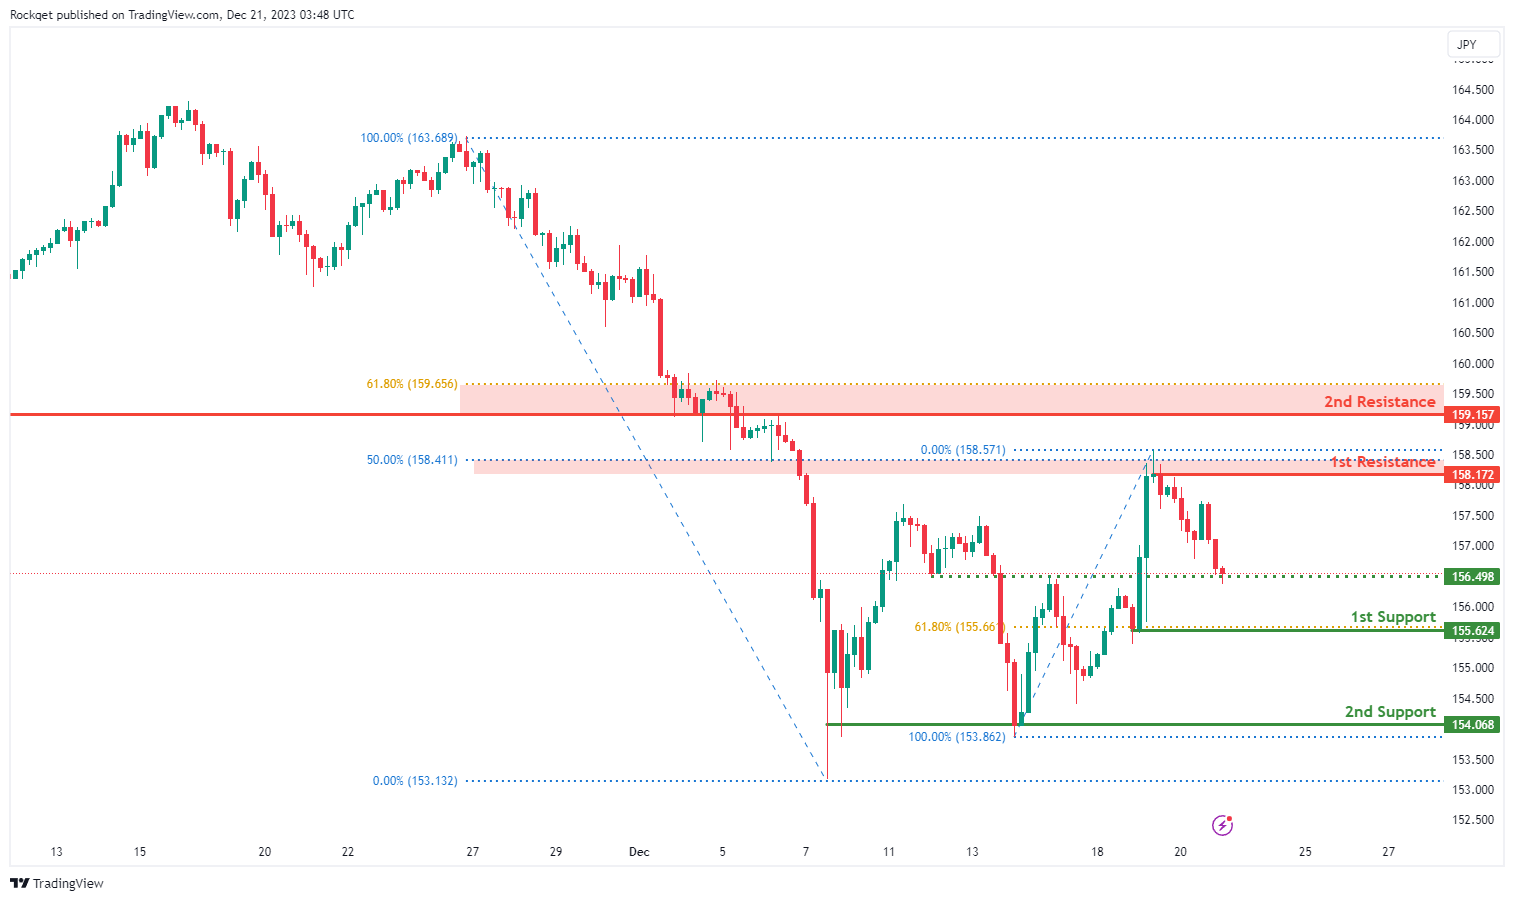
The EUR/JPY chart currently exhibits a bearish overall momentum, suggesting a potential scenario for a bearish continuation towards the 1st support.
he 1st support at 155.62 is deemed significant as it is identified as a pullback support and aligns with the 61.80% Fibonacci Retracement level. This level represents a historical area where buying interest has been present, reinforcing its significance as a key support zone.
Additionally, the 2nd support at 154.07 is considered a multi-swing low support, providing an additional layer of potential support for the currency pair.
On the resistance side, the 1st resistance at 158.17 is associated with a pullback resistance and the 50% Fibonacci Retracement, indicating a level where selling interest could intensify, potentially causing a temporary pause or reversal in the bearish trend.
Furthermore, the 2nd resistance at 159.16 is linked to an overlap resistance and the 61.80% Fibonacci Retracement, presenting a potential challenge for the price to surpass these levels.
EUR/GBP:
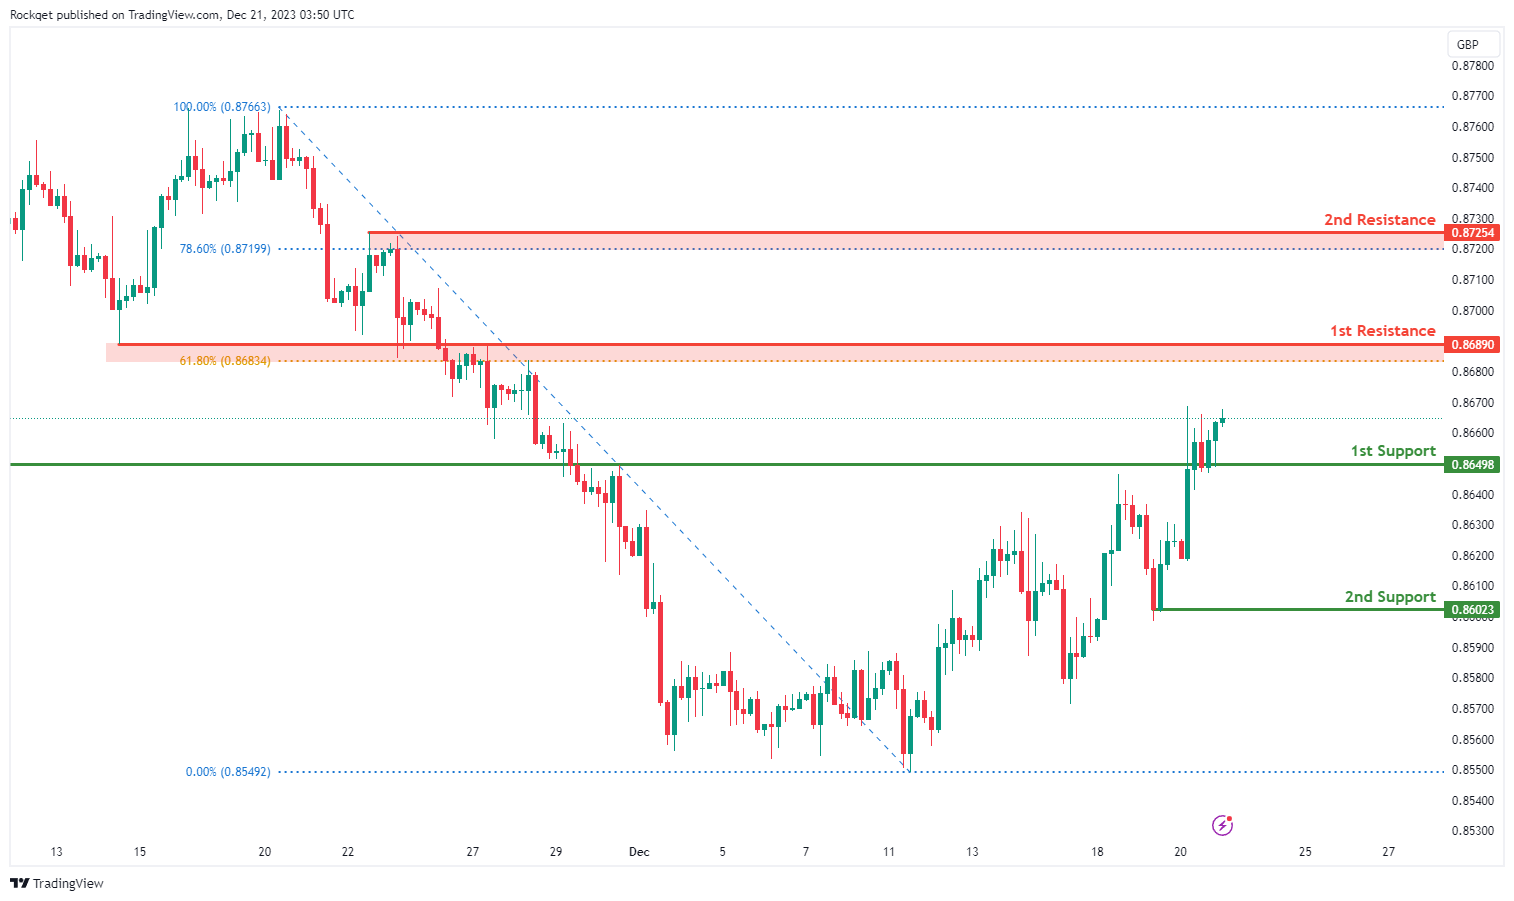
The EUR/GBP chart currently exhibits a bullish overall momentum, indicating a potential scenario for a bullish continuation towards the 1st resistance.
The 1st support at 0.8650 is considered significant as it represents an overlap support. This level indicates a historical area where buying interest has been present, reinforcing its potential as a crucial support zone.
Additionally, the 2nd support at 0.8602 is identified as a pullback support, providing an extra layer of potential support for the currency pair.
On the resistance side, the 1st resistance at 0.8689 is associated with an overlap resistance and the 61.80% Fibonacci Retracement. This level may act as a barrier where selling interest could intensify, potentially causing a temporary pause or reversal in the bullish trend.
Furthermore, the 2nd resistance at 0.8725 is linked to a pullback resistance and the 78.60% Fibonacci Retracement, presenting an additional challenge for the price to surpass these levels.
GBP/USD:
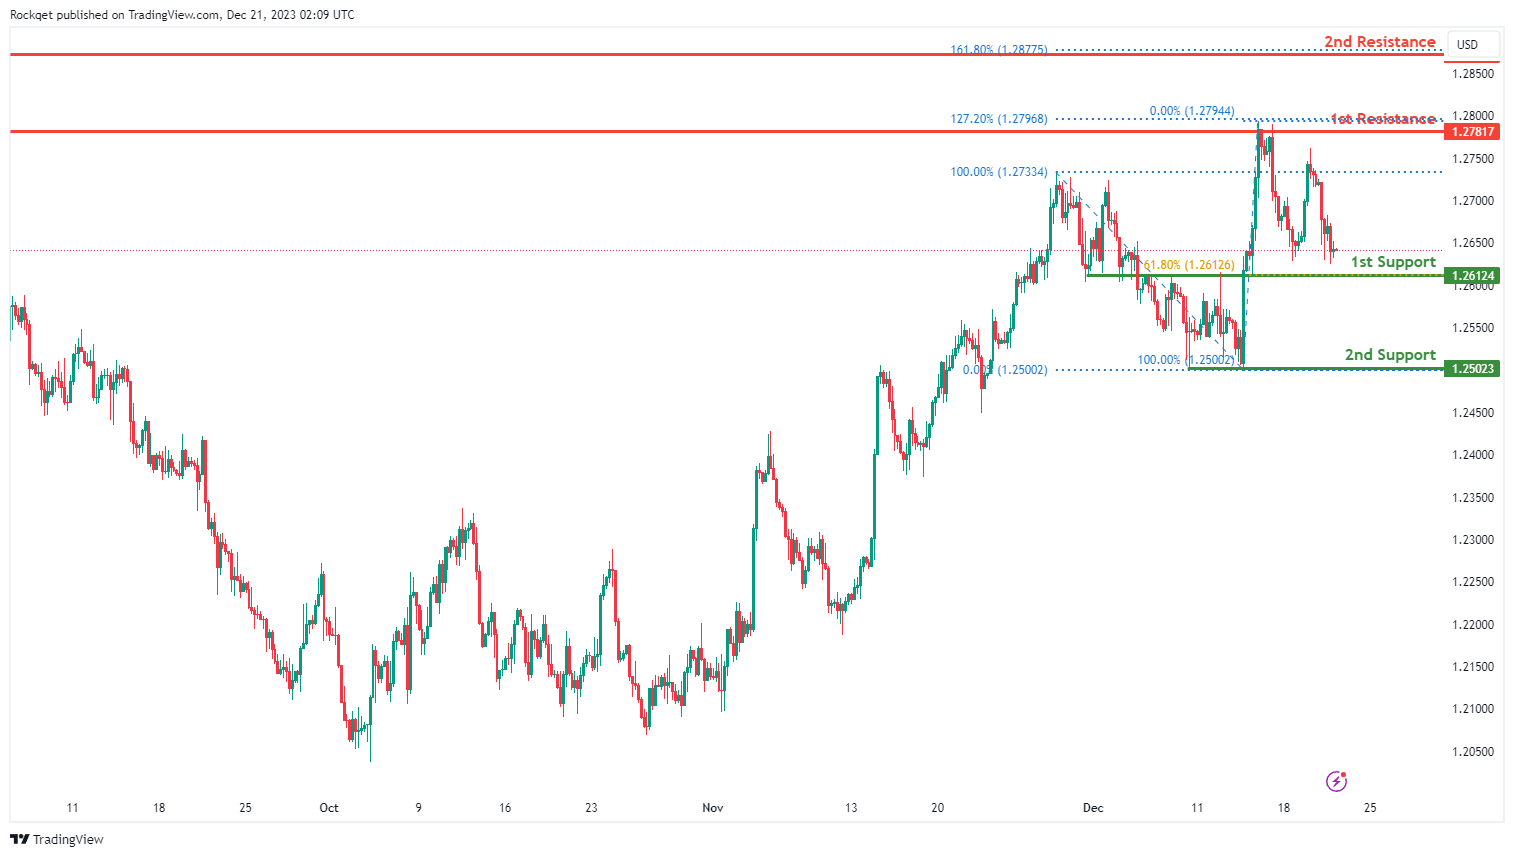
The GBP/USD chart currently exhibits an overall bearish momentum. In this context, there is a potential scenario for price to make a bearish continuation towards the 1st support.
The 1st support level at 1.2612 is identified as an overlap support that aligns with the 61.80% Fibonacci retracement level. Further below, the 2nd support level at 1.2502 is marked as a swing-low support, further reinforcing its importance as a potential key support level.
To the upside, the 1st resistance level at 1.2781 is identified as a multi-swing-high resistance that aligns with the 127.20% Fibonacci extension level. Higher up, the 2nd resistance level at 1.2872 is noted as a pullback resistance that aligns with the 161.80% Fibonacci extension level, suggesting a potential barrier for further upside movement.
GBP/JPY:
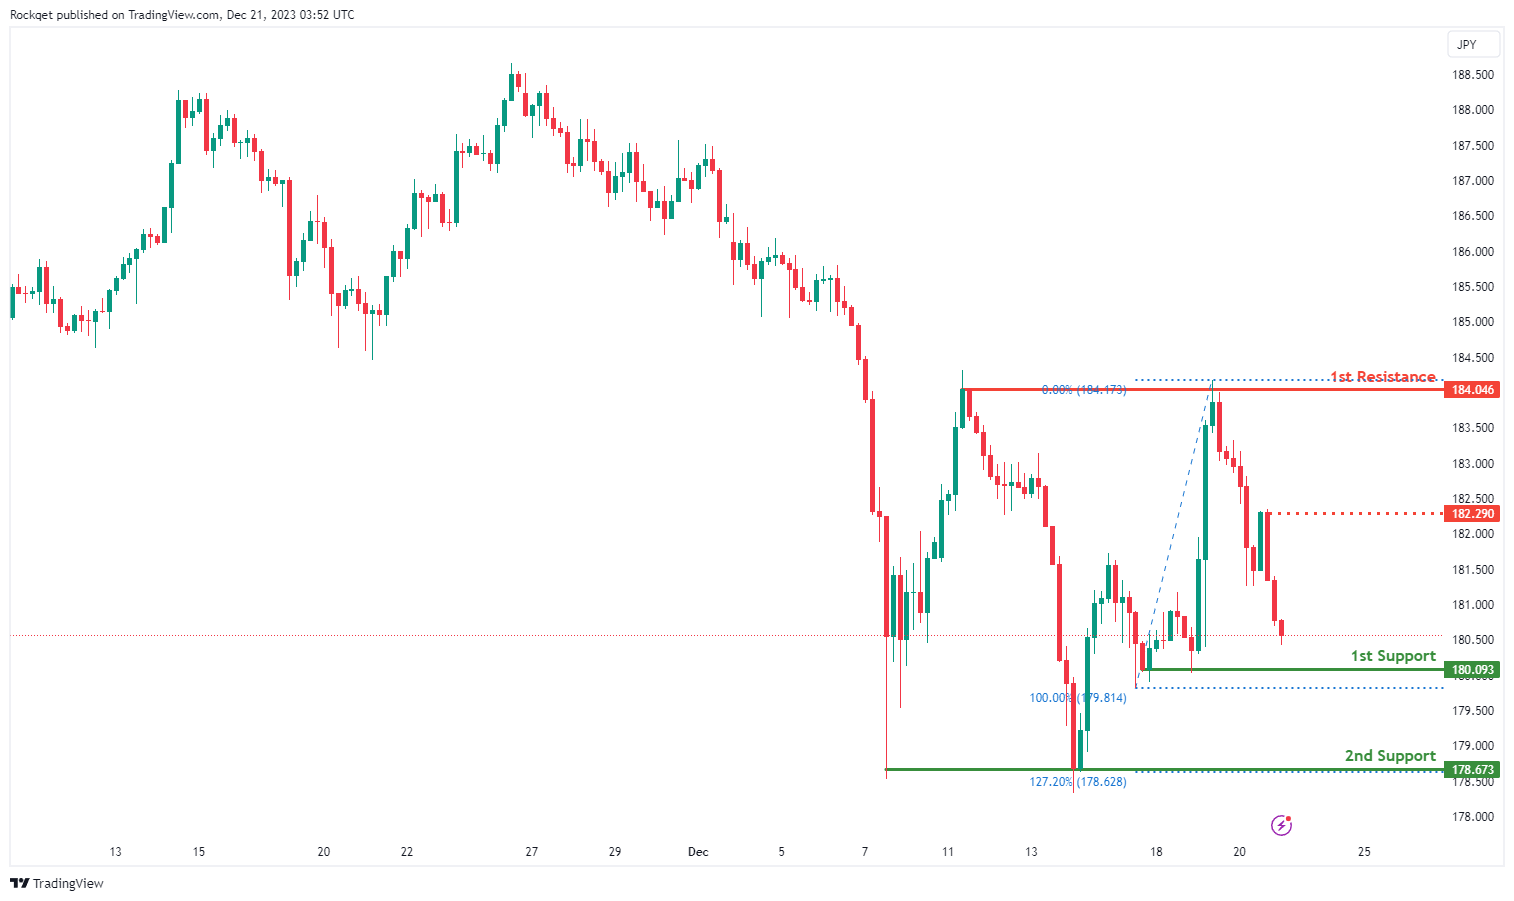
The GBP/JPY chart currently exhibits a bearish overall momentum, suggesting a potential scenario for a bearish continuation towards the 1st support.
The 1st support at 180.09 is considered significant as it represents a pullback support. This level indicates a historical area where buying interest has been present, reinforcing its potential as a crucial support zone.
Additionally, the 2nd support at 178.67 is identified as a multi-swing low support and is associated with the 127.20% Fibonacci Extension, providing an additional layer of potential support for the currency pair.
On the resistance side, the intermediate resistance at 182.29 is linked to a pullback resistance. This level may act as a barrier where selling interest could intensify, potentially causing a temporary pause or reversal in the bearish trend.
Furthermore, the 1st resistance at 184.05 is associated with a multi-swing high resistance, presenting an additional challenge for the price to surpass these levels.
USD/CHF:
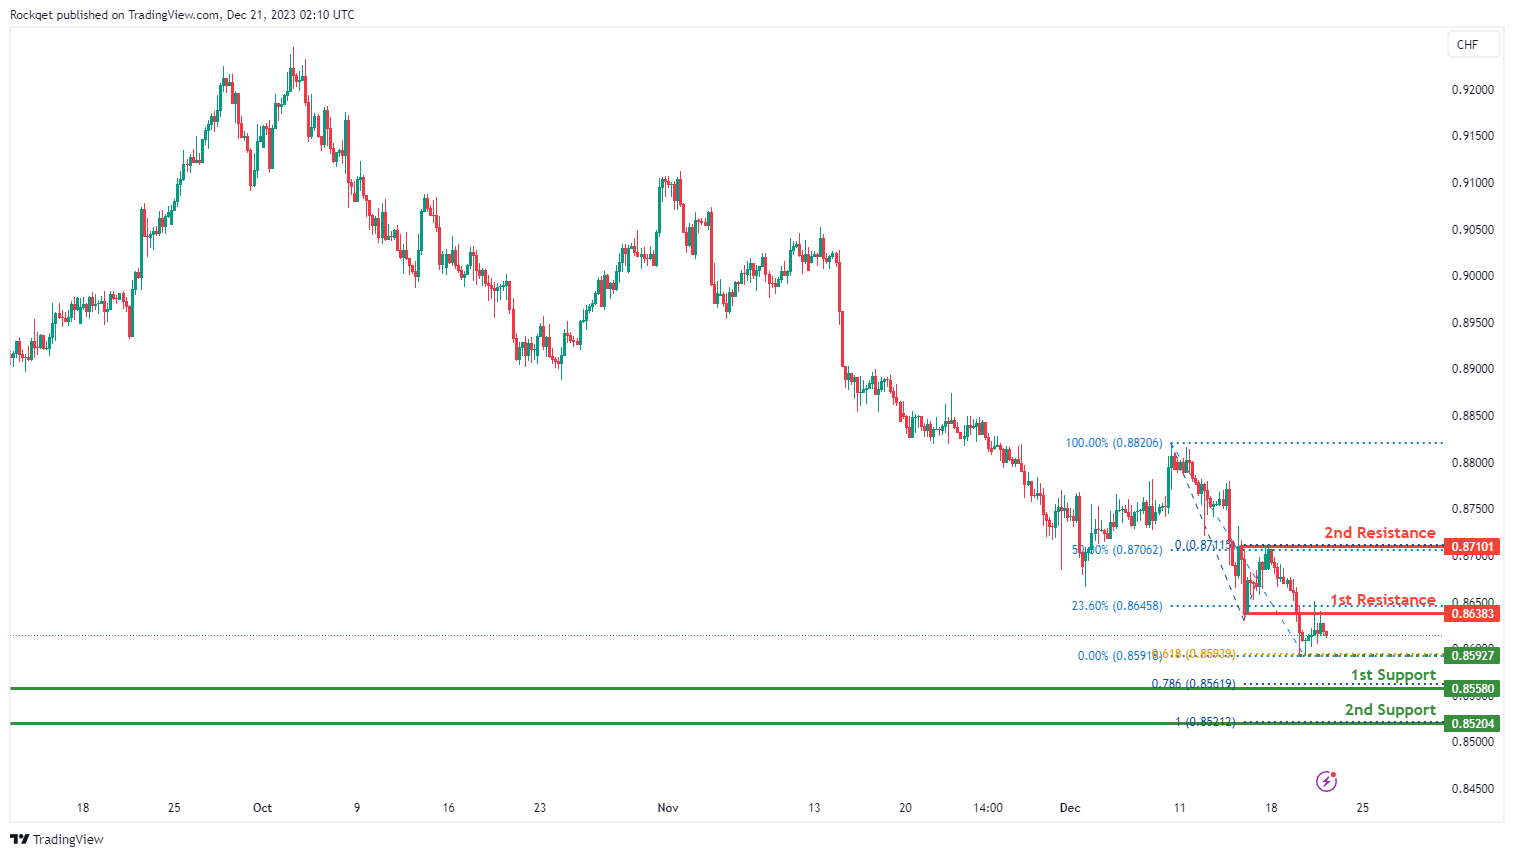
The USD/CHF chart currently exhibits an overall bearish momentum. In this context, there is a potential scenario for price to make a bearish continuation towards the 1st support.
The intermediate support level at 0.8592 is identified as a pullback support that aligns with the 61.80% Fibonacci projection level while the 1st support level at 0.8558 is marked as a multi-swing-low support that aligns with the 78.60% Fibonacci projection level. Further below, the 2nd support level at 0.8520 is noted as a swing-low support that aligns with the 100.00% Fibonacci projection level, further reinforcing its importance as a key support level.
To the upside, the 1st resistance level at 0.8638 is identified as a pullback resistance that aligns close to the 23.60% Fibonacci retracement level. Higher up, the 2nd resistance level at 0.8710 is also marked as a pullback resistance that aligns with the 50.00% Fibonacci retracement level, suggesting a potential barrier for further upside movement.
USD/JPY:
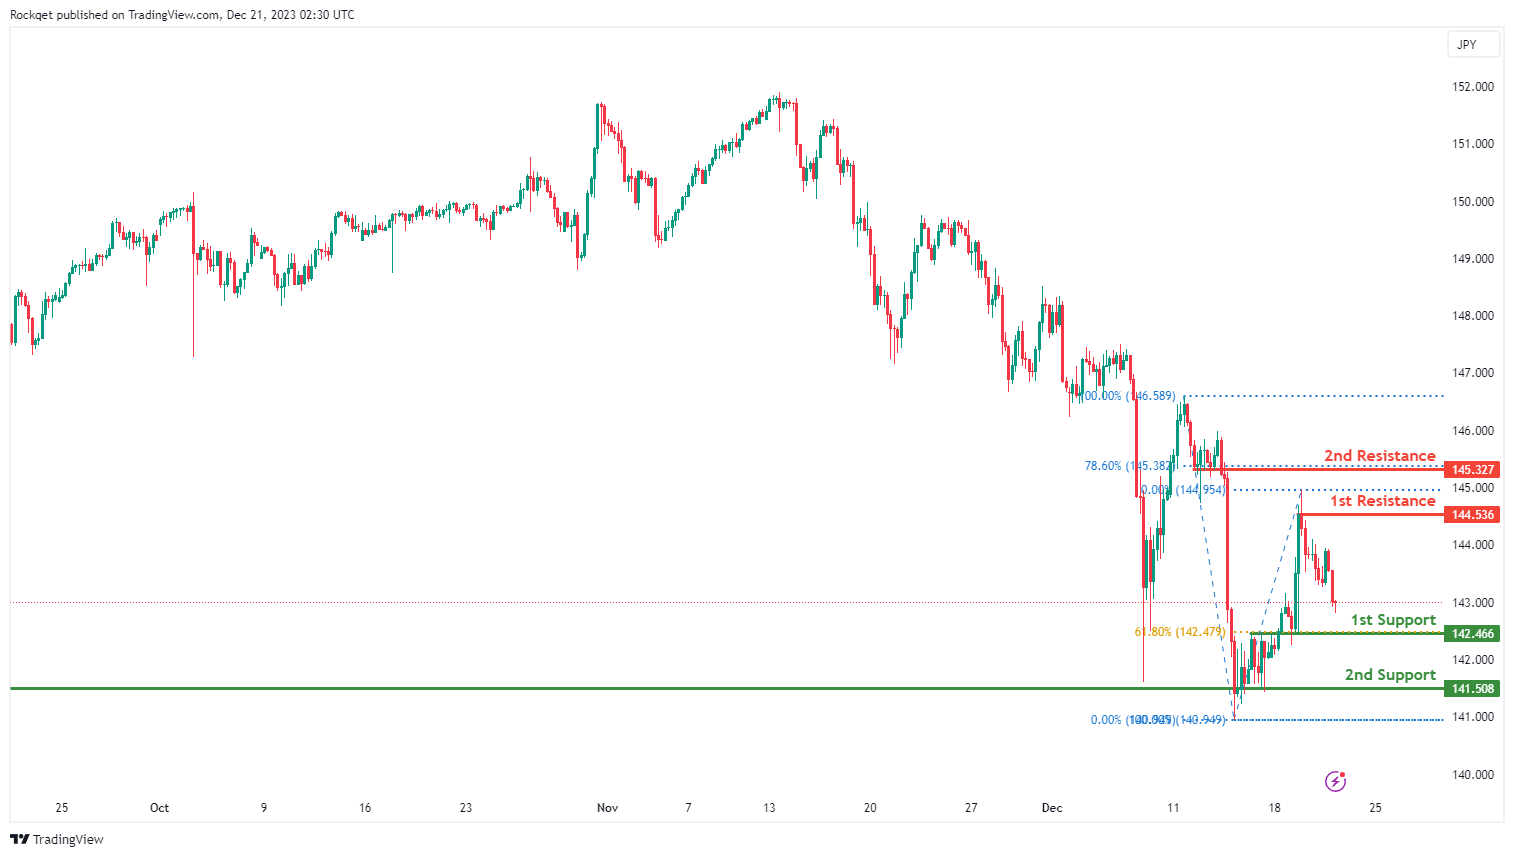
The USD/JPY chart currently exhibits an overall bearish momentum, indicating a potential for price to make a bearish continuation towards the 1st support.
The 1st support level at 142.46 is identified as an overlap support that aligns with the 61.80% Fibonacci retracement level. Further below, the 2nd support level at 141.50 is noted as a multi-swing-low support, further reinforcing its importance as a key support level.
To the upside, the 1st resistance level at 144.53 is identified as a pullback resistance. Higher up, the 2nd resistance level at 145.32 is also marked as a pullback resistance that aligns with the 78.60% Fibonacci retracement level, suggesting a potential barrier for further upside movement.
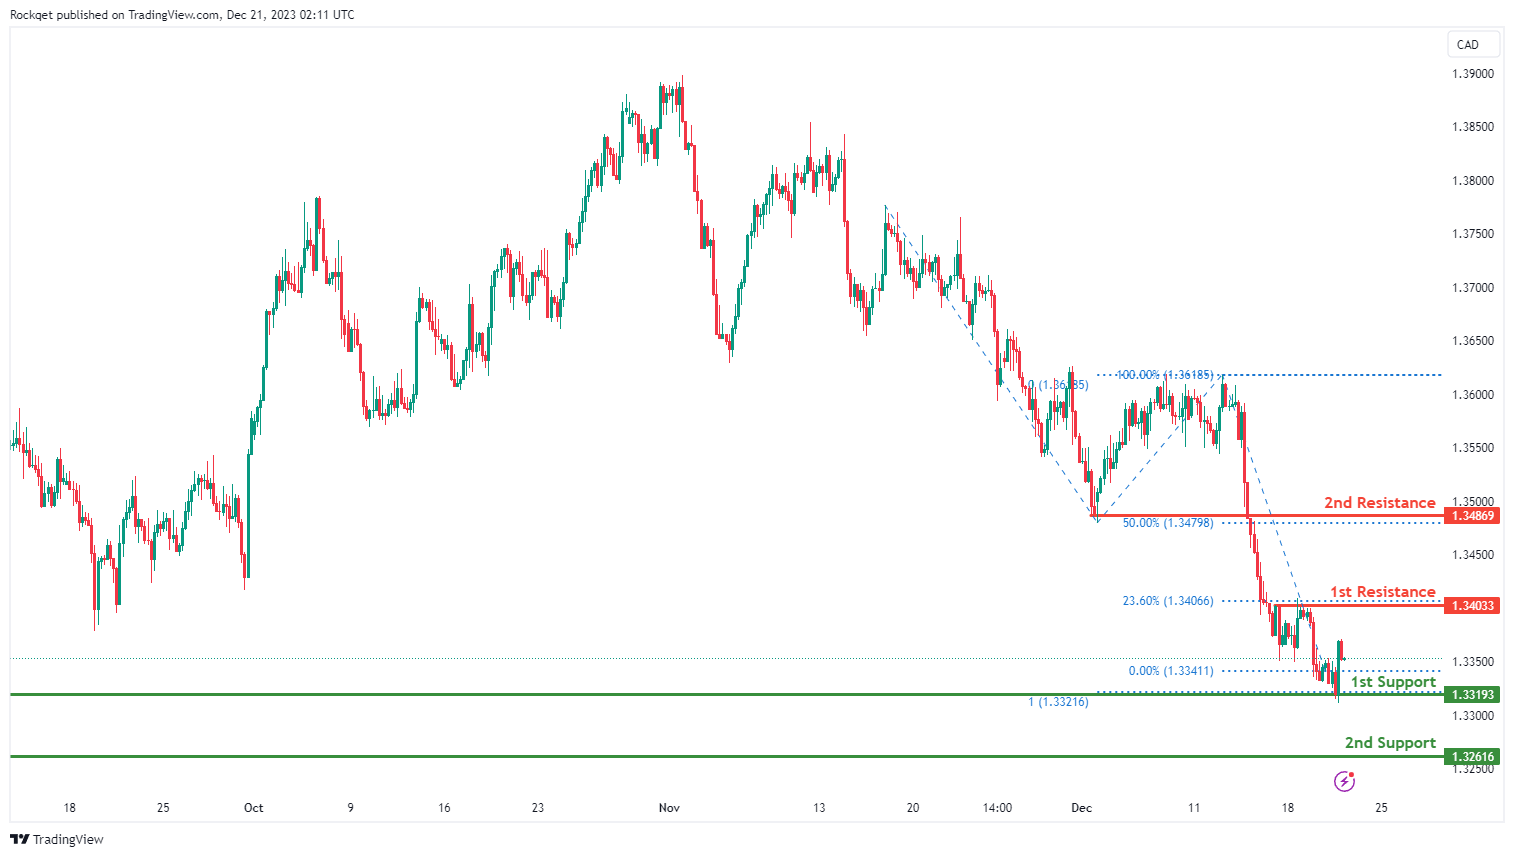
USD/CAD:
The USD/CAD chart currently exhibits an overall bearish momentum, indicating a potential for a drop towards the 1st support.
The 1st support level at 1.3319 is identified as a pullback support that aligns with the 100.00% Fibonacci projection level. Further below, the 2nd support level at 1.3261 is noted as an overlap support, further reinforcing its importance as a key support level.
To the upside, the 1st resistance level at 1.3403 is identified as a pullback resistance that aligns with the 23.60% Fibonacci retracement level. Higher up, the 2nd resistance level at 1.3486 is also marked as a pullback resistance that aligns with the 50.00% Fibonacci retracement level, suggesting a potential barrier for further upside movement.
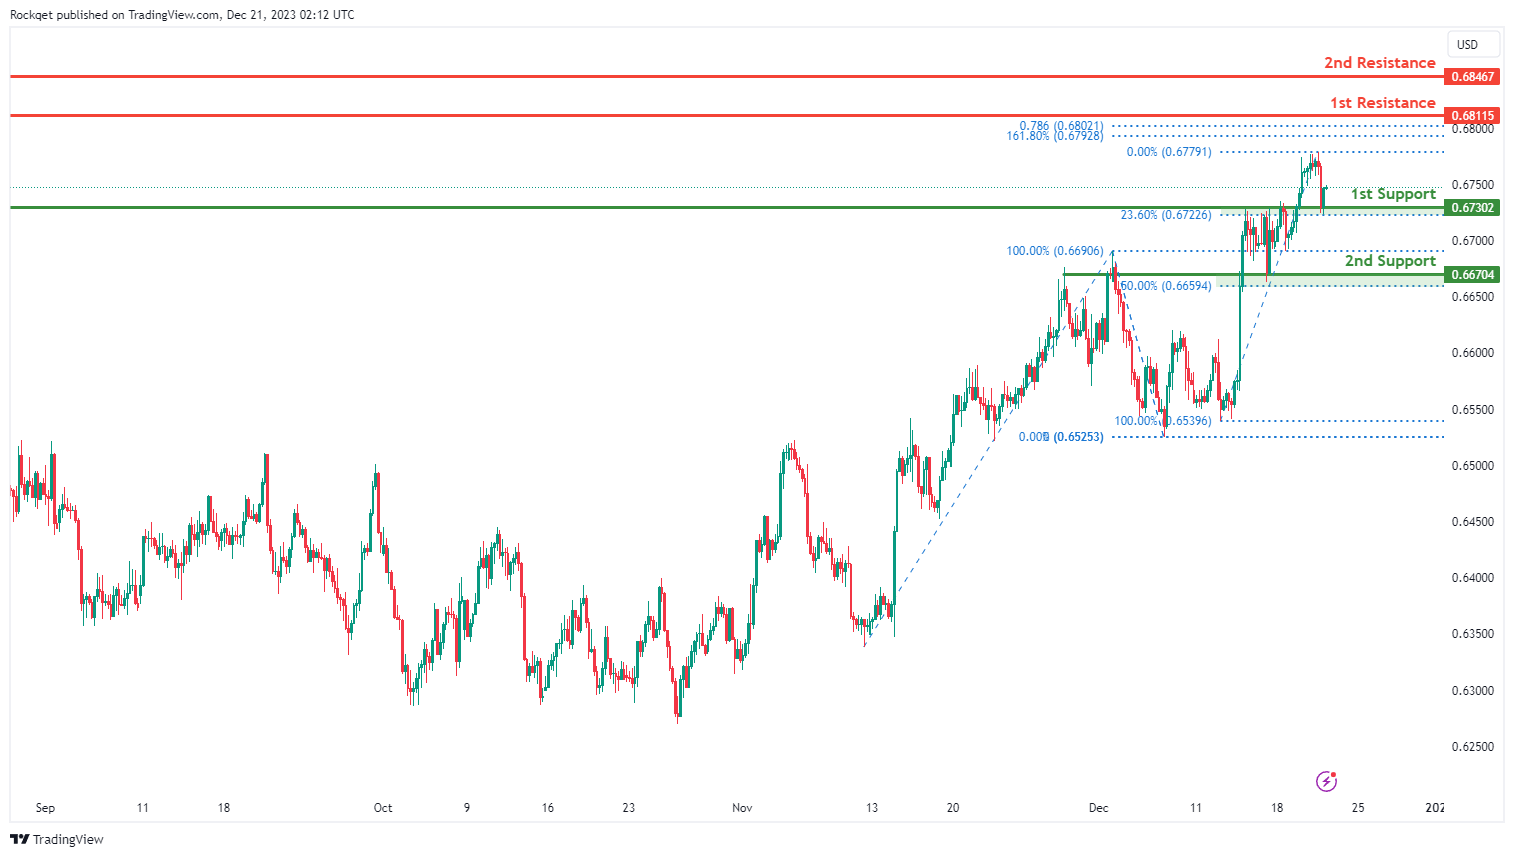
AUD/USD:
The AUD/USD chart currently exhibits an overall bullish momentum. In this context, there is a potential scenario for price to make a bullish continuation towards the 1st resistance.
The 1st resistance level at 0.6811 is identified as a swing-high resistance that aligns with a confluence of Fibonacci levels i.e. the 161.80% extension and the 78.60% projection levels. Higher up, the 2nd resistance level at 0.6846 is also noted as a swing-high resistance, indicating its potential significance as a barrier for further upward movement.
To the downside, the 1st support level at 0.6730 is identified as an overlap support that aligns with the 23.60% Fibonacci retracement level. Further below, the 2nd support level at 0.6670 is also marked as an overlap support that aligns close to the 50.00% Fibonacci retracement level, further reinforcing its importance as a key support level.
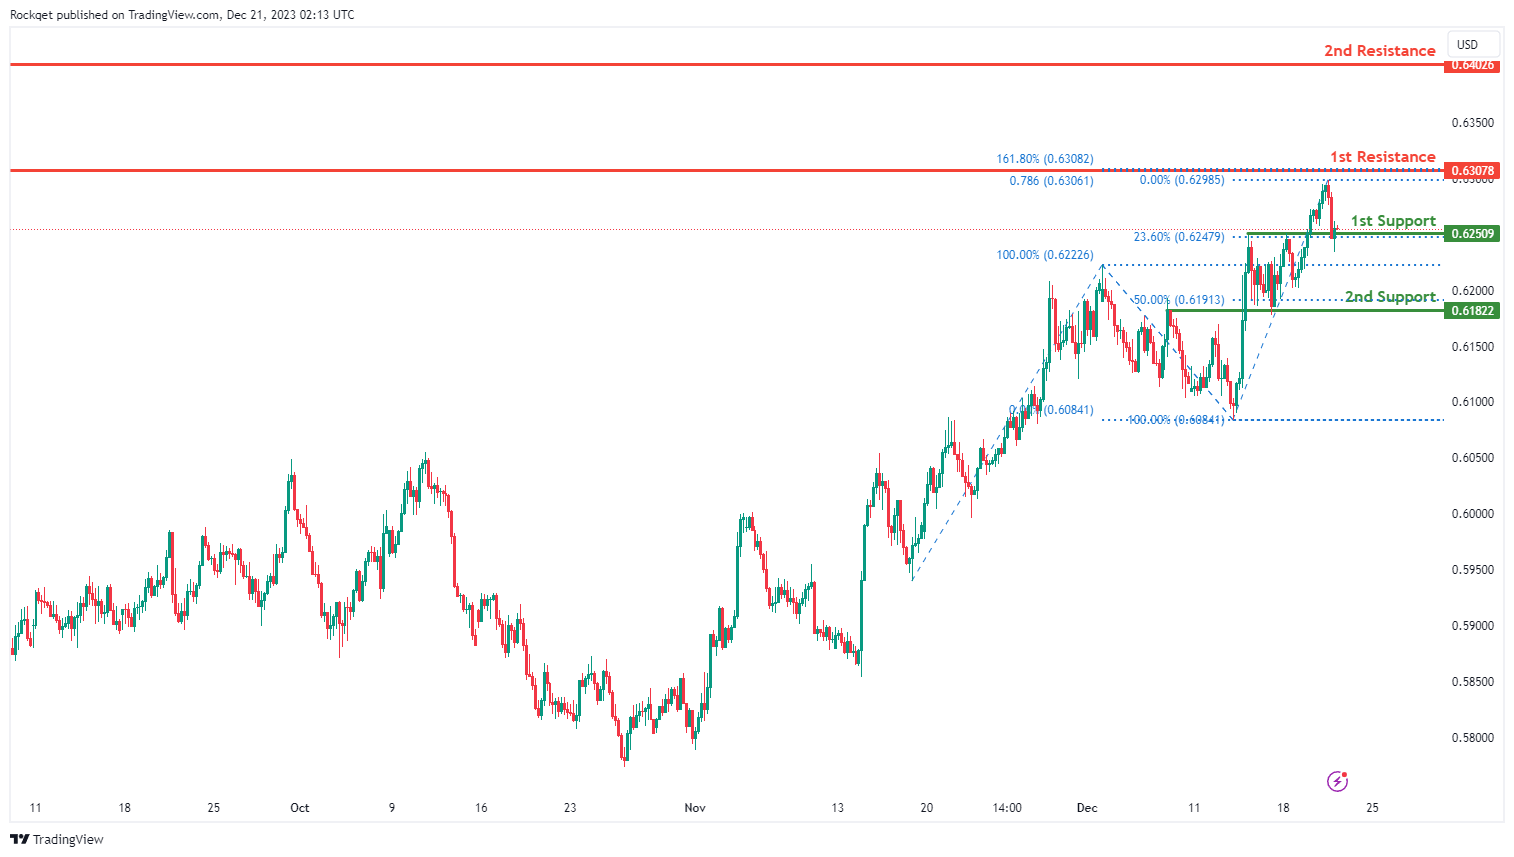
NZD/USD
The NZD/USD chart currently exhibits an overall bullish momentum. In this context, there is a potential scenario for price to make a bullish bounce off the 1st support and rise towards the 1st resistance.
The 1st support level at 0.6250 is identified as an overlap support that aligns with the 23.60% Fibonacci retracement level. Further below, the 2nd support level at 0.6182 is also noted as an overlap support that aligns close to the 50.00% Fibonacci retracement level, further reinforcing its importance as a key support level.
To the upside, the 1st resistance level at 0.6307 is identified as a swing-high resistance that aligns with a confluence of Fibonacci levels i.e. the 161.80% extension and the 78.60% projection levels. Higher up, the 2nd resistance level at 0.6402 is also marked as a swing-high resistance, indicating its potential significance as a barrier for further upward movement.
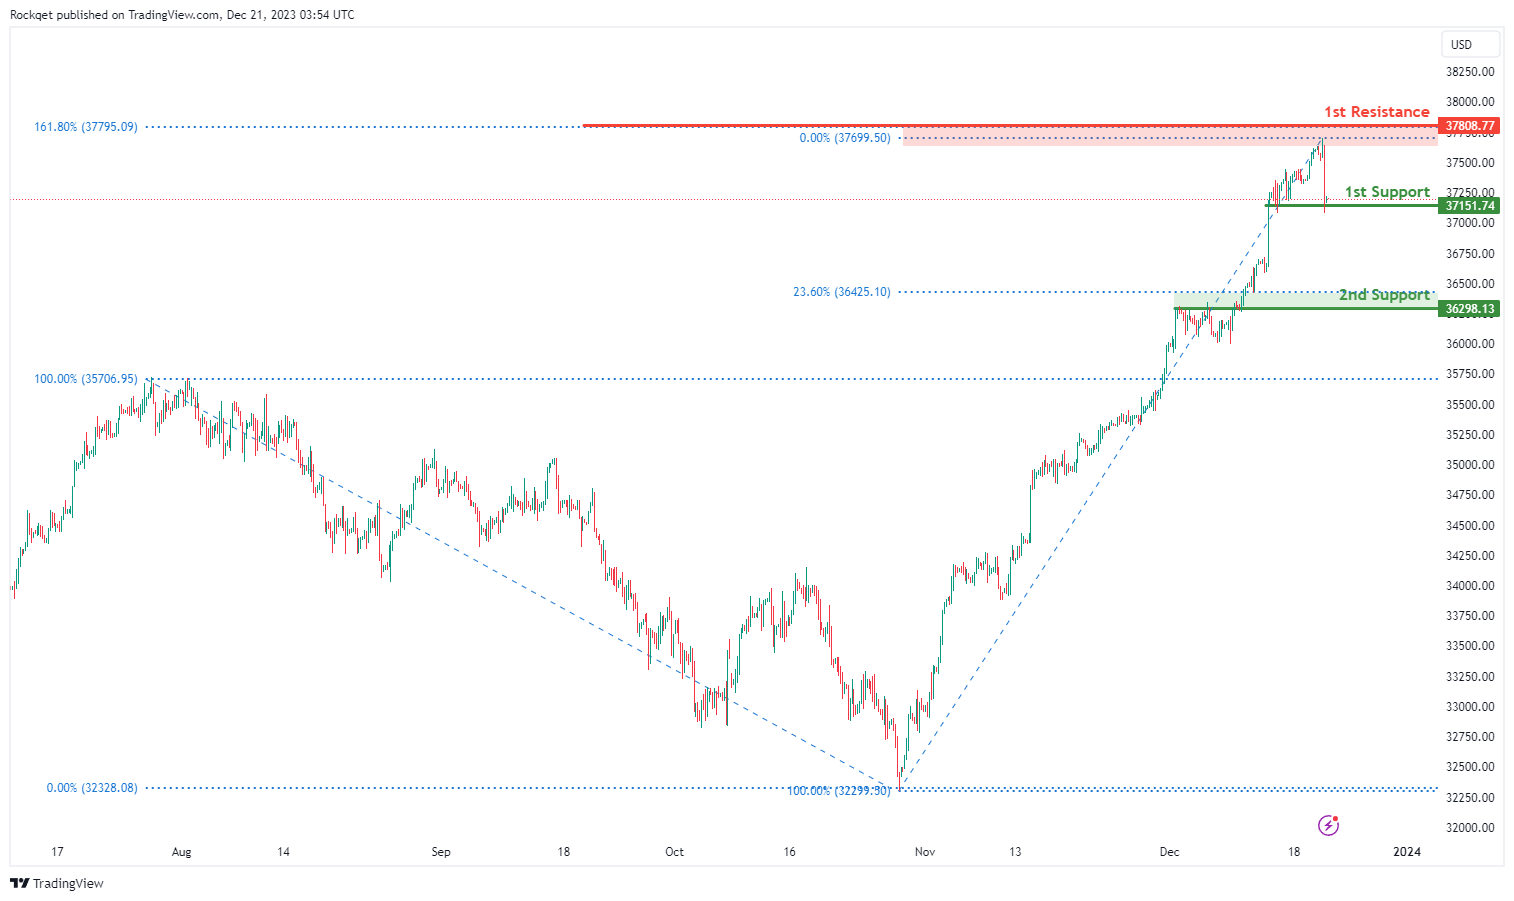
DJ30:
The DJ30 chart currently exhibits a bullish overall momentum, indicating a potential scenario for a bullish bounce off the 1st support and a subsequent move towards the 1st resistance.
The 1st support at 37151.74 is considered significant as it represents an overlap support, signifying a historical area where buying interest has been present. This reinforces its potential as a crucial support zone for the index.
Additionally, the 2nd support at 36298.13 is identified as both an overlap support and associated with the 23.60% Fibonacci Retracement, providing an additional layer of potential support.
On the resistance side, the 1st resistance at 37808.77 is linked to the 161.80% Fibonacci Extension. This level may act as a barrier where selling interest could intensify, potentially causing a temporary pause or reversal in the bullish trend.
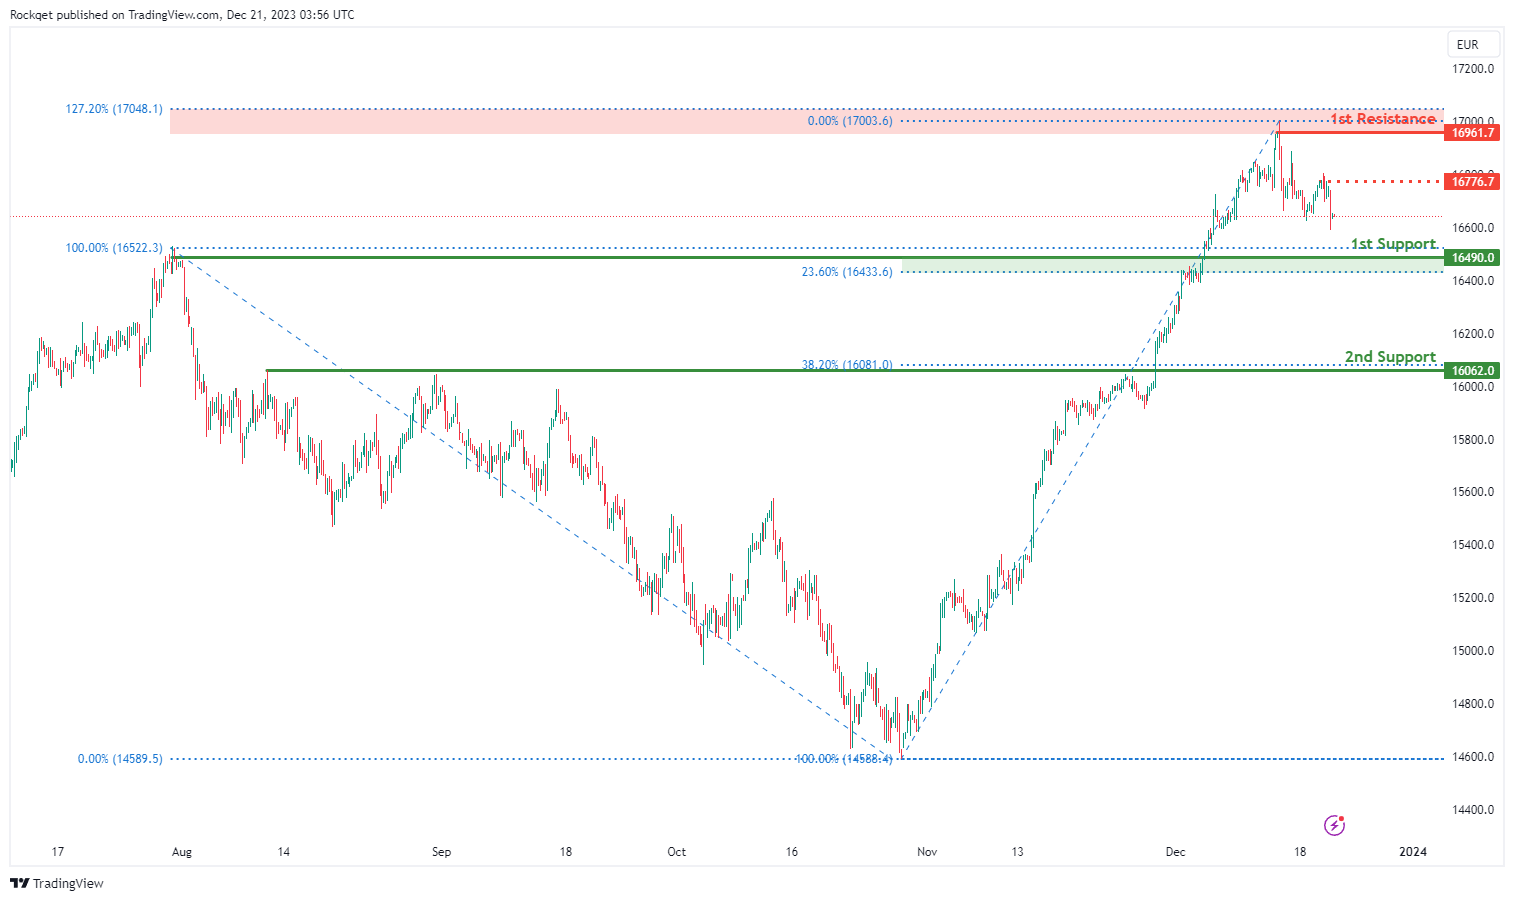
GER40:
The GER40 chart currently demonstrates a neutral overall momentum, with factors contributing to this state. As a result, the price could potentially make fluctuations between the 1st resistance and 1st support levels.
The 1st support at 16490.00 is considered significant as it represents an overlap support and is associated with the 23.60% Fibonacci Retracement. This level indicates a historical area where buying interest has been present, reinforcing its potential as a crucial support zone.
Additionally, the 2nd support at 16062.00 is identified as a pullback support and is linked to the 38.20% Fibonacci Retracement, providing an additional layer of potential support for the index.
On the resistance side, the intermediate resistance at 16776.70 is associated with a pullback resistance, indicating a level where selling interest could intensify.
Furthermore, the 1st resistance at 16961.70 is linked to a swing high resistance and the 127.20% Fibonacci Extension, highlighting a potential challenge for the price to surpass these levels.
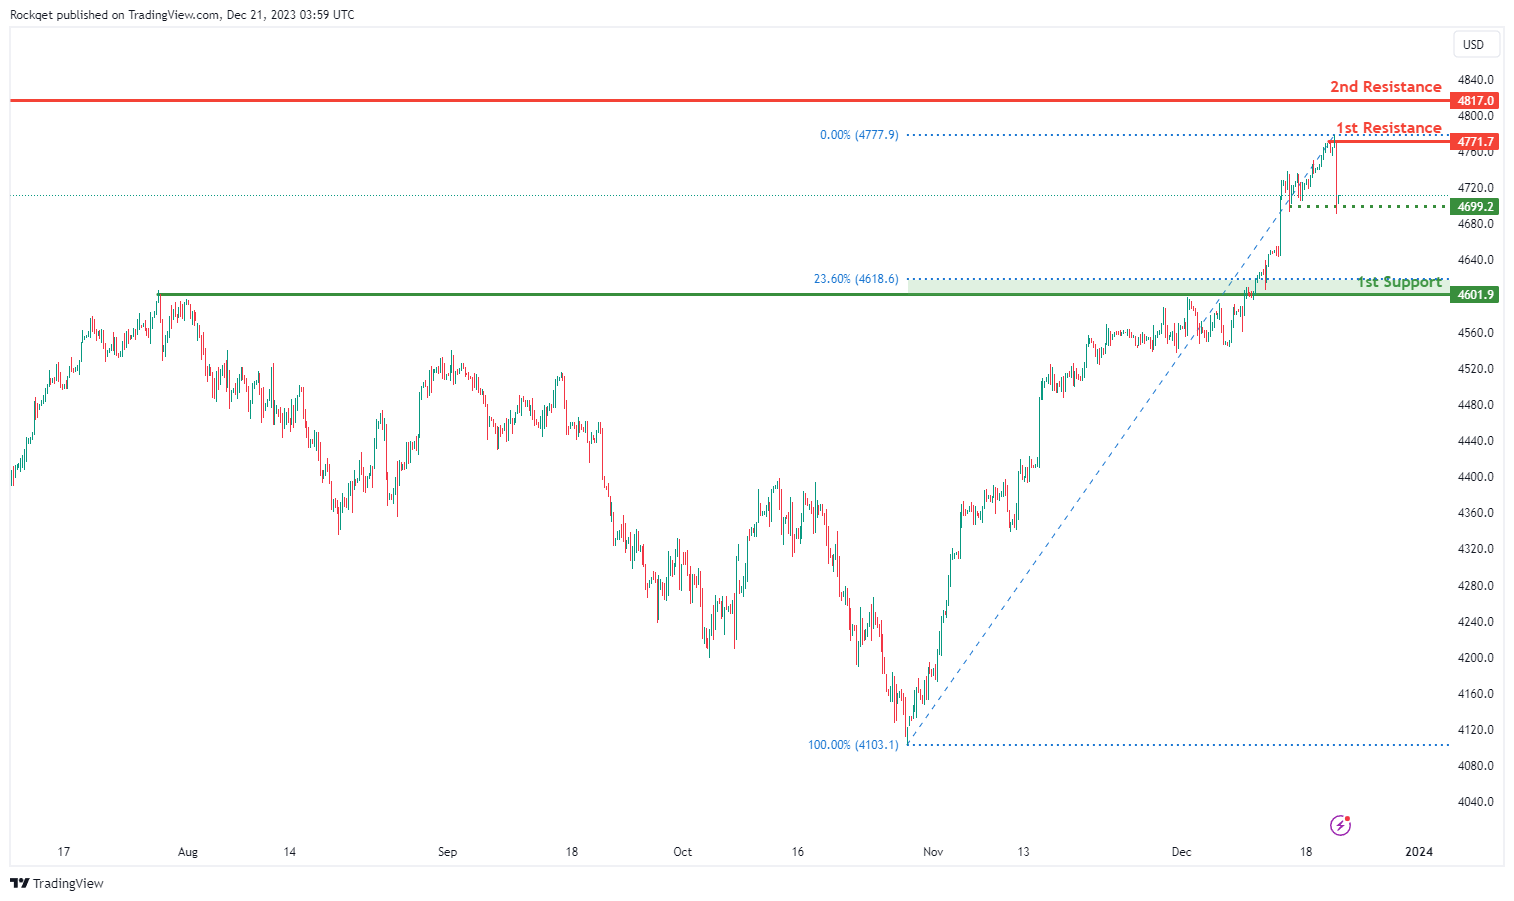
US500:
The US500 chart currently demonstrates a bullish overall momentum, with several factors contributing to this positive sentiment. As a result, the price could potentially make a bullish continuation towards the 1st resistance.
The intermediate support at 4699.2 is considered significant as it represents a multi-swing low support, indicating a historical area where buying interest has been present.
Additionally, the 1st support at 4601.9 is identified as an overlap support and is associated with the 23.60% Fibonacci Retracement, providing an additional layer of potential support for the index.
On the resistance side, the 1st resistance at 4771.7 is linked to a swing high resistance, and the 2nd resistance at 4817.0 is also associated with a swing high resistance. These levels represent potential barriers where selling interest could intensify, potentially causing a temporary pause or reversal in the bullish trend.
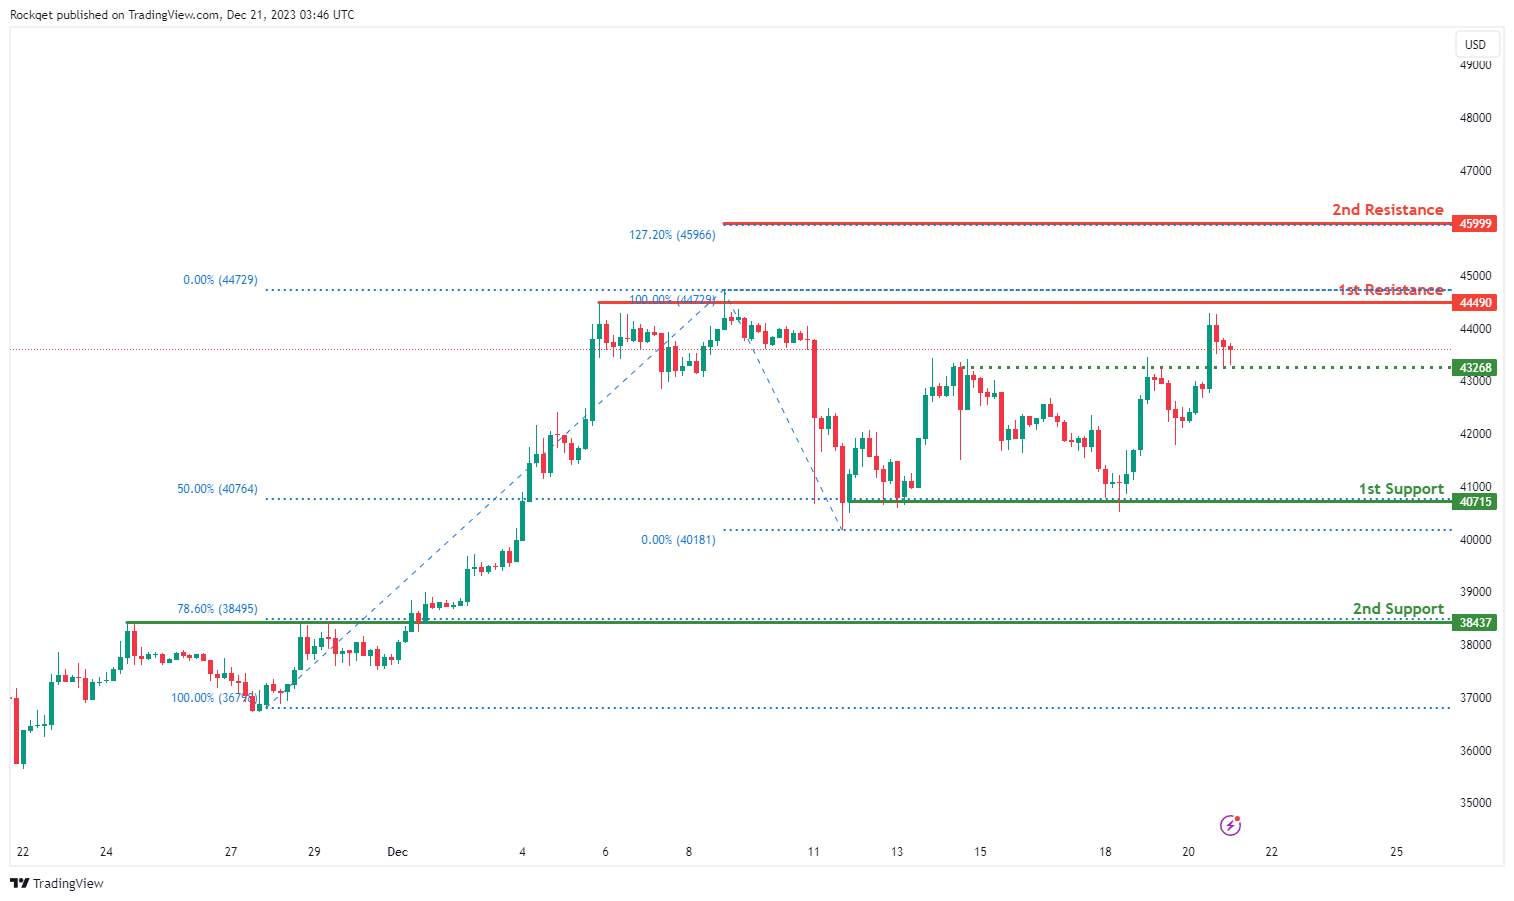
BTC/USD:
The BTC/USD chart currently demonstrates a bullish overall momentum, suggesting a potential scenario for a bullish continuation towards the 1st resistance.
The 1st support at 40715 is noteworthy as it corresponds to a swing low support and aligns with the 50% Fibonacci Retracement level. This level indicates a historical area where buying interest has been prevalent, reinforcing its significance as a crucial support zone.
Additionally, the 2nd support at 38437 is identified as an overlap support and is associated with the 78.60% Fibonacci Retracement, providing an additional layer of potential support for the cryptocurrency.
On the resistance side, the 1st resistance at 44490 is linked to a swing high resistance, marking a level where selling interest could intensify, potentially causing a temporary pause or reversal in the bullish trend.
Furthermore, the 2nd resistance at 45999 is associated with the 127.20% Fibonacci Extension, presenting a potential challenge for the price to surpass these levels.
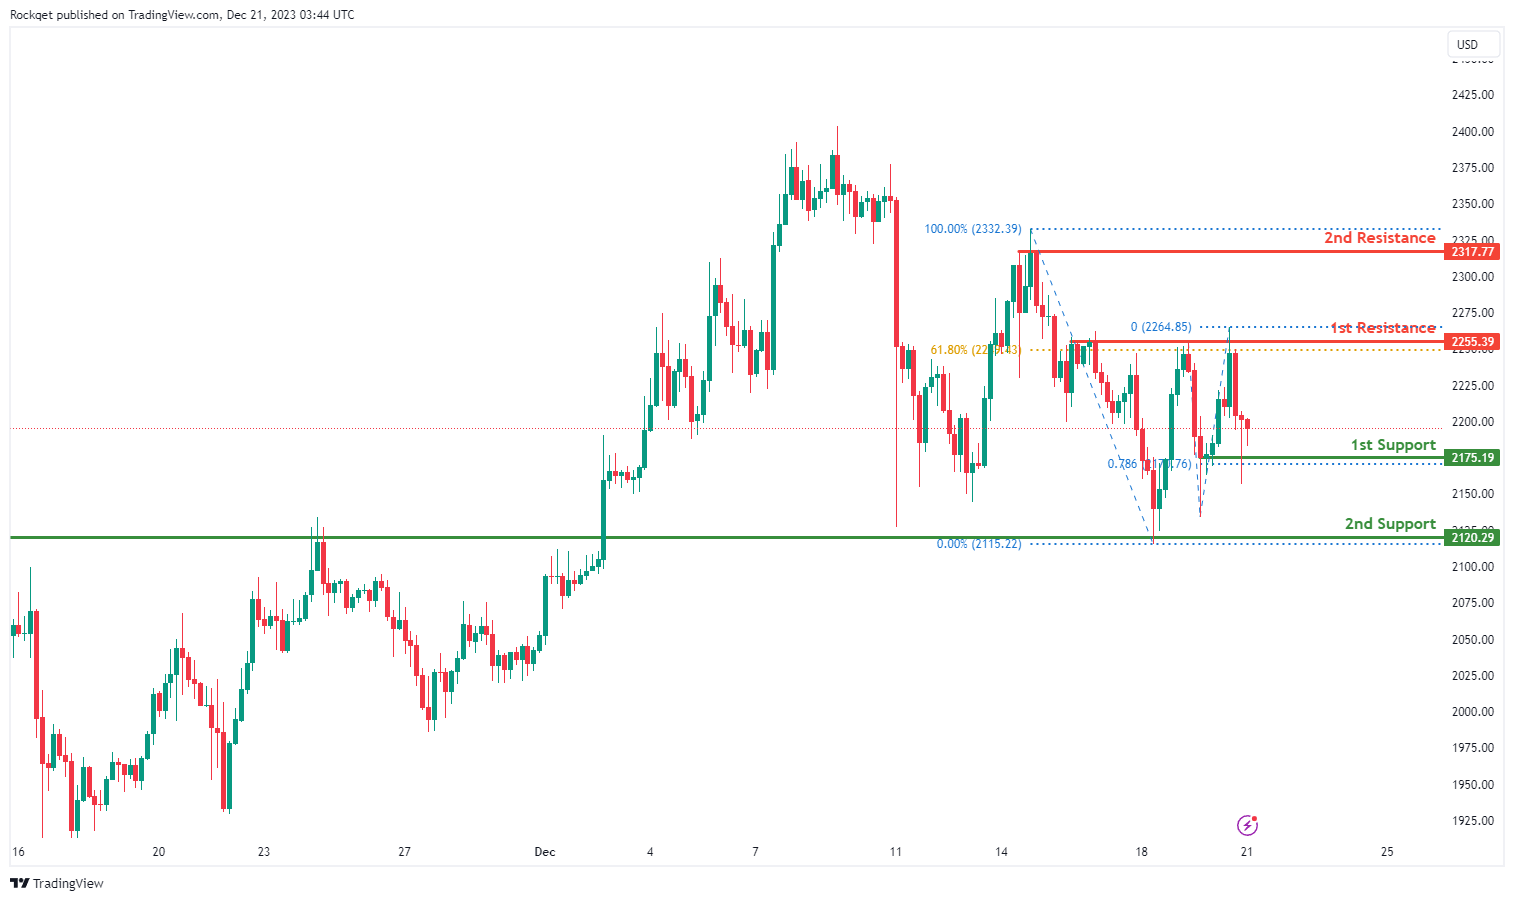
ETH/USD:
The ETH/USD chart currently exhibits a bearish overall momentum, suggesting a potential scenario for a bearish continuation towards the 1st support.
The 1st support at 2175.19 is significant as it is identified as a pullback support and coincides with the 78.60% Fibonacci Retracement level. This level indicates a historical area where buying interest has been present, reinforcing its importance as a key support zone.
Additionally, the 2nd support at 2120.29 is considered a swing low support, providing an additional layer of potential support for the cryptocurrency.
On the resistance side, the 1st resistance at 2255.39 is associated with a pullback resistance and the 61.80% Fibonacci Retracement, indicating a level where selling interest could intensify, potentially causing a temporary pause or reversal in the bearish trend.
Furthermore, the 2nd resistance at 2317.77 is linked to a swing high resistance and the 100% Fibonacci Retracement, presenting a potential challenge for the price to surpass these levels.
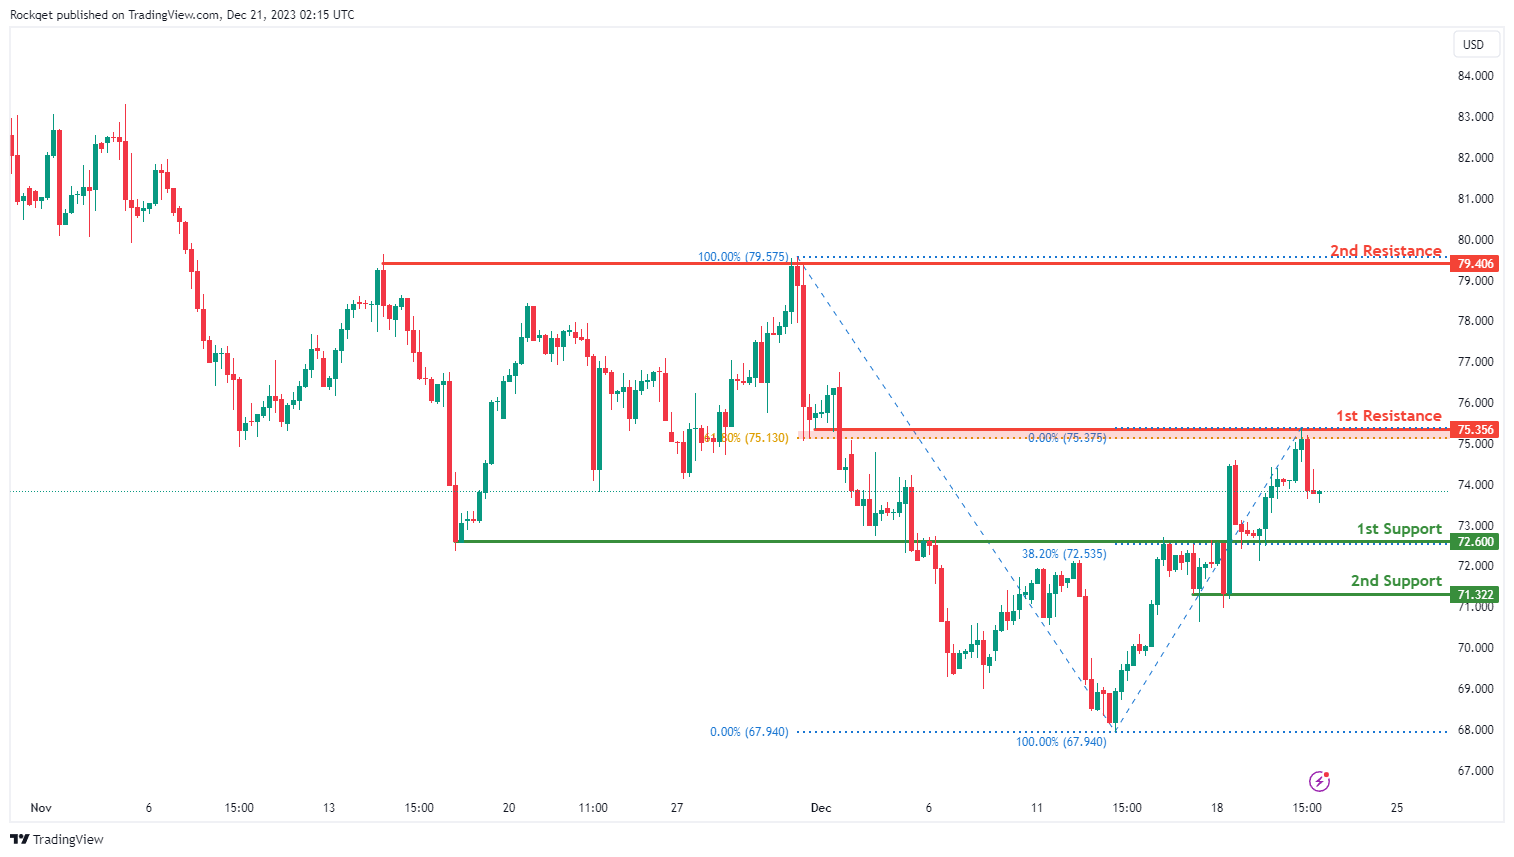
WTI/USD:
The WTI chart currently exhibits an overall bullish momentum, suggesting a prevailing uptrend. In this context, there is a potential scenario for price to make a bullish continuation towards the 1st resistance.
The 1st resistance level at 75.35 is identified as an overlap resistance that aligns close to the 61.80% Fibonacci retracement level. Higher up, the 2nd resistance level at 79.40 is noted as a multi-swing-high resistance, further indicating its potential significance as a barrier for further upward movement.
To the downside, the 1st support level at 72.60 is identified as an overlap support that aligns with the 38.20% Fibonacci retracement level. Further below, the 2nd support level at 71.32 is marked as a pullback support, reinforcing its importance as a key support level.
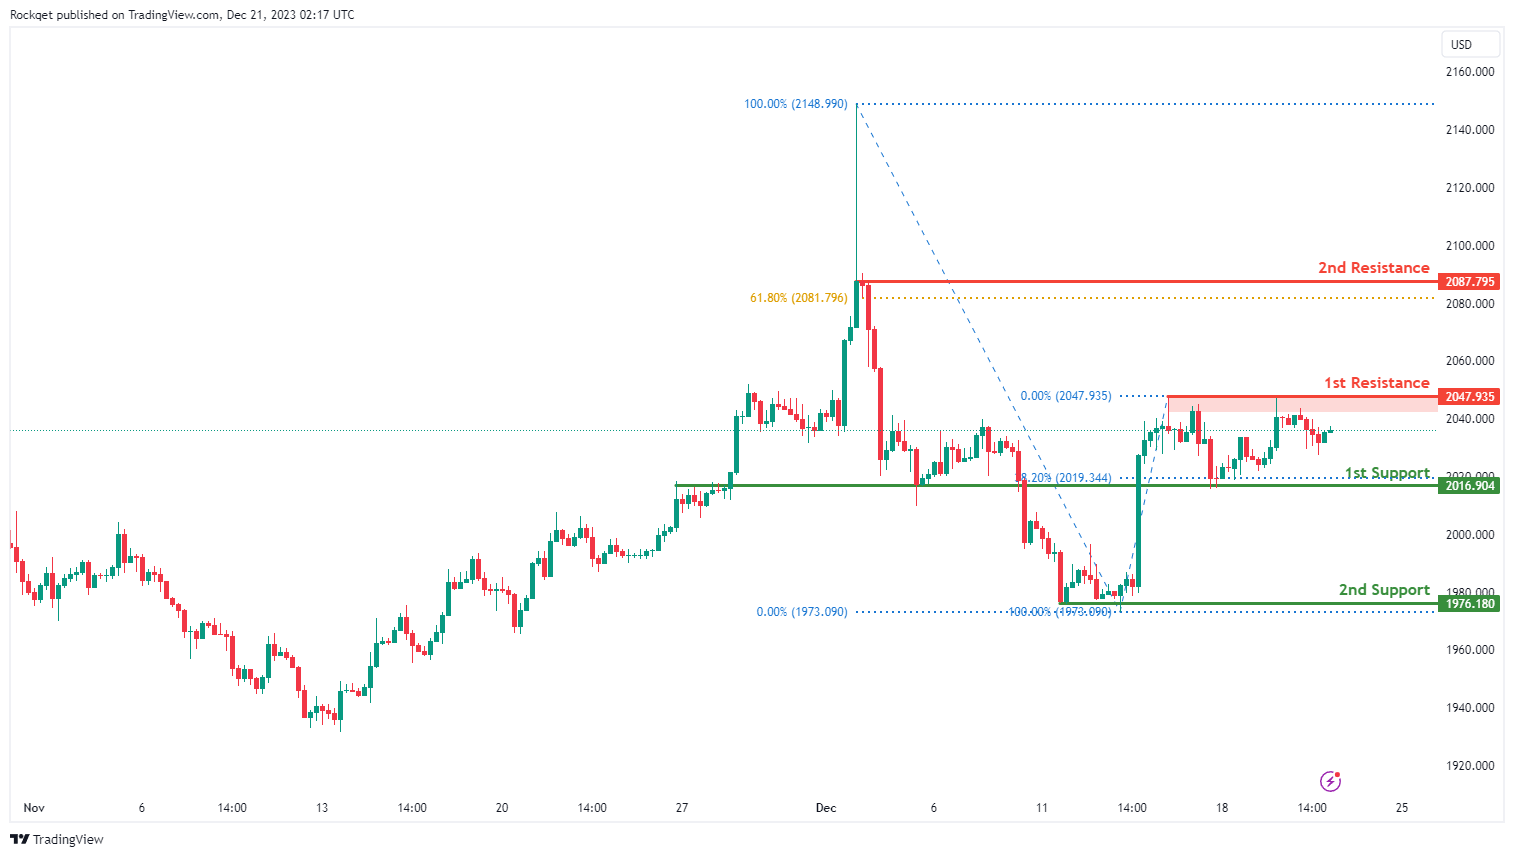
XAU/USD (GOLD):
The XAU/USD chart currently demonstrates a neutral momentum, indicating a potential for price to fluctuate between the 1st support and the 1st resistance.
The 1st support level at 2,016.90 is identified as an overlap support that aligns with the 38.20% Fibonacci retracement level. Further below, the 2nd support level at 1,976.18 is noted as a pullback support, reinforcing its importance as a key support level.
To the upside, the 1st resistance level at 2,047.93 is identified as a pullback resistance. Higher up, the 2nd resistance level at 2,087.79 is also marked as a pullback resistance that aligns close to the 61.80% Fibonacci retracement level, further indicating its potential significance as a barrier for further upward movement.


