
- Bearish reversal candlestick formed yesterday, its steepest daily loss since 27 October 2023.
- Odds now have skewed towards a potential minor corrective decline sequence within a medium-term uptrend phase.
- Watch the 16,800 key short-term resistance.
The price actions of the US Nas 100 Index (a proxy for the Nasdaq 100 futures) have continued to rally and surpassed the 16,590 short-term resistance as highlighted in our previous analysis and the former 16,772 all-time high printed on 22 November 2021.
It continued to inch higher yesterday, 20 December during the first half of the US session where it rallied by +0.3% intraday and printed a fresh all-time high of 16,898. But it could not maintain its initial bullish momentum and reversed down to end the US session with a daily loss of -1.37%
Steepest daily loss since 27 October 2023
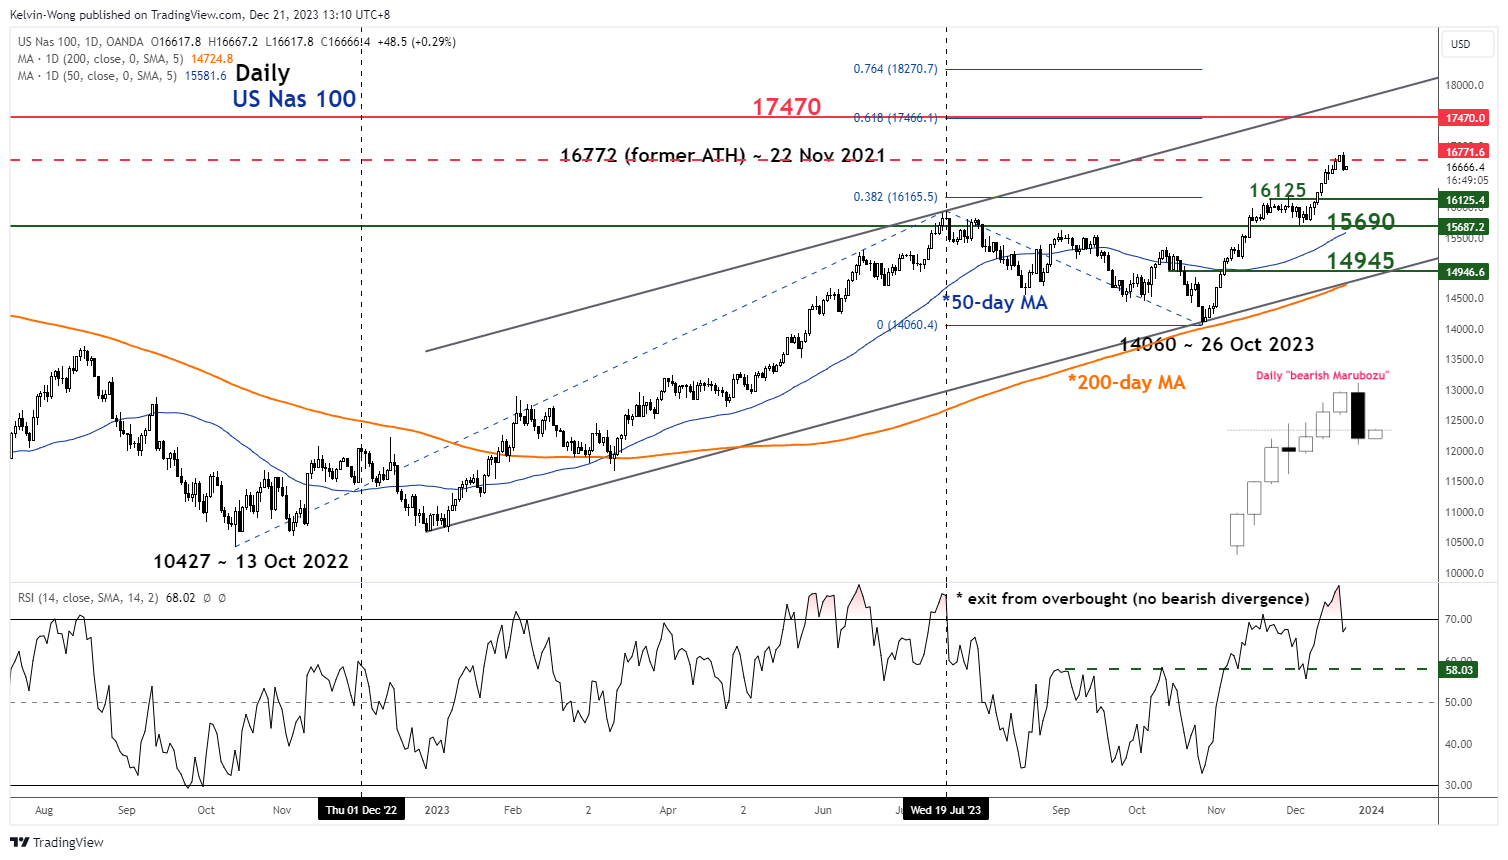
Fig 1: US Nas 100 medium-term trend as of 21 Dec 2023 (Source: TradingView, click to enlarge chart)
The US Nas 100 Index has formed a daily “bearish Marubozu” candlestick with a daily loss of -1.37% which is the steepest daily decline since the medium-term uptrend kickstarted on 27 October 2023.
These observations suggest the prior seven consecutive weeks of higher positive closes are likely to give way to a potential mean reversion decline sequence; at least a short-term multi-day corrective decline to retrace a portion of the enormous swift rally of +20% from the low of 23 October 2023 to yesterday’s fresh intraday all-time high of 16,898.
Short-term bullish trend exhaustion
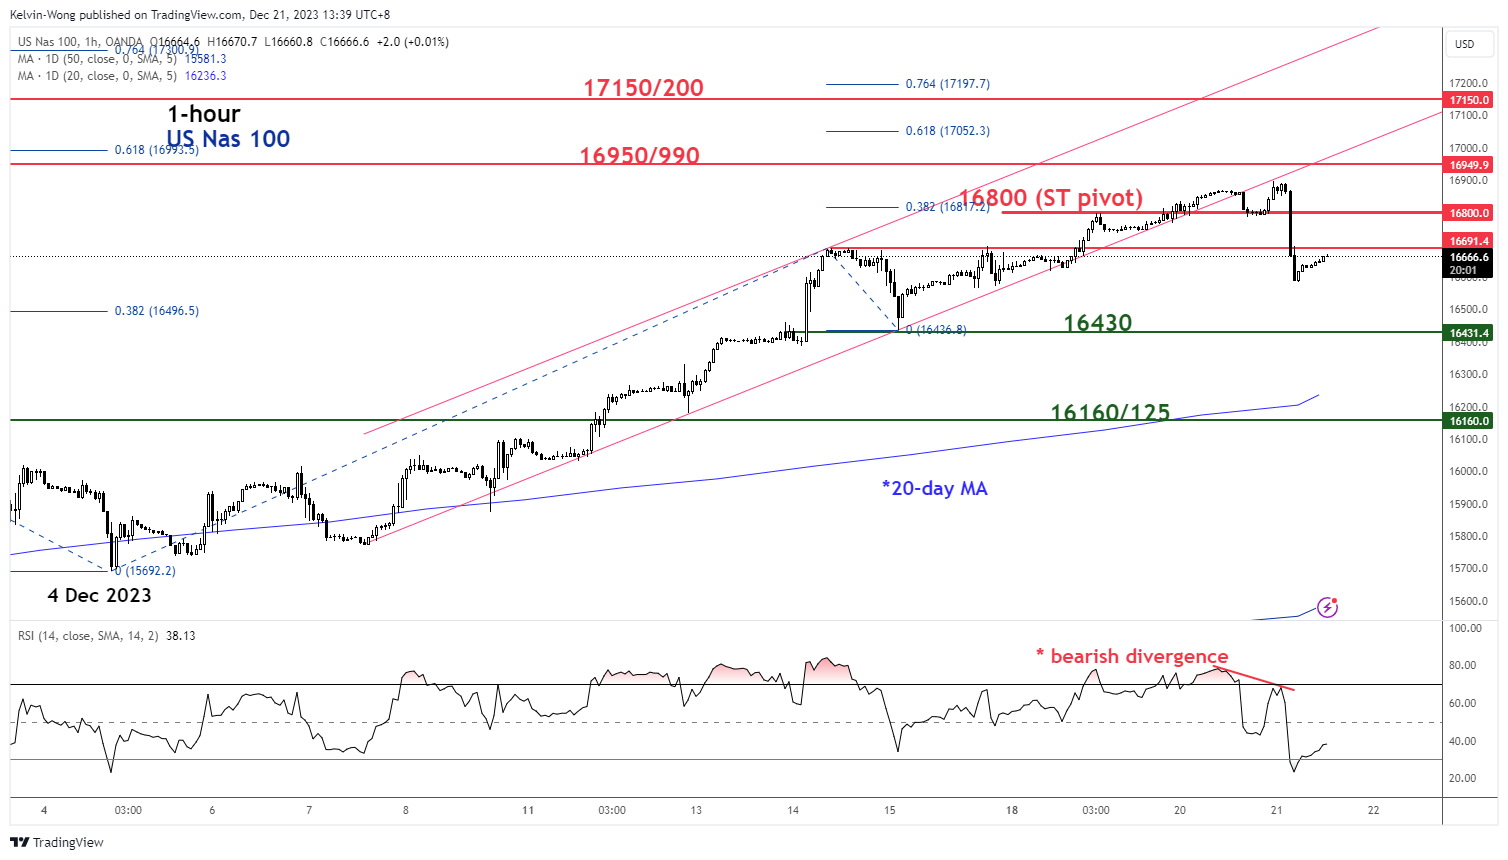
Fig 2: US Nas 100 minor short-term trend as of 21 Dec 2023 (Source: TradingView, click to enlarge chart)
Its price actions have broken below a minor ascending channel support from the 7 December 2023 low as depicted on the hourly chart.
The retest seen yesterday, 20 December on the former ascending channel support turned pull-back resistance has been accompanied by a bearish divergence condition flashed out on the hourly RSI momentum indicator at its overbought zone.
These short-term bearish elements have reinforced the potential start of a minor corrective decline sequence within its medium-term uptrend phase that is still intact.
If 16,800 key short-term pivotal resistance is not surpassed, the Index may see the next immediate support coming in at 16,430 and a break below it exposes the next support at 16,160/125 (also the upward sloping 20-day moving average).
On the flip side, a clearance above 16,800 invalidates the minor corrective decline scenario for a potential continuation of the bullish impulsive upmove towards the next immediate resistances of 16,950/990 and 17,150/200.


 have continued to rally and surpassed the 16,590 short-term resistance as highlighted in our previous analysis and the former 16,772 all-time high printed on 22 November 2021.)