
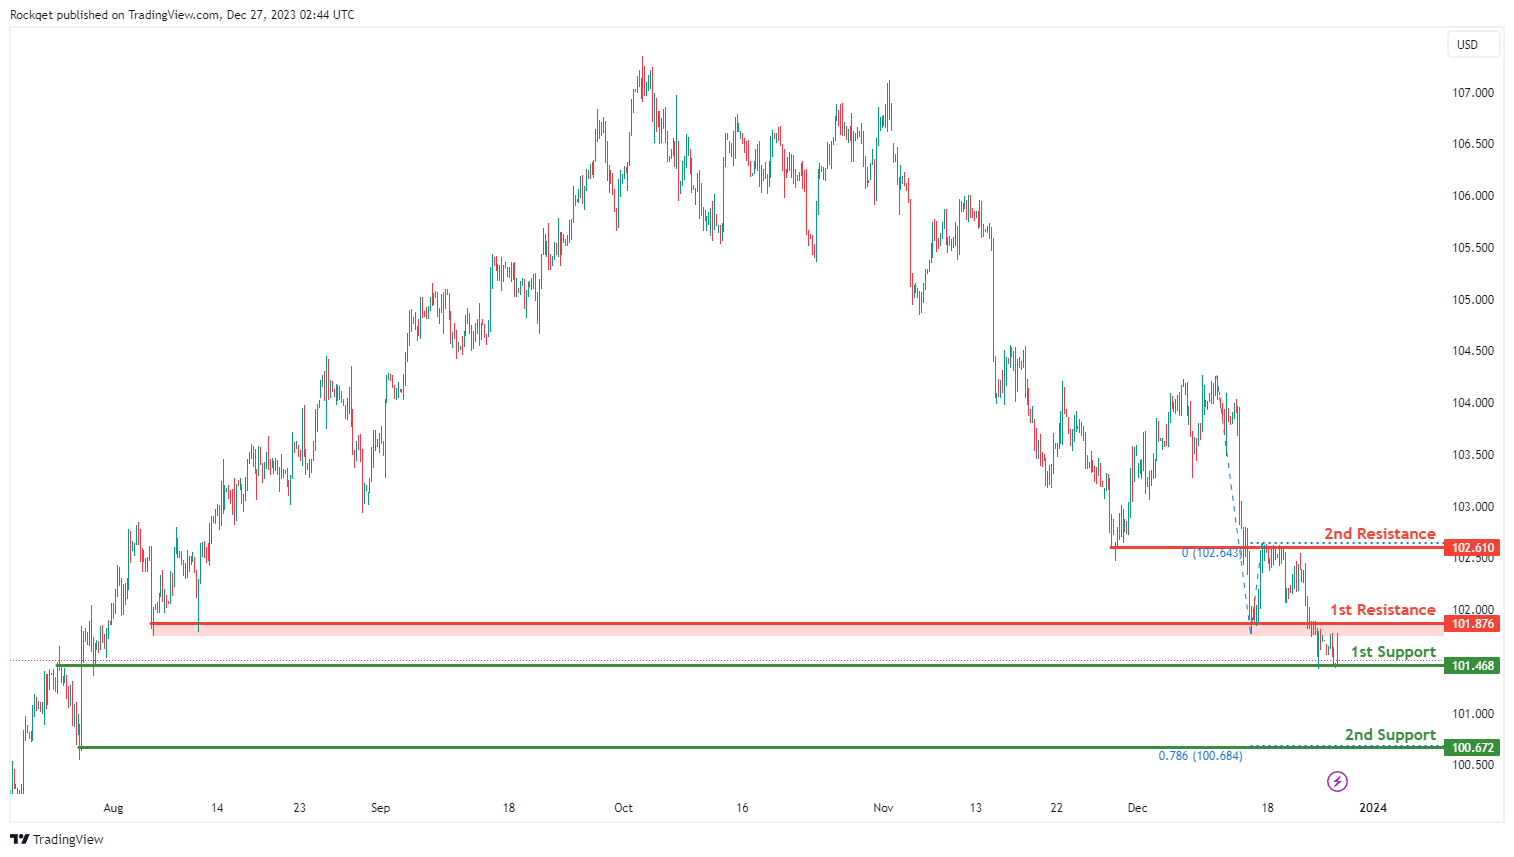
DXY:
The DXY (US Dollar Index) chart currently shows an overall bearish momentum, indicating a potential for price to make a bearish continuation towards the 1st support.
The 1st support level at 101.46 is identified as an overlap support. Further below, the 2nd support level at 100.67 is noted as a swing-low support that aligns with the 78.60% Fibonacci projection level, further reinforcing its importance as a potential key support level.
To the upside, the 1st resistance level at 101.87 is identified as an overlap resistance. Higher up, the 2nd resistance level at 102.61 is also marked as an overlap resistance, suggesting a potential barrier for further upside movement.
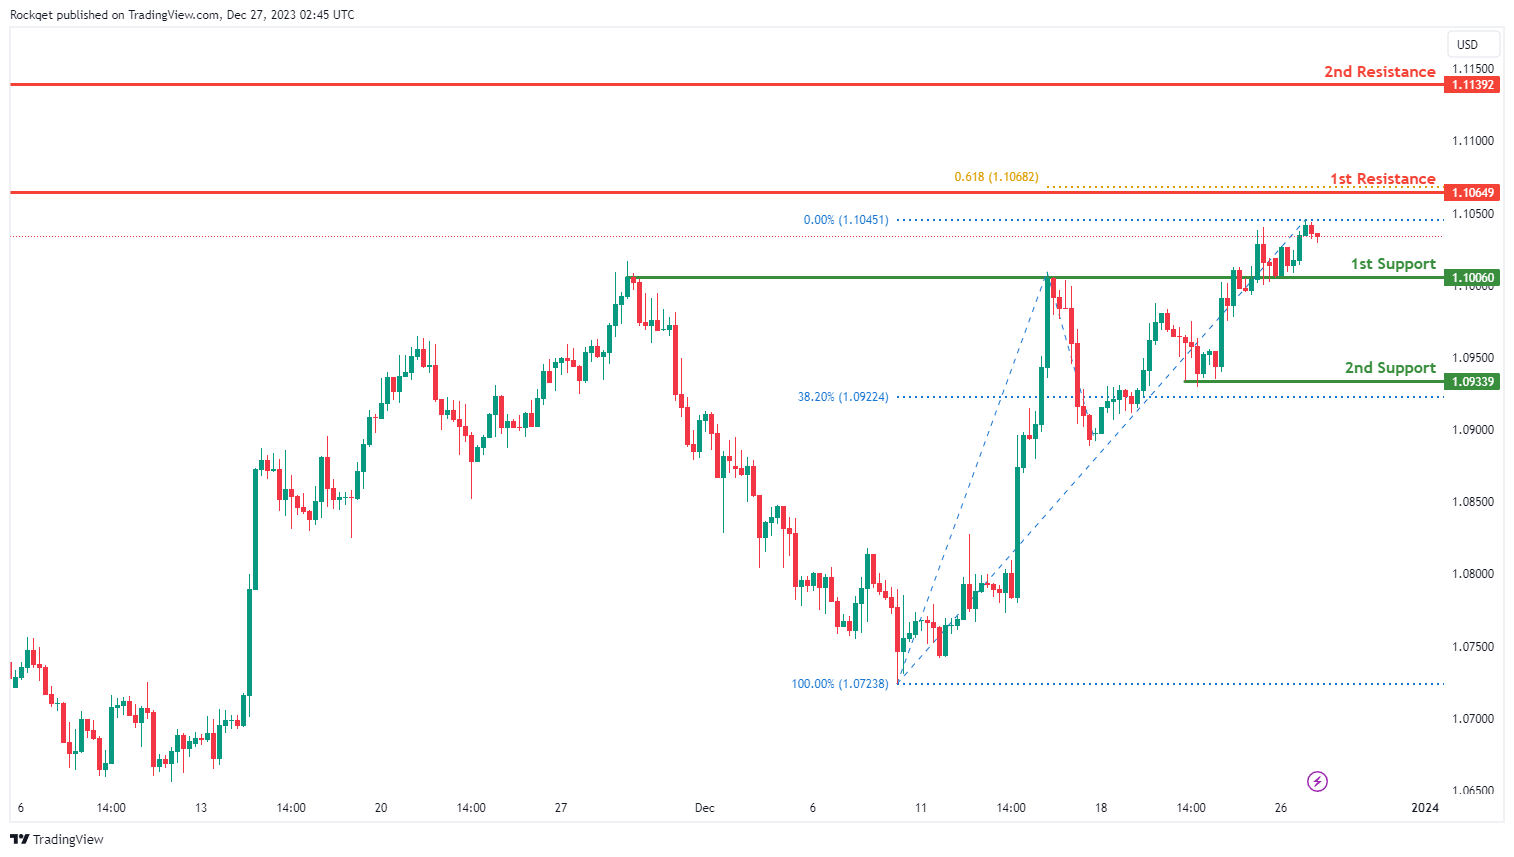
EUR/USD:
The EUR/USD chart currently exhibits an overall bullish momentum. In this context, there is a potential scenario for price to make a bullish continuation towards the 1st resistance.
The 1st resistance level at 1.1064 is identified as a swing-high resistance that aligns with the 61.80% Fibonacci projection level. Higher up, the 2nd resistance level at 1.1139 is also noted as a swing-high resistance, suggesting a potential barrier for further upside movement.
To the downside, the 1st support level at 1.1006 is identified as an overlap support. Further below, the 2nd support level at 1.0933 is marked as a pullback support, further reinforcing its importance as a potential key support level.
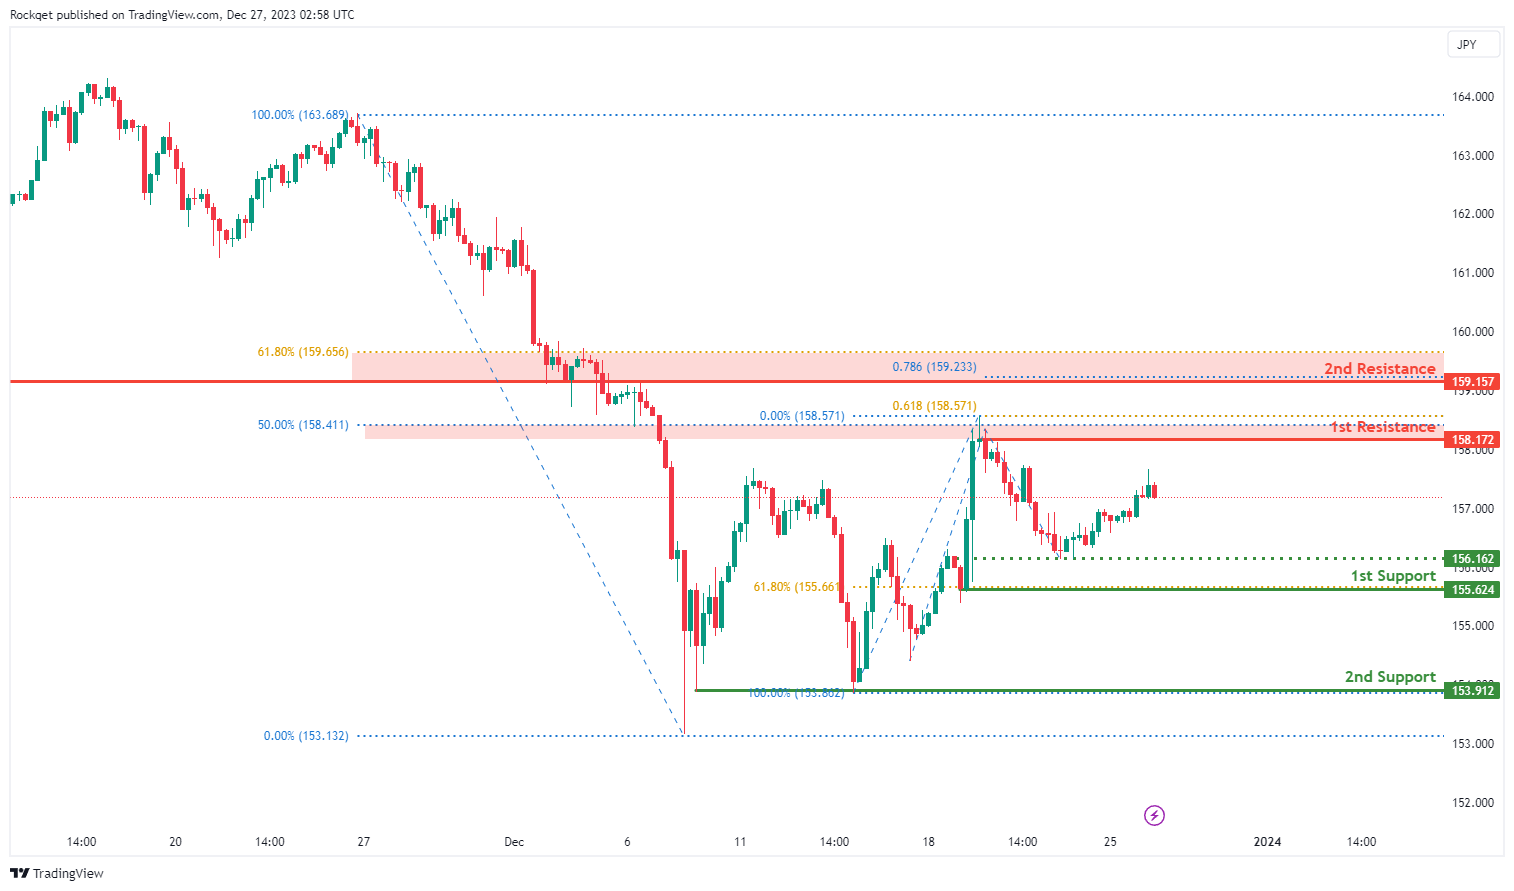
EUR/JPY:
The EUR/JPY chart currently exhibits a neutral overall momentum, suggesting a potential scenario for price fluctuation between the 1st resistance and 1st support levels.
The 1st support at 155.62 is identified as a pullback support, representing a historical area where buying interest has been present. This support level also aligns with the 61.80% Fibonacci Retracement, providing added significance to the support zone.
Additionally, the 2nd support at 153.91 is recognized as a multi-swing low support, contributing to the potential strength of the support area.
On the resistance side, the 1st resistance at 158.17 is linked to a swing high resistance and the 61.80% Fibonacci Projection, indicating a level where selling interest may intensify, potentially causing a temporary pause or reversal in the price movement.
Furthermore, the 2nd resistance at 159.16 is an overlap resistance and is associated with the 61.80% Fibonacci Retracement and the 78.60% Fibonacci Projection, providing formidable challenges for the price to overcome.
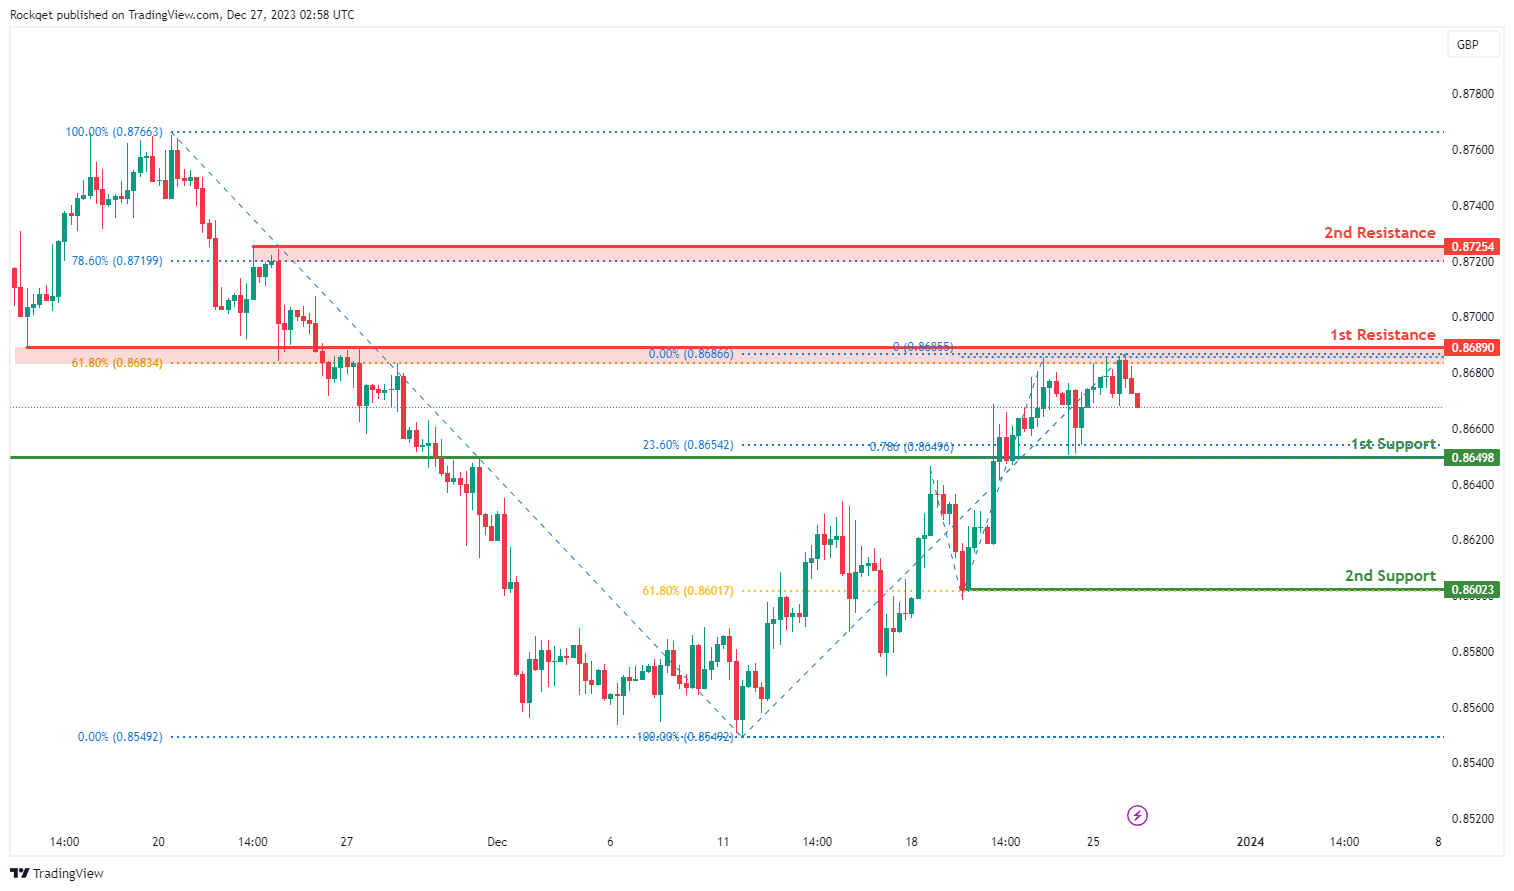
EUR/GBP:
The EUR/GBP chart currently indicates a bearish overall momentum, suggesting a potential scenario for a bearish continuation towards the 1st support.
The 1st support at 0.8650 is considered significant as it represents an overlap support and aligns with the 23.60% Fibonacci Retracement, indicating a historical area where buying interest has been present.
Additionally, the 2nd support at 0.8602 is identified as a pullback support and is associated with the 61.80% Fibonacci Retracement, providing an additional layer of potential support for the currency pair.
On the resistance side, the 1st resistance at 0.8689 is linked to an overlap resistance and the 61.80% Fibonacci Retracement, indicating a level where selling interest may intensify, potentially causing a temporary pause or reversal in the price movement.
Furthermore, the 2nd resistance at 0.8725 is a pullback resistance and is associated with the 78.60% Fibonacci Retracement, providing formidable challenges for the price to overcome.
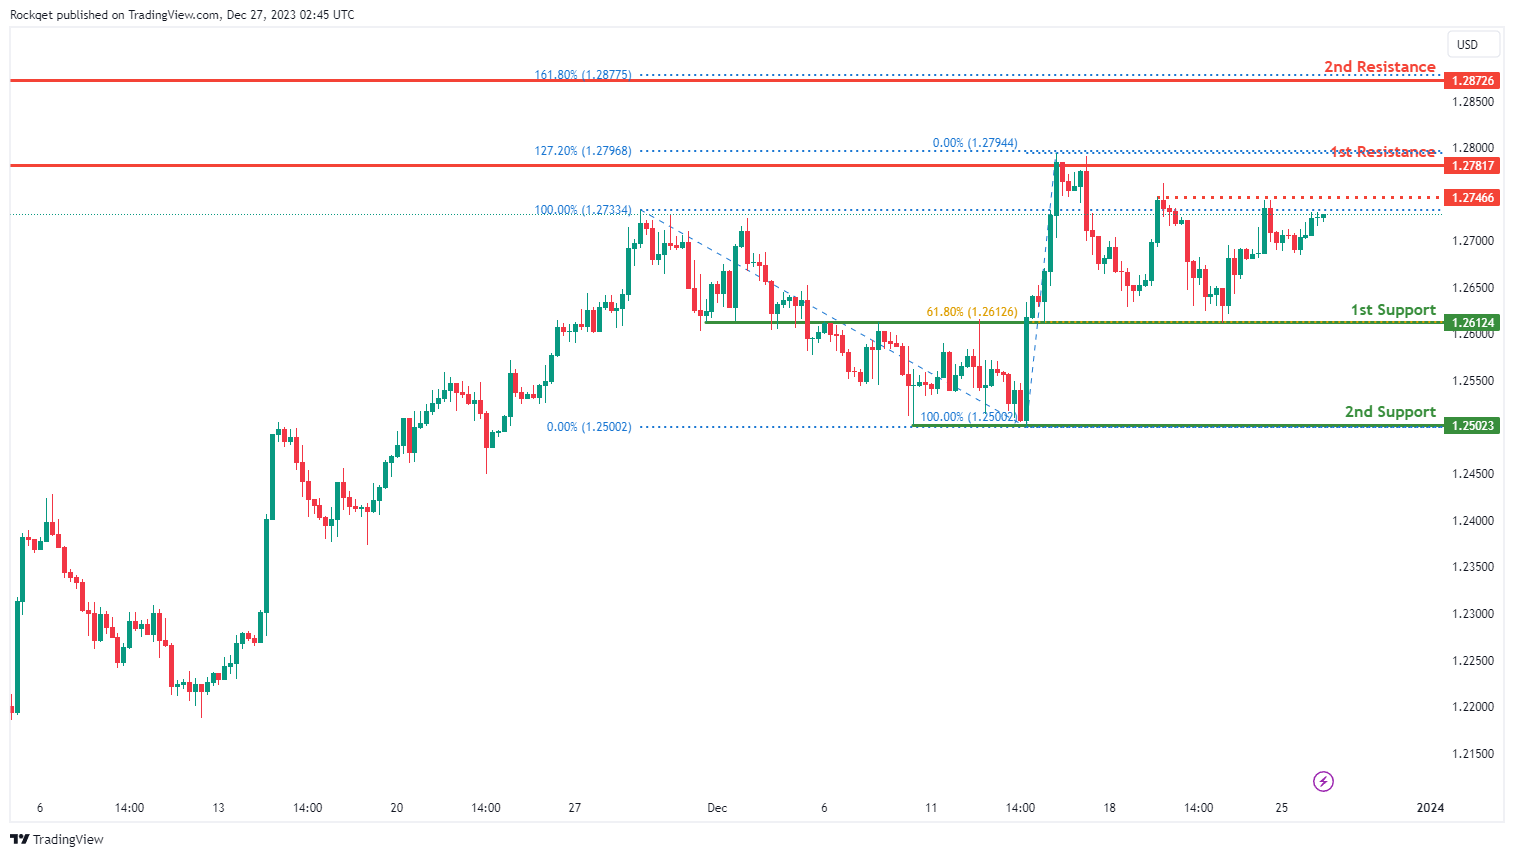
GBP/USD:
The GBP/USD chart currently exhibits a neutral bias. In this context, there is a potential scenario for price to fluctuate between the 1st support and the 1st resistance.
The 1st support level at 1.2612 is identified as an overlap support that aligns with the 61.80% Fibonacci retracement level. Further below, the 2nd support level at 1.2502 is marked as a swing-low support, further reinforcing its importance as a potential key support level.
To the upside, the intermediate resistance at 1.2746 is identified as a pullback support while the 1st resistance level at 1.2781 is identified as a multi-swing-high resistance that aligns with the 127.20% Fibonacci extension level. Higher up, the 2nd resistance level at 1.2872 is noted as a pullback resistance that aligns with the 161.80% Fibonacci extension level, suggesting a potential barrier for further upside movement.
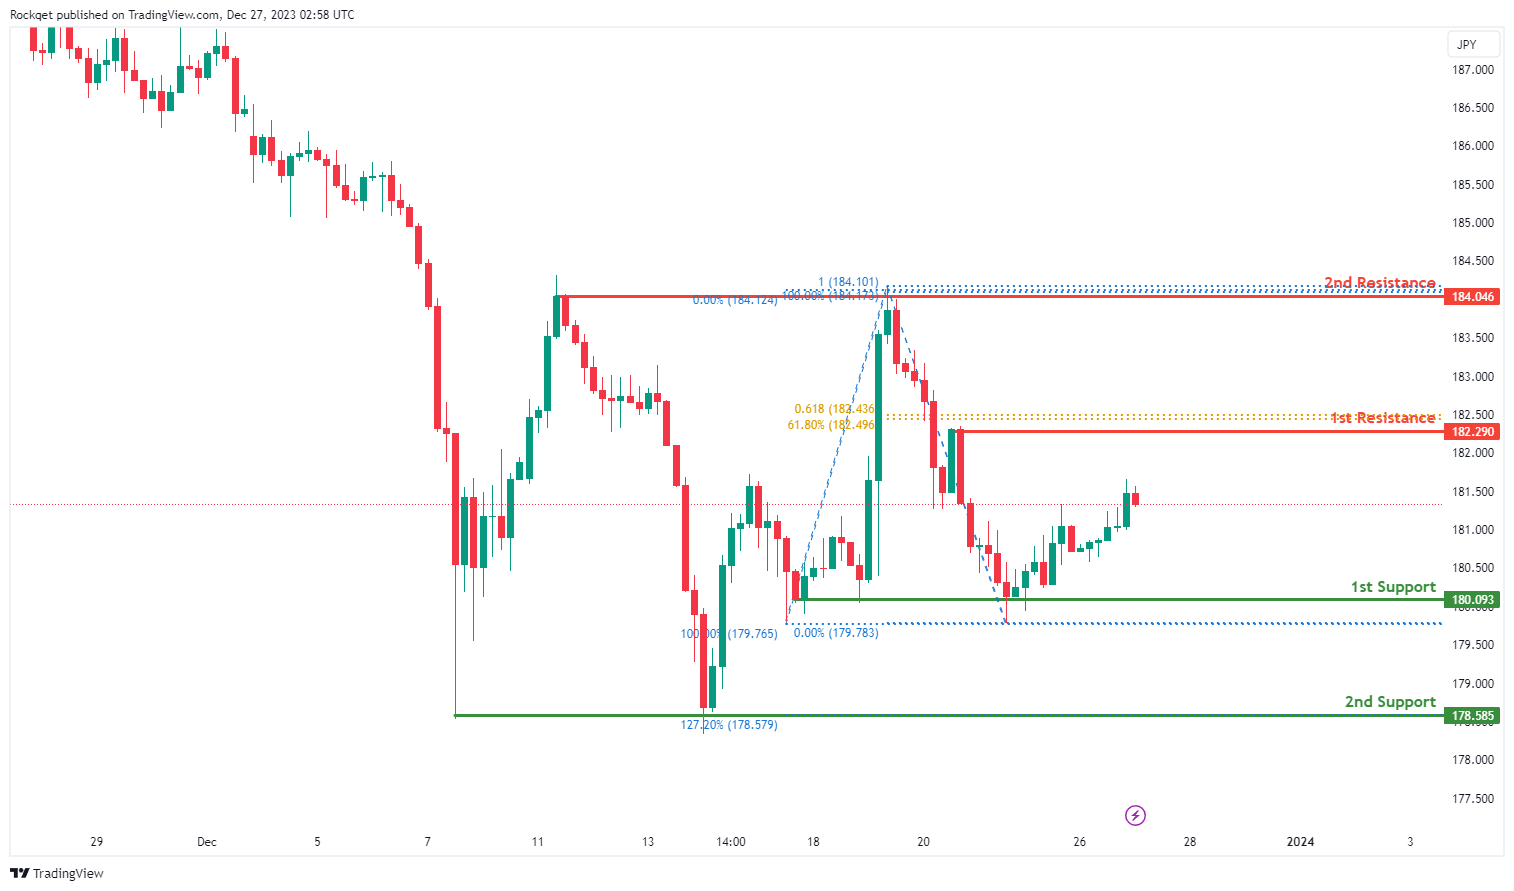
GBP/JPY:
The GBP/JPY chart currently shows a bullish overall momentum, indicating a potential scenario for a bullish continuation towards the 1st resistance.
The 1st support at 180.09 is considered significant as it represents a multi-swing low support, aligning with a Fibonacci projection. This level indicates a historical area where buying interest has been prominent.
Additionally, the 2nd support at 178.59 is identified as another multi-swing low support and is associated with the 127.20% Fibonacci Extension, providing an additional layer of potential support for the currency pair.
On the resistance side, the 1st resistance at 182.29 is linked to a pullback resistance and the 61.80% Fibonacci Projection and Retracement. This suggests a level where selling interest may intensify, potentially causing a temporary pause or reversal in the price movement.
Furthermore, the 2nd resistance at 184.05 represents a multi-swing high resistance, adding further challenges for the price to overcome in its bullish trajectory.
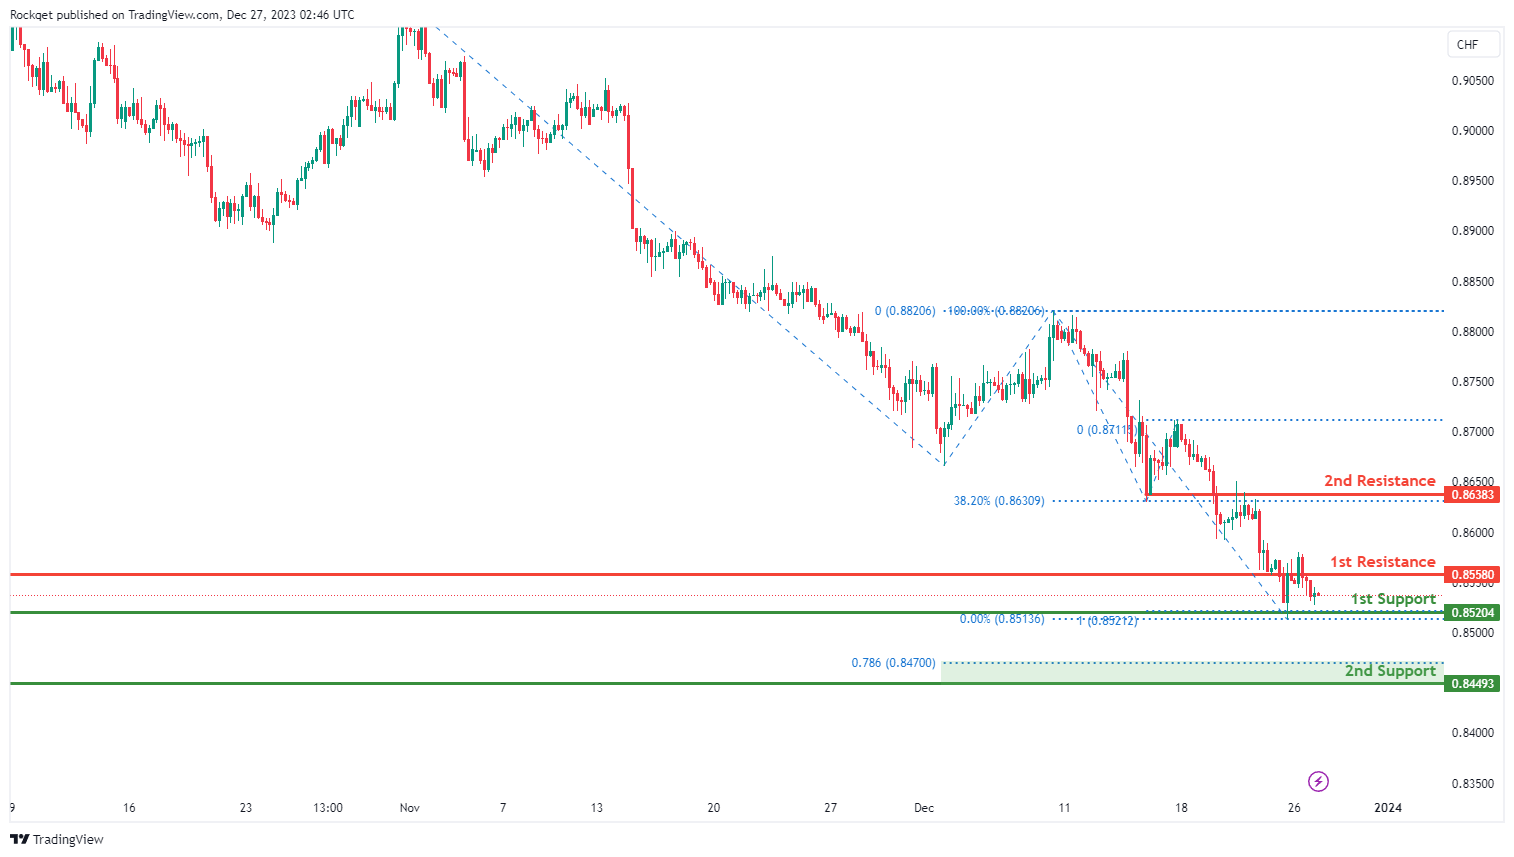
USD/CHF:
The USD/CHF chart currently exhibits an overall bearish momentum. In this context, there is a potential scenario for price to make a bearish continuation towards the 1st support.
The 1st support level at 0.8520 is identified as a multi-swing-low support that aligns with the 100.00% Fibonacci projection level. Further below, the 2nd support level at 0.8449 is noted as a swing-low support that aligns close to the 78.60% Fibonacci projection level, further reinforcing its importance as a key support level.
To the upside, the 1st resistance level at 0.8558 is identified as an overlap resistance. Higher up, the 2nd resistance level at 0.8638 is also marked as an overlap resistance that aligns with the 38.20% Fibonacci retracement level, suggesting a potential barrier for further upside movement.
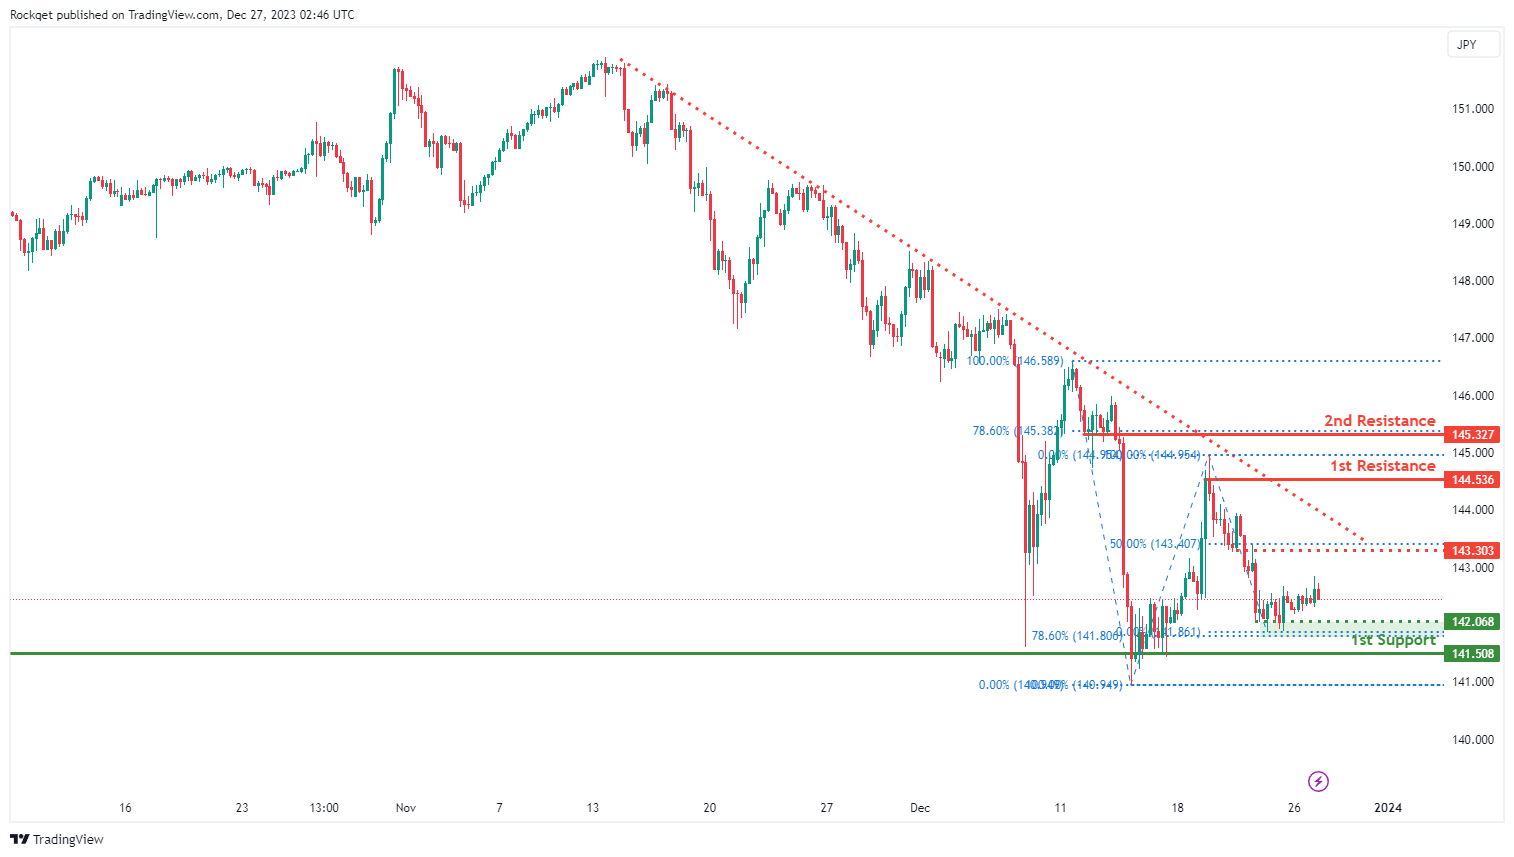
USD/JPY:
The USD/JPY chart currently exhibits an overall bearish momentum. In this context, there is a potential for price to break under the intermediate support and drop towards the 1st support.
The intermediate support level at 142.06 is identified as a pullback support that aligns close to the 78.60% Fibonacci retracement level. Further below, the 1st support level at 141.50 is noted as a multi-swing-low support, further reinforcing its importance as a key support level.
To the upside, the intermediate resistance level at 143.30 is identified as a pullback resistance that aligns with the 50.00% Fibonacci retracement level while the 1st resistance level at 144.53 is noted as a swing-high resistance. Higher up, the 2nd resistance level at 145.32 is marked as a pullback resistance that aligns with the 78.60% Fibonacci retracement level, suggesting a potential barrier for further upside movement.
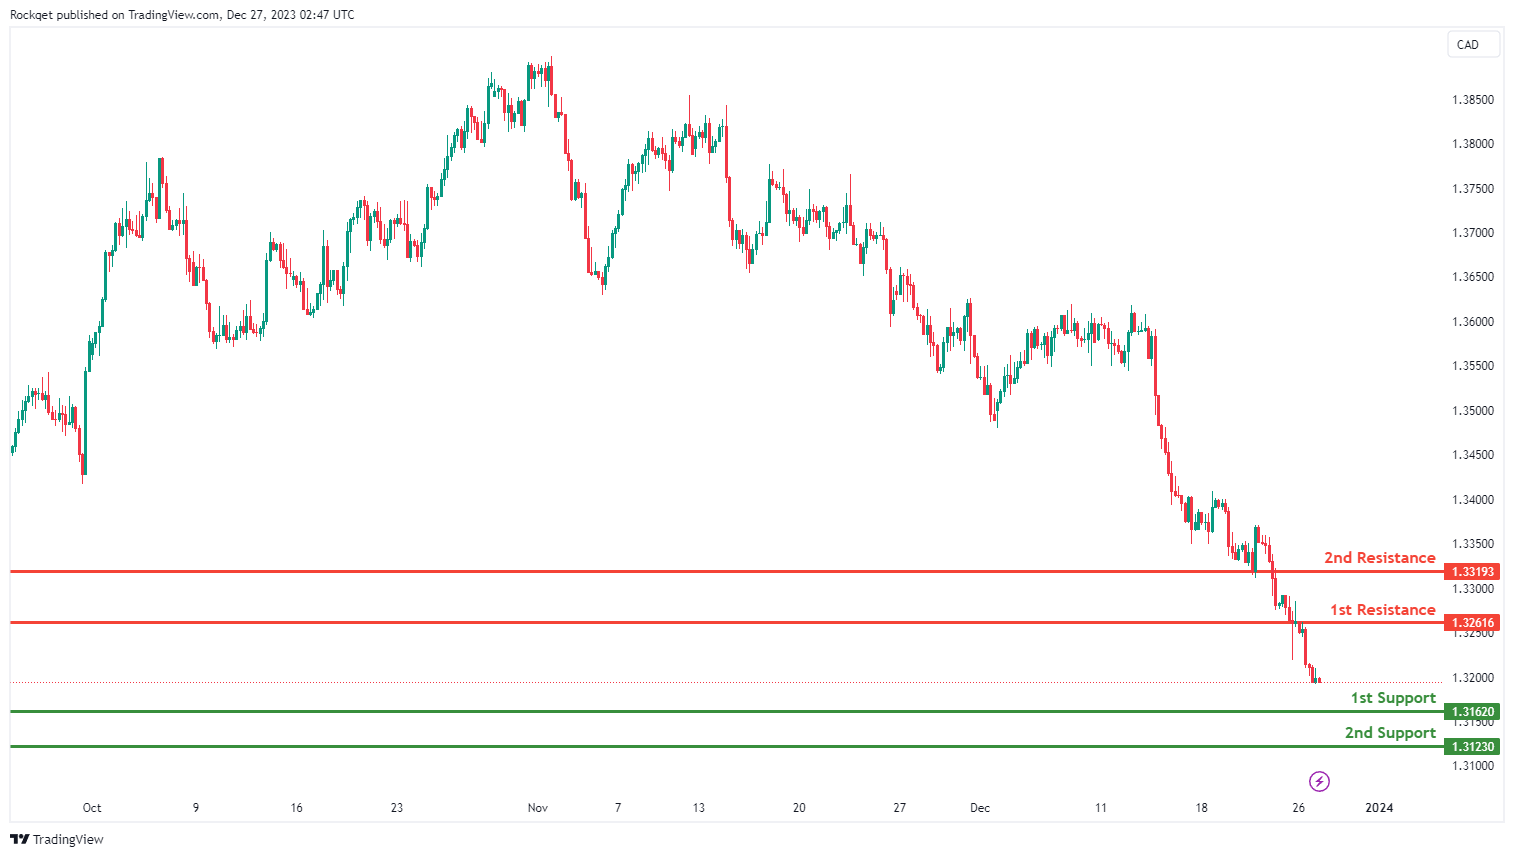
USD/CAD:
The USD/CAD chart currently exhibits an overall bearish momentum. In this context, there is a potential scenario for price to make a bearish continuation towards the 1st support.
The 1st support level at 1.3162 is identified as a multi-swing-low support. Further below, the 2nd support level at 1.3123 is noted as a swing-low support, further reinforcing its importance as a key support level.
To the upside, the 1st resistance level at 1.3261 is identified as an overlap resistance. Higher up, the 2nd resistance level at 1.3319 is marked as a pullback resistance, suggesting a potential barrier for further upside movement.
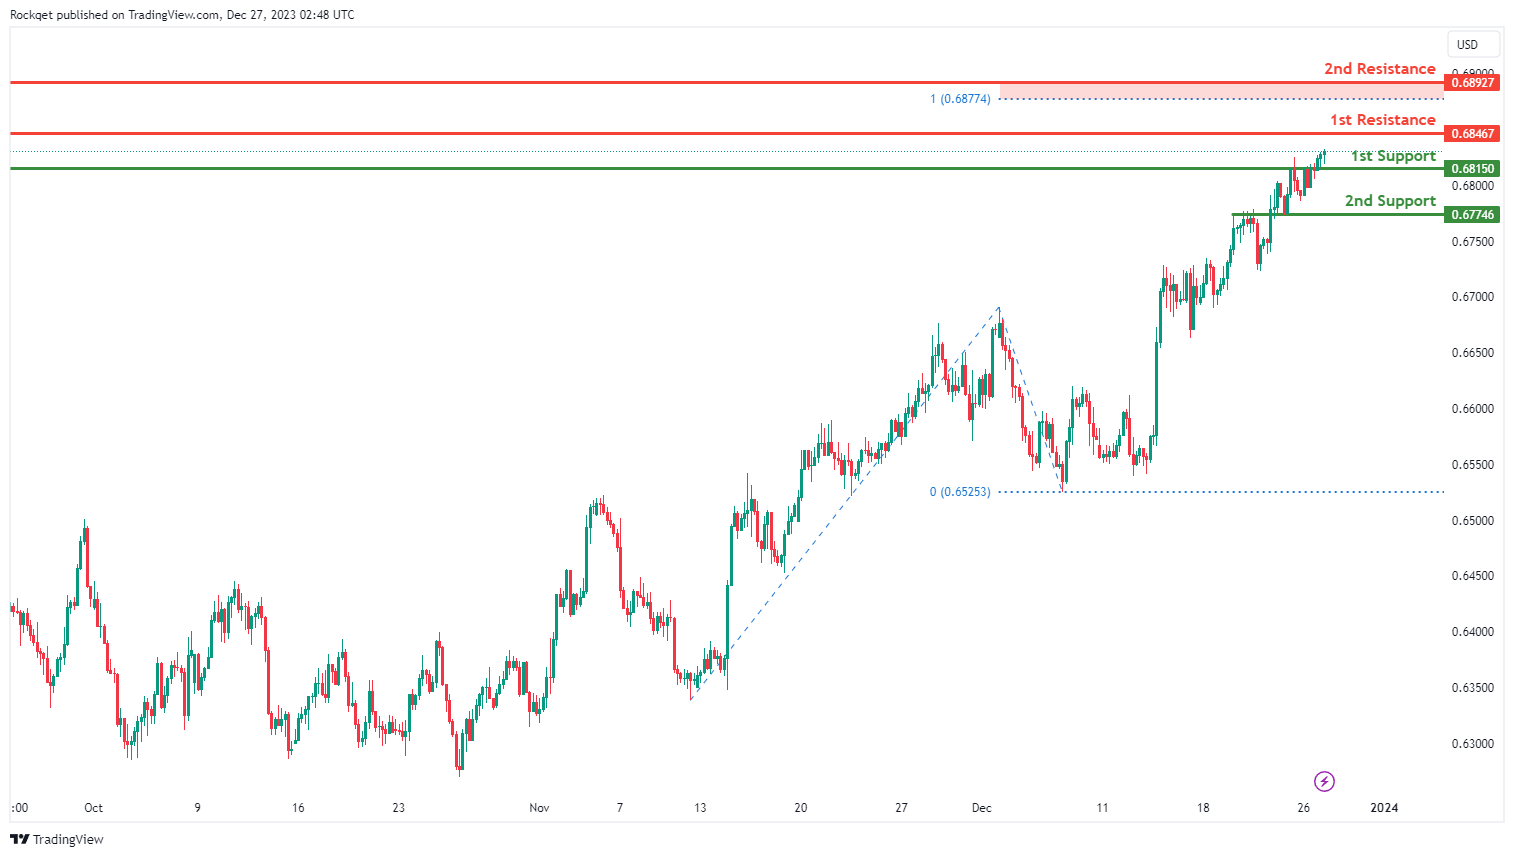
AUD/USD:
The AUD/USD chart currently exhibits an overall bullish momentum. In this context, there is a potential scenario for price to make a bullish continuation towards the 1st resistance.
The 1st resistance level at 0.6846 is identified as a swing-high resistance. Higher up, the 2nd resistance level at 0.6892 is noted as a multi-swing-high resistance that aligns close to the 100.00% Fibonacci projection level, indicating its potential significance as a barrier for further upward movement.
To the downside, the 1st support level at 0.6815 is identified as an overlap support. Further below, the 2nd support level at 0.6774 is also marked as an overlap support, further reinforcing its importance as a key support level.
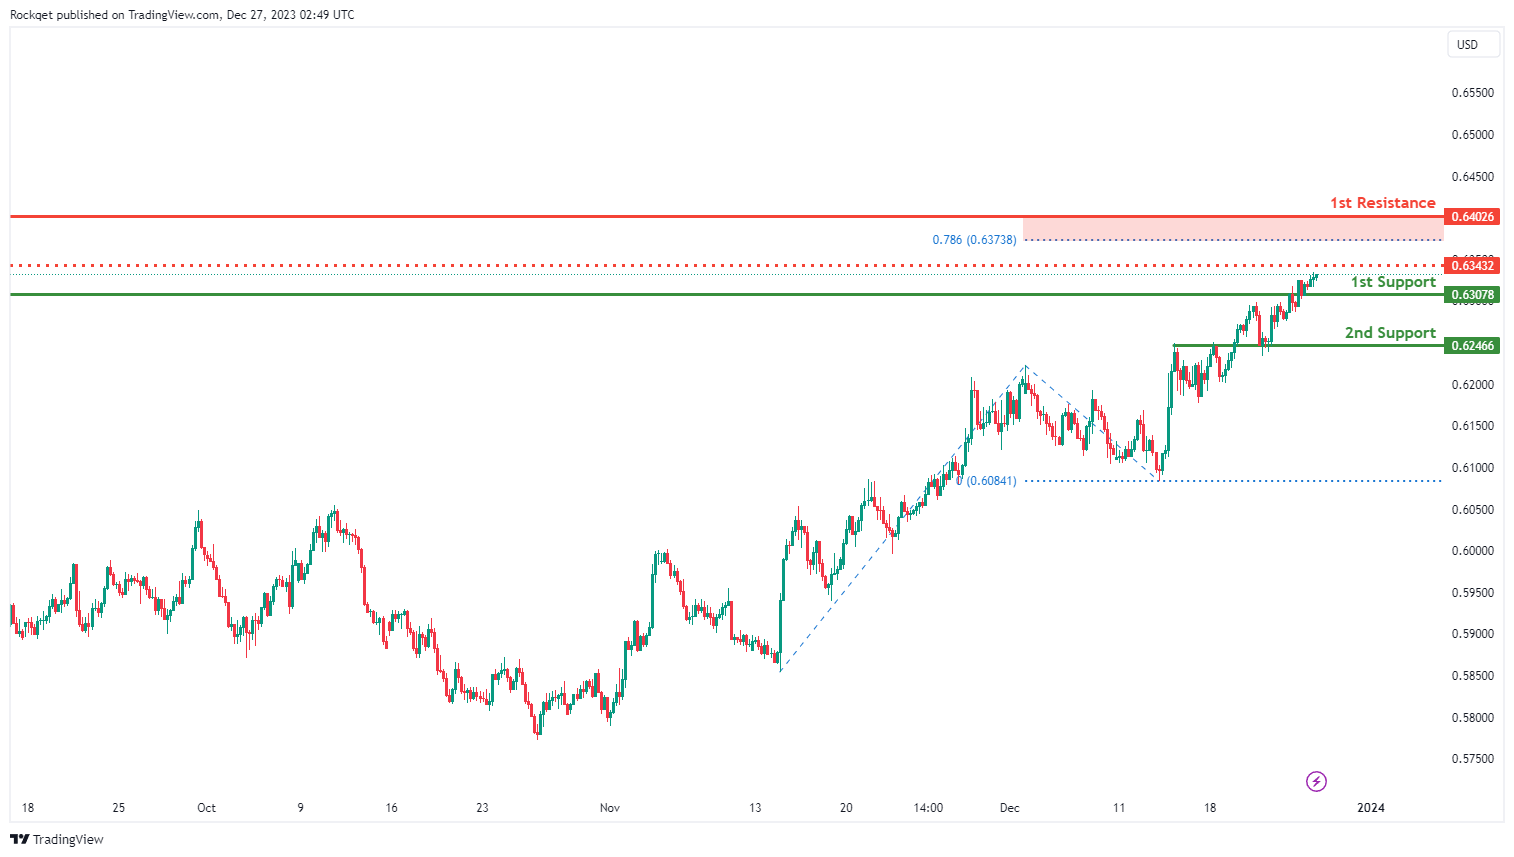
NZD/USD
The NZD/USD chart currently exhibits an overall bullish momentum. In this context, there is a potential scenario for price to make a bullish continuation towards the 1st resistance.
The intermediate resistance level at 0.6343 is identified as a pullback resistance. Higher up, the 1st resistance level at 0.6402 is marked as a swing-high resistance that aligns close to the 78.60% Fibonacci projection level, indicating its potential significance as a barrier for further upward movement.
To the downside, the 1st support level at 0.6307 is identified as an overlap support. Further below, the 2nd support level at 0.6246 is also noted as an overlap support, further reinforcing its importance as a key support level.
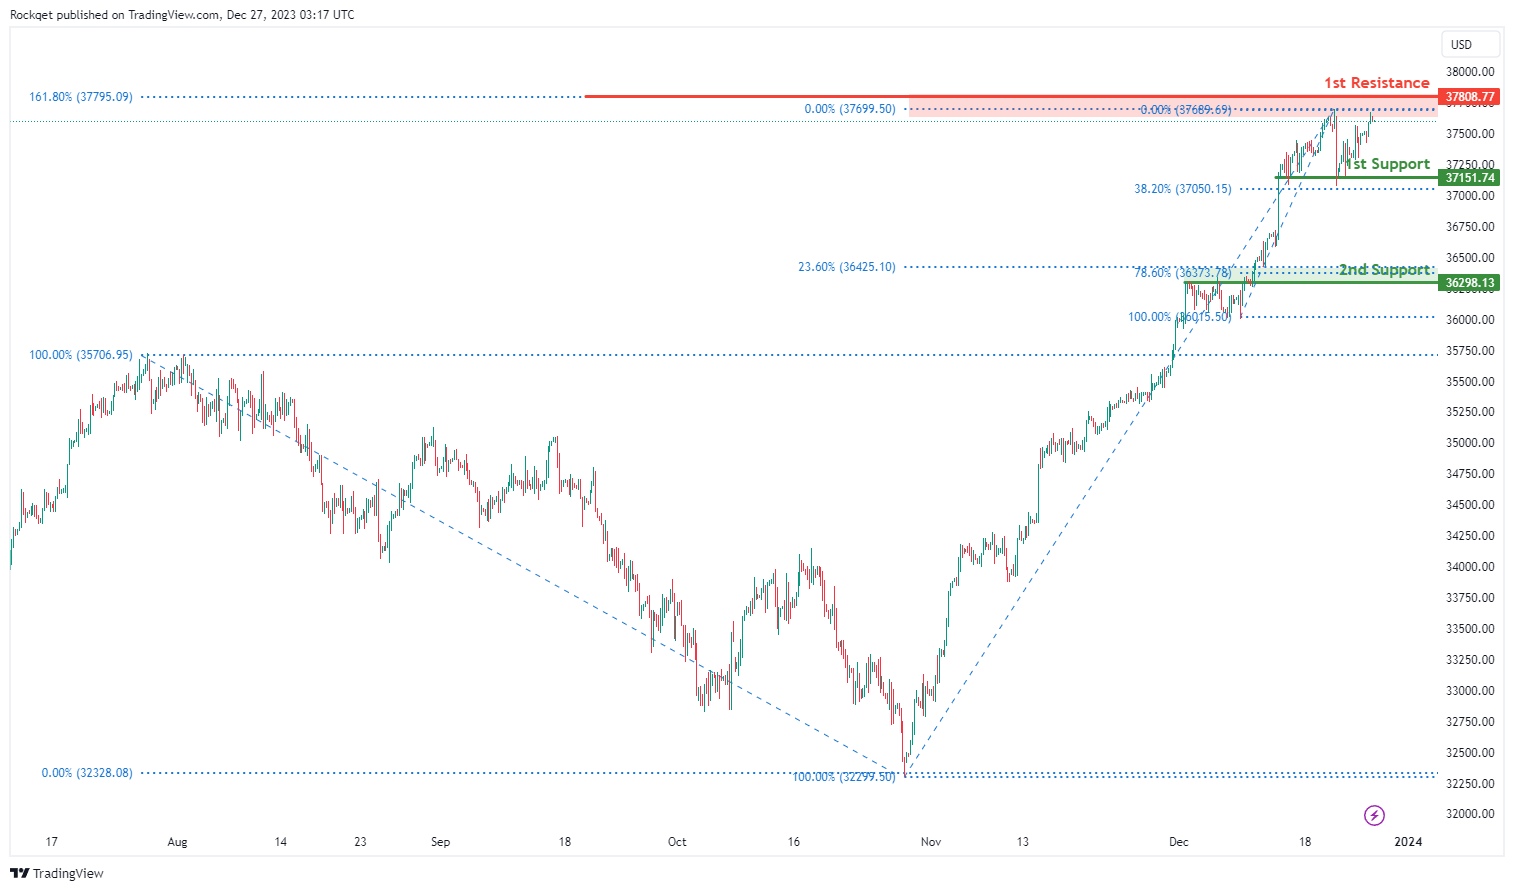
DJ30:
The DJ30 chart currently exhibits a bullish overall momentum, suggesting a potential scenario for a bullish continuation towards the 1st resistance.
The 1st support at 37151.74 is considered significant as it represents an overlap support and is associated with the 38.20% Fibonacci Retracement. This level indicates a historical area where buying interest has been present and adds a layer of potential support to the chart.
Additionally, the 2nd support at 36298.13 is identified as another overlap support and is associated with the 23.60% Fibonacci Retracement and the 78.60% Fibonacci Retracement, providing additional layers of potential support for the index.
On the resistance side, the 1st resistance at 37808.77 is linked to the 161.80% Fibonacci Extension, indicating a level where selling interest could intensify. This level represents a potential target for traders expecting a bullish continuation.
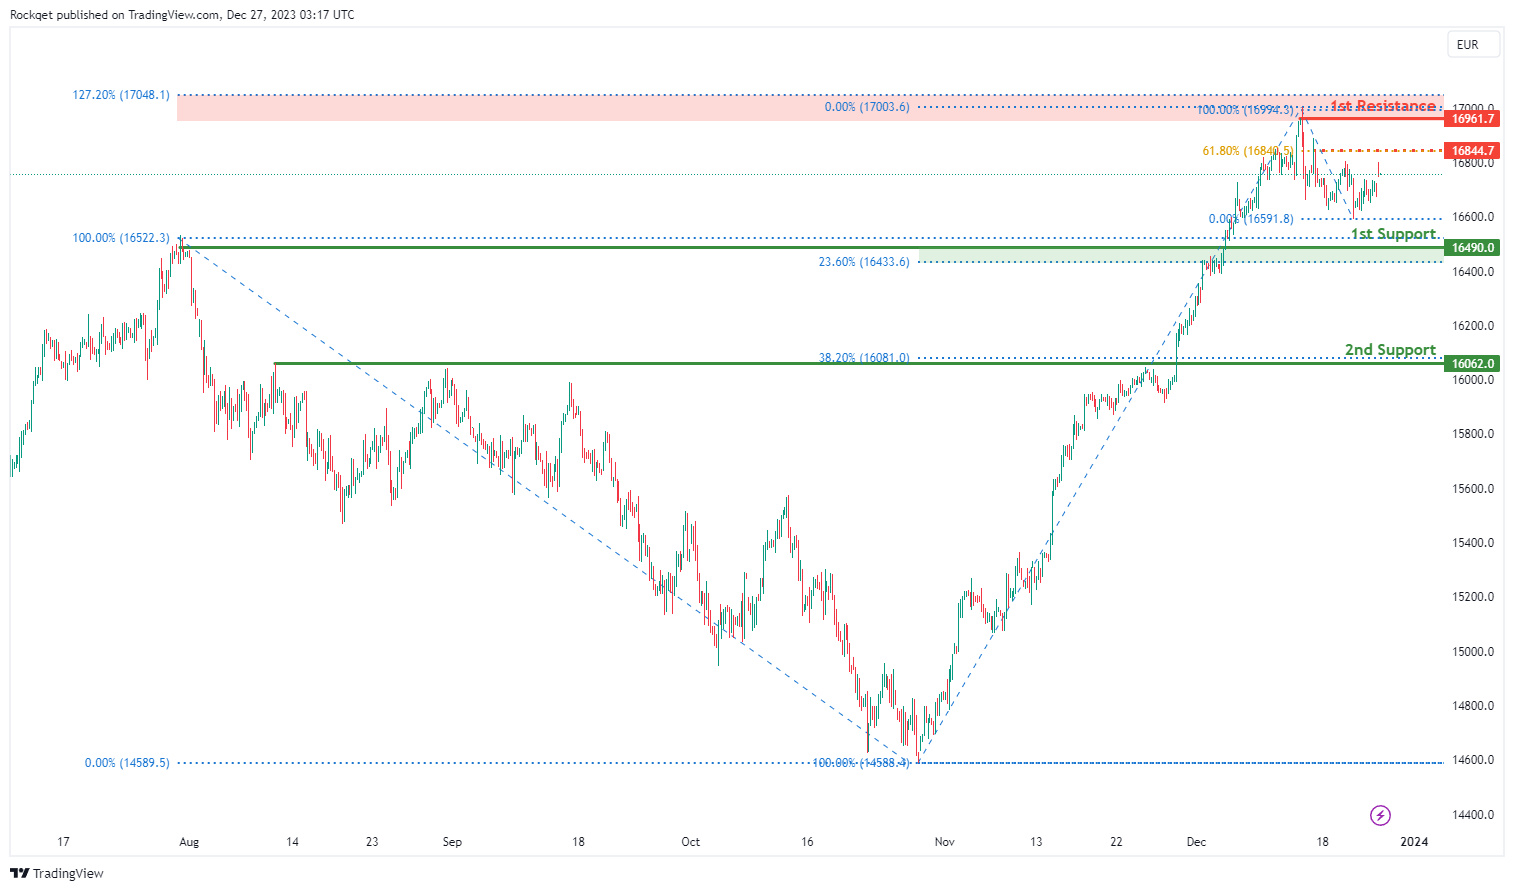
GER40:
The GER40 chart currently exhibits a weak bullish overall momentum with low confidence, suggesting a potential bullish continuation towards the 1st resistance.
The 1st support at 16490.00 is considered significant as it represents an overlap support and is associated with the 23.60% Fibonacci Retracement, indicating a historical area where buying interest has been present.
Additionally, the 2nd support at 16062.00 is identified as pullback support and is linked to the 38.20% Fibonacci Retracement, providing an additional layer of potential support for the index.
On the resistance side, the intermediate resistance at 16844.70 is associated with pullback resistance and the 61.80% Fibonacci Retracement, possibly acting as a barrier for further upward movement.
The 1st resistance at 16961.70 is marked as a swing high resistance and is correlated with the 127.20% Fibonacci Extension, serving as a potential target for bullish continuation.
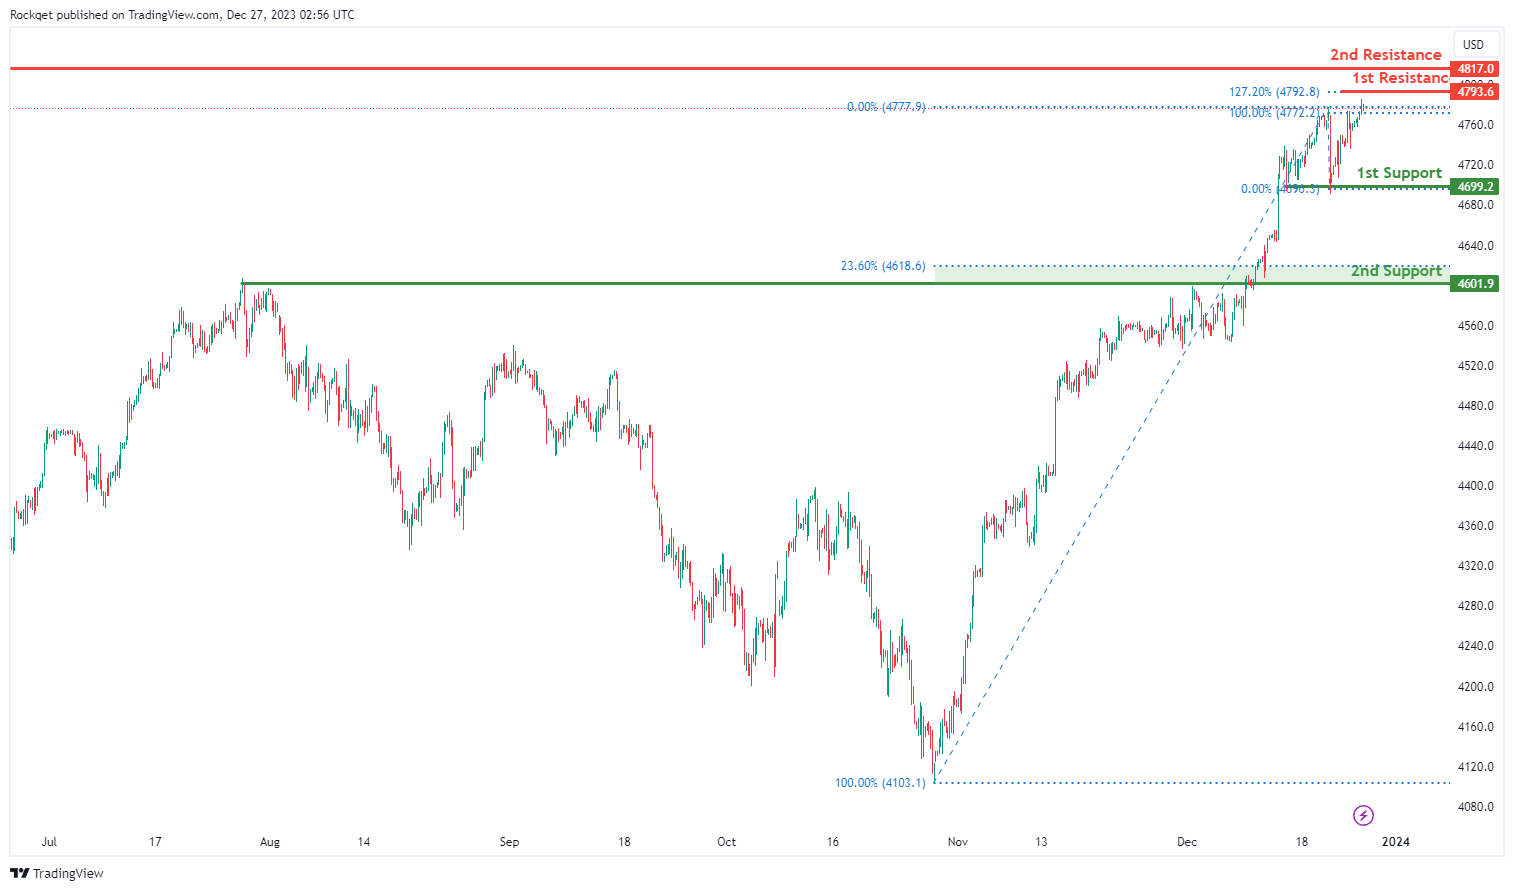
US500:
The US500 chart currently exhibits a bullish overall momentum, indicating a potential scenario for a bullish continuation towards the 1st resistance.
The 1st support at 4699.2 is considered significant as it represents a multi-swing low support, suggesting a historical area where buying interest has been present.
Additionally, the 2nd support at 4601.9 is identified as an overlap support and is associated with the 23.60% Fibonacci Retracement, providing an additional layer of potential support for the index.
On the resistance side, the 1st resistance at 4793.6 is linked to the 127.20% Fibonacci Extension, indicating a level where selling interest could intensify.
Furthermore, the 2nd resistance at 4817.0 is marked as a swing high resistance and is correlated with the 161.80% Fibonacci Extension, serving as a potential target for bullish continuation.
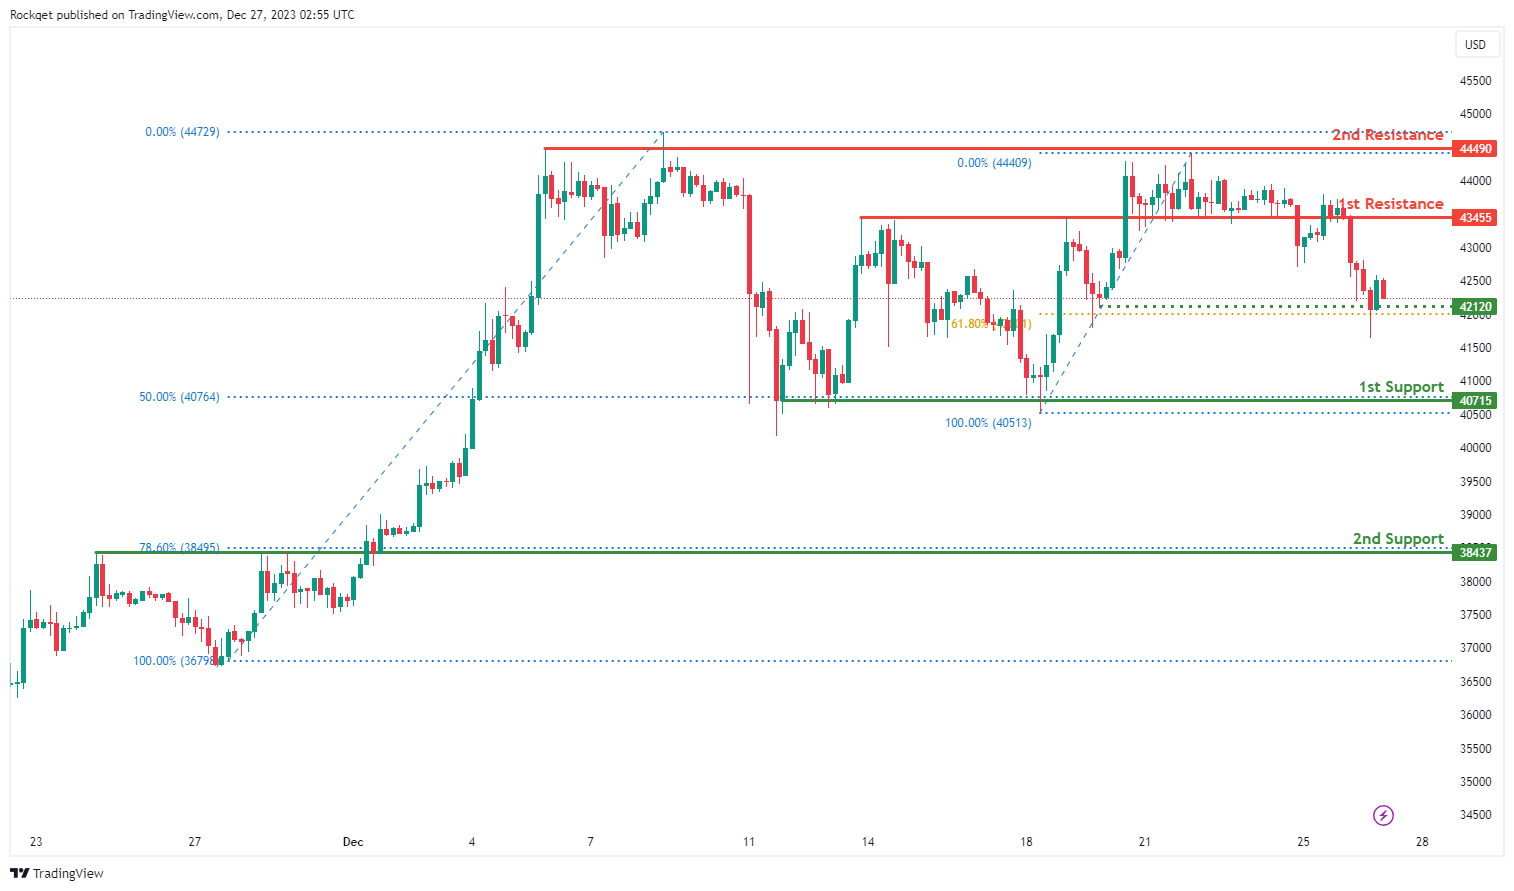
BTC/USD:
The BTC/USD chart currently displays a neutral overall momentum, suggesting a potential scenario for price to fluctuate between the 1st resistance and 1st support levels.
The 1st support at 40715 is considered significant as it represents a swing low support, indicating a historical area where buying interest has been present.
Additionally, the 2nd support at 38437 is identified as an overlap support and is associated with the 78.60% Fibonacci Retracement, providing an additional layer of potential support for the cryptocurrency.
On the resistance side, the 1st resistance at 43455 is marked as an overlap resistance, representing a level where selling interest could emerge.
Furthermore, the 2nd resistance at 44490 is associated with multi-swing high resistance, presenting a potential barrier for upward movement.
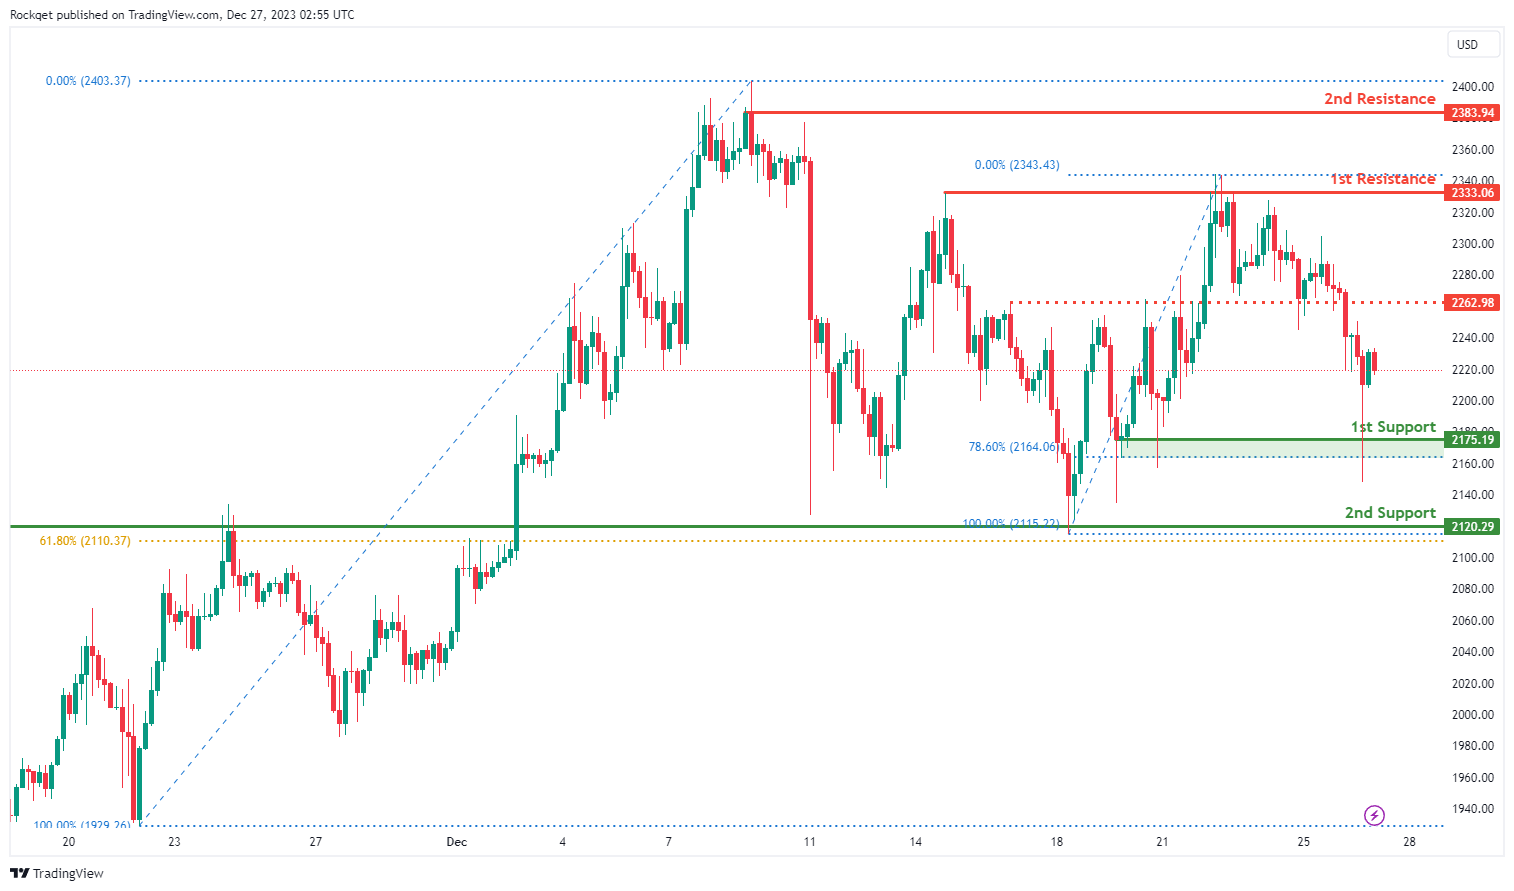
ETH/USD:
The ETH/USD chart currently exhibits a bullish overall momentum, suggesting a potential scenario for a bullish continuation towards the 1st resistance.
The 1st support at 2175.19 is considered significant as it represents a pullback support and is associated with the 78.60% Fibonacci Retracement, indicating a historical area where buying interest has been present.
Additionally, the 2nd support at 2120.29 is identified as a swing low support and is associated with the 61.80% Fibonacci Retracement, providing an additional layer of potential support for the cryptocurrency.
On the resistance side, the 1st resistance at 2333.06 is marked as a swing high resistance, representing a level where selling interest could intensify.
Furthermore, the 2nd resistance at 2383.94 is associated with another swing high resistance, presenting a potential barrier for upward movement. The intermediate resistance at 2262.98 is identified as an overlap resistance, further contributing to the potential bullish scenario.
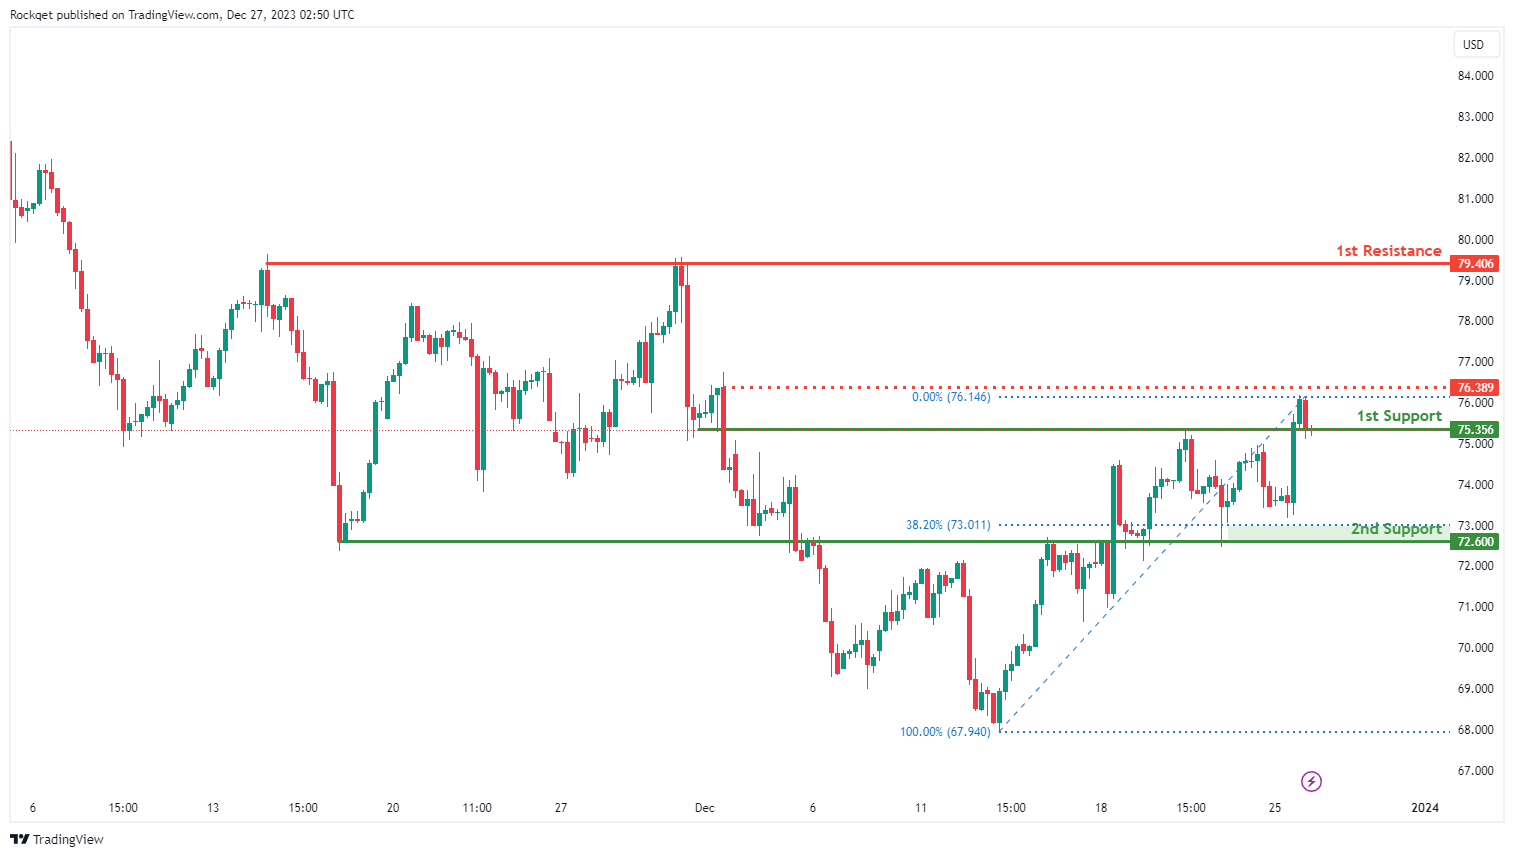
WTI/USD:
The WTI chart currently exhibits an overall bullish momentum, suggesting a prevailing uptrend. However, there is a potential scenario for price to fall towards the 1st support before resuming the uptrend.
The 1st support level at 75.35 is identified as an overlap support. Further below, the 2nd support level at 72.60 is also marked as an overlap support that aligns close to the 38.20% Fibonacci retracement level, reinforcing its importance as a key support level.
To the upside, the intermediate resistance level at 76.38 is identified as a pullback resistance. Higher up, the 1st resistance level at 79.40 is noted as a multi-swing-high resistance, further indicating its potential significance as a barrier for further upward movement.
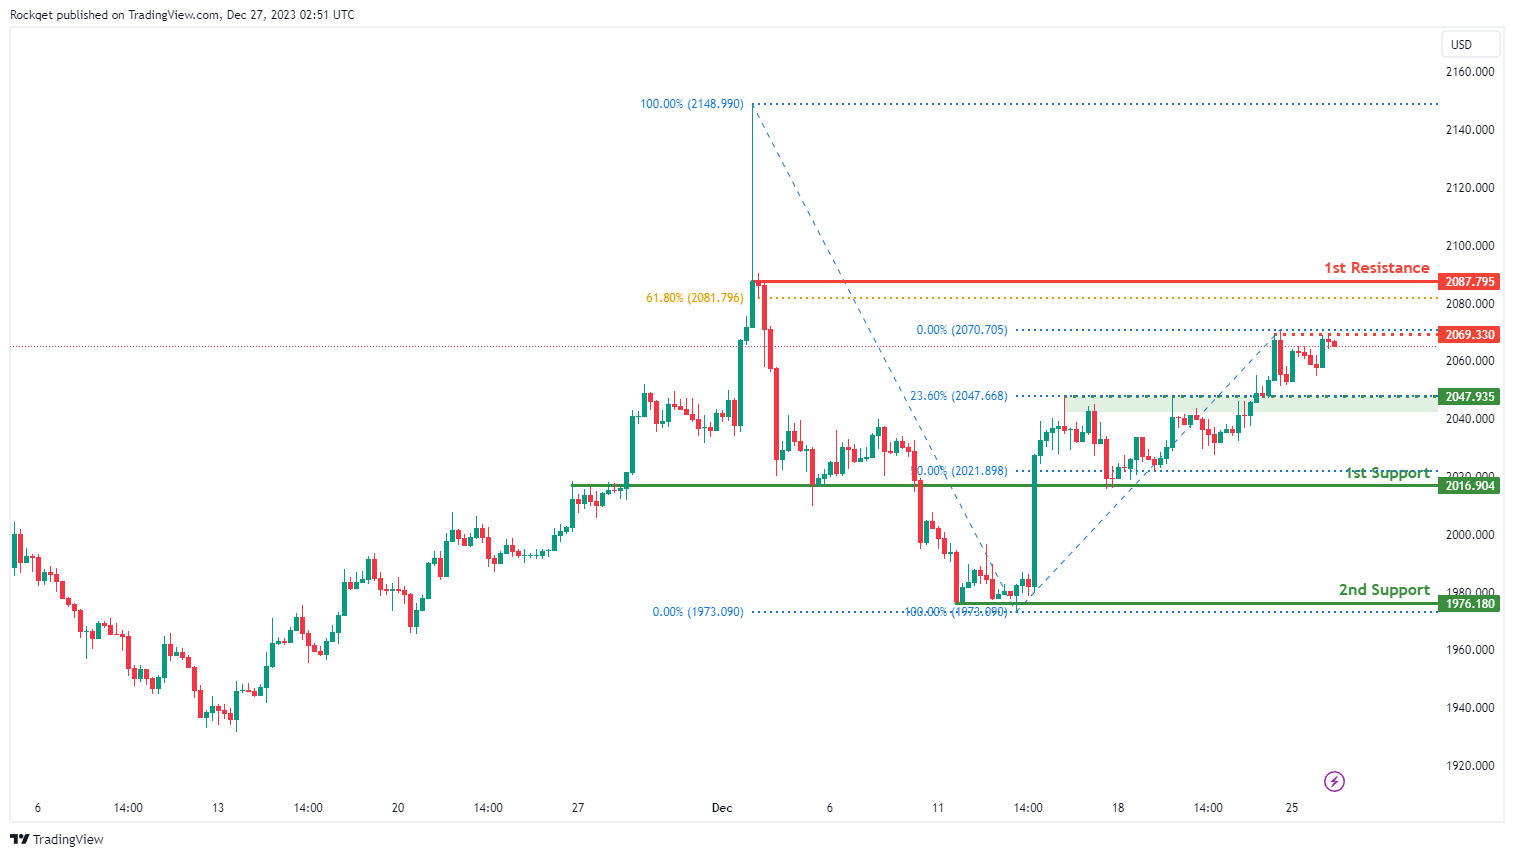
XAU/USD (GOLD):
The XAU/USD chart currently demonstrates a bullish momentum, indicating a potential for price to break above the intermediate resistance and make a bullish continuation towards the 1st resistance.
The intermediate resistance level at 2,069.33 is identified as a pullback resistance. Higher up, the 1st resistance level at 2,087.79 is also marked as a pullback resistance that aligns close to the 61.80% Fibonacci retracement level, further indicating its potential significance as a barrier for further upward movement.
To the downside, the intermediate support level at 2,047.93 is identified as a pullback support that aligns with the 23.60% Fibonacci retracement level while the 1st support level at 2,016.90 is marked as an overlap support that aligns close to the 50.00% Fibonacci retracement level. Further below, the 2nd support level at 1,976.18 is noted as a pullback support, reinforcing its importance as a key support level.


