
DXY:
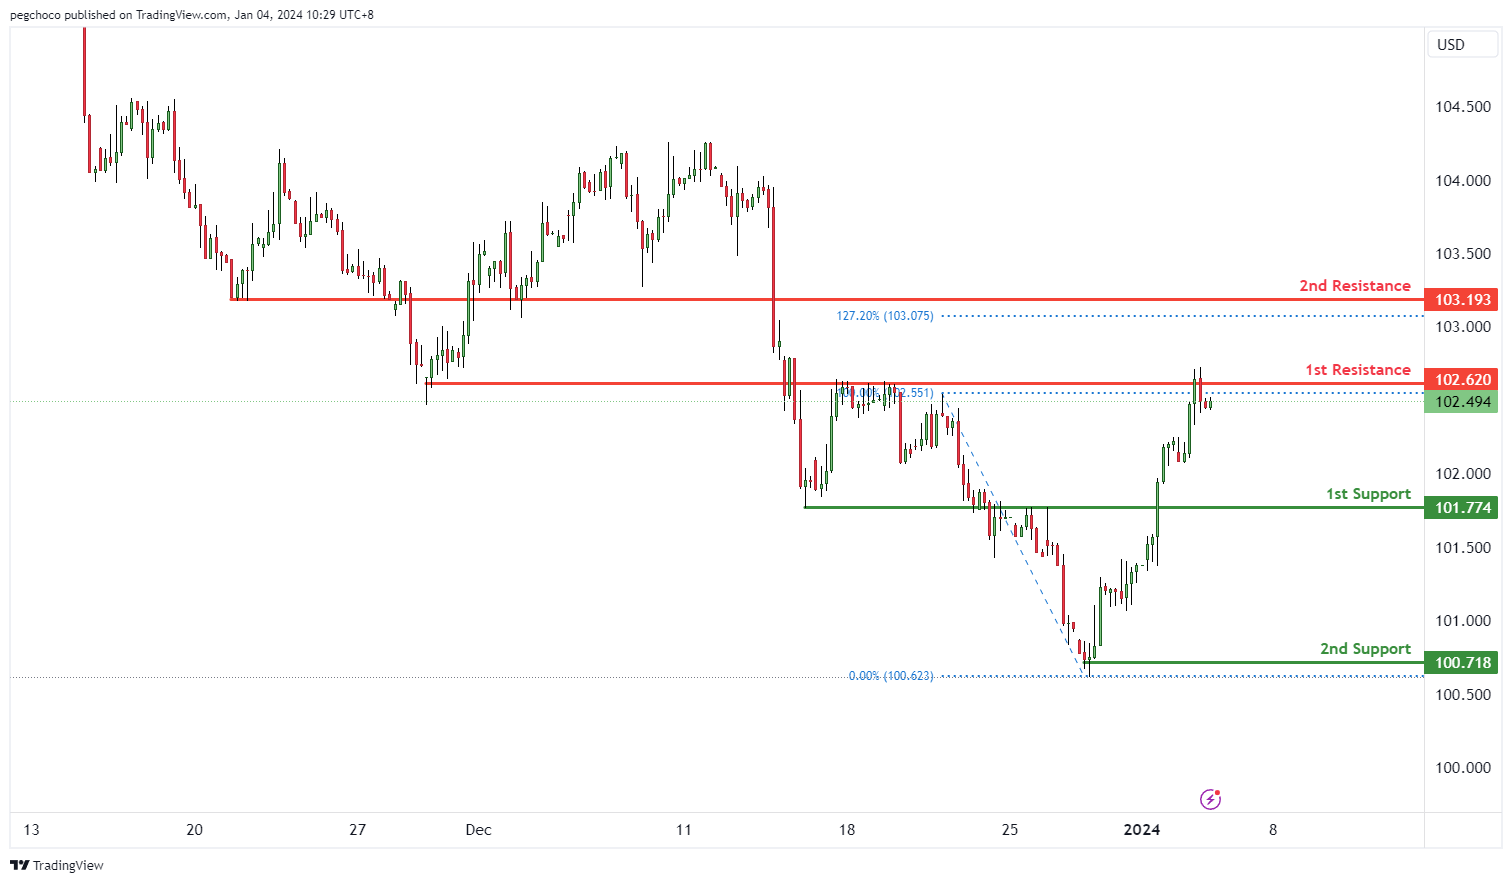
The DXY (US Dollar Index) chart currently has a bullish overall momentum, suggesting that the US Dollar is exhibiting strength. In the short term, there’s potential for a bullish bounce off the 1st support level, with an aim to move towards the 1st resistance.
The 1st support at 101.77 is categorized as a pullback support. This level is significant as it suggests a potential area where buying interest may emerge, providing temporary support for the DXY.
The 2nd support at 100.71 is identified as a swing low support, further reinforcing its significance as a potential support zone.
On the resistance side, the 1st resistance at 102.62 is categorized as an overlap resistance. This level may act as a substantial barrier where selling interest could intensify, potentially slowing down or reversing the bullish momentum.
The 2nd resistance at 103.16 is noted as a pullback resistance and is associated with the 127.20% Fibonacci Extension. This level adds to the confluence of resistance, making it a potentially strong point of resistance for the DXY in the short term.
EUR/USD:
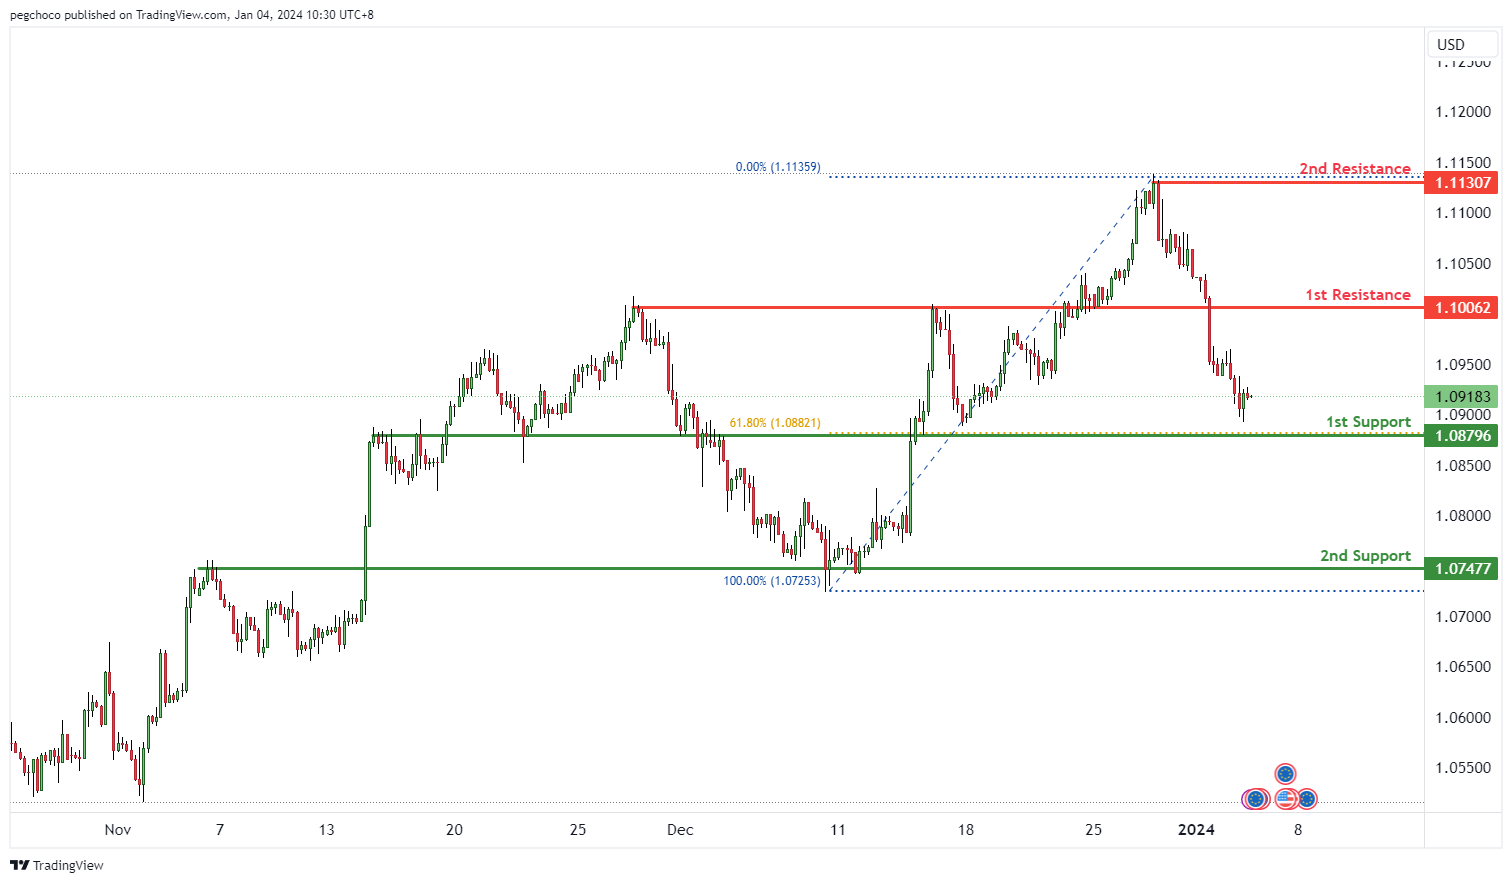
The EUR/USD chart currently has a bearish overall momentum, suggesting that the Euro is weaker compared to the US Dollar. In the short term, there’s potential for a rise towards the 1st resistance level before a reversal and a drop towards the 1st support.
The 1st support at 1.0879 is categorized as a pullback support and is associated with the 61.80% Fibonacci Retracement. This level is significant as it suggests a potential area where buying interest may emerge, providing temporary support for the EUR/USD.
The 2nd support at 1.0747 is identified as an overlap support, further reinforcing its significance as a potential support zone.
On the resistance side, the 1st resistance at 1.1006 is categorized as a pullback resistance. This level may act as a substantial barrier where selling interest could intensify, potentially triggering a bearish reversal in the short term.
The 2nd resistance at 1.1130 is noted as a swing high resistance. Swing highs often mark points of reversal or resistance in the price movement.
EUR/JPY:
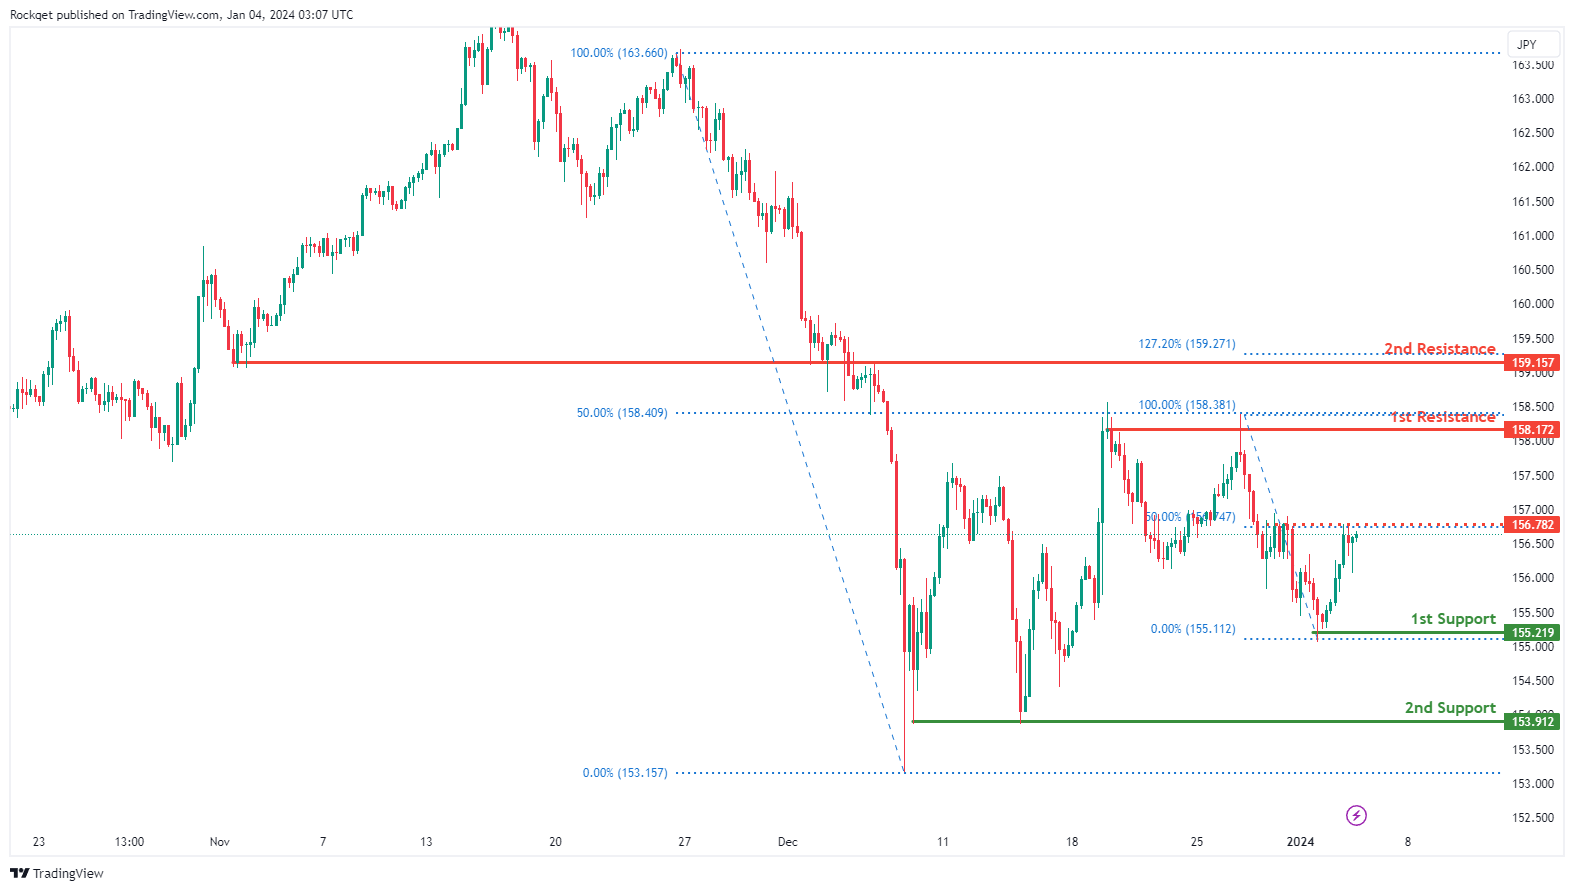
The EUR/JPY chart currently displays a bullish overall momentum, indicating an upward trend. There is a potential scenario for a bullish continuation towards the 1st resistance.
The 1st support at 155.22 is considered advantageous as it represents a pullback support, indicating a historical level where buying interest has emerged.
The 2nd support at 153.91 is recognized as a multi-swing low support, adding further significance to this level as a potential area for buyers to step in.
On the resistance side, the 1st resistance at 158.17 is identified as a swing high resistance, suggesting a level where selling interest may materialize. The 50% Fibonacci Retracement adds confluence to the strength of this resistance level.
The 2nd resistance at 159.16 is marked as an overlap resistance, and the 127.20% Fibonacci Extension enhances the significance of this potential barrier.
An intermediate resistance level at 156.78 is noteworthy as a pullback resistance, with the added confluence of the 50% Fibonacci Retracement.
EUR/GBP:
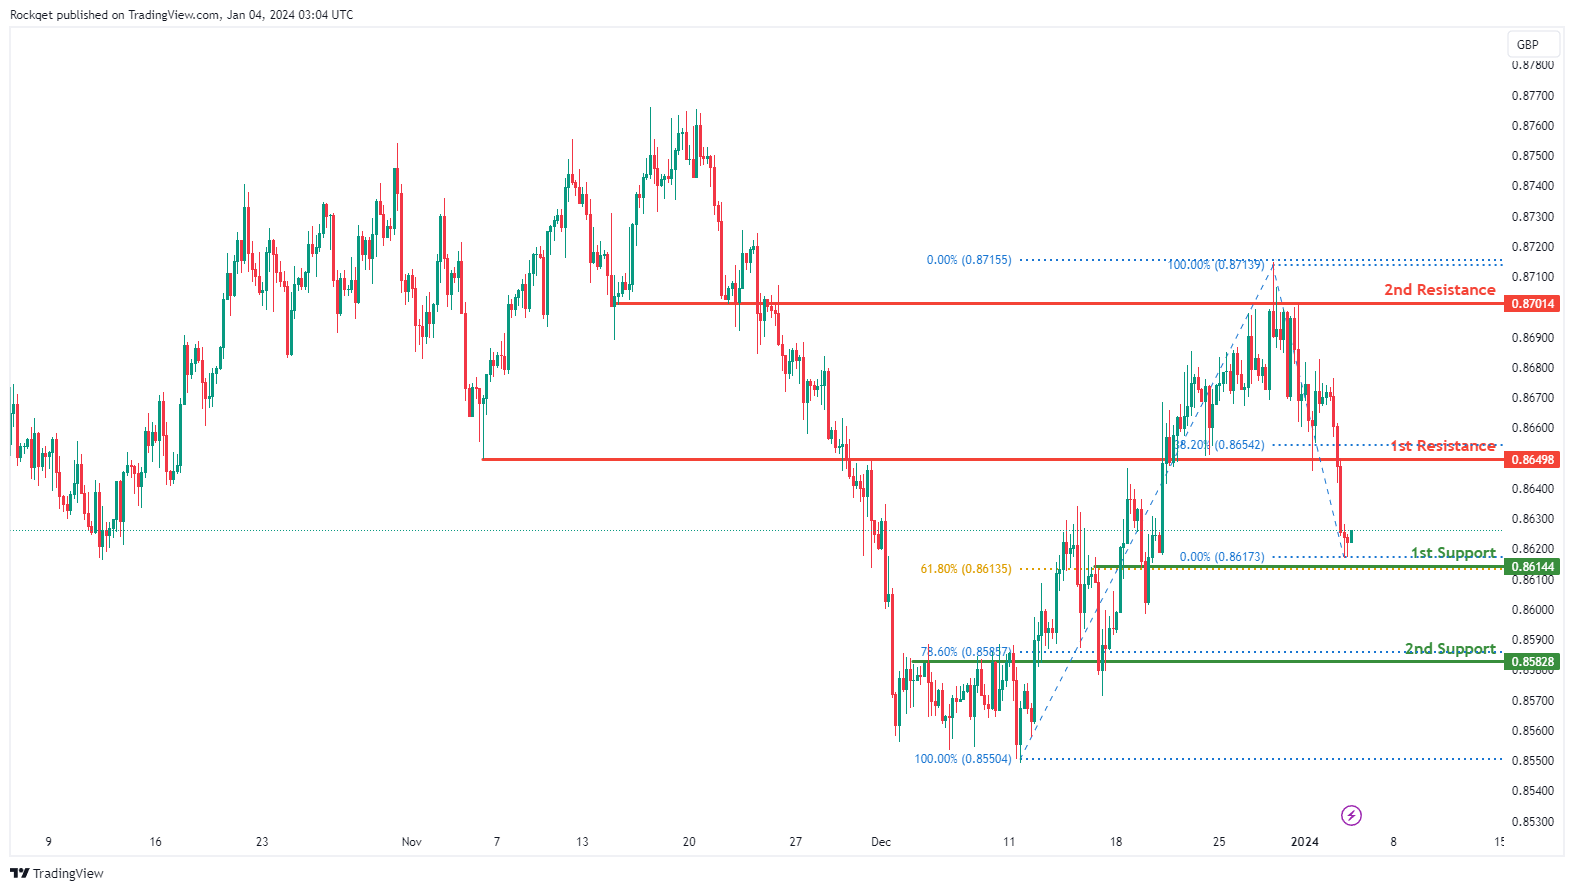
The EUR/GBP chart currently exhibits a weak bullish momentum with low confidence, suggesting a cautious market sentiment. Despite the overall weakness, there is a potential scenario for a bullish continuation towards the 1st resistance.
The 1st support at 0.8614 is considered favorable as it represents an overlap support and coincides with the 61.80% Fibonacci Retracement. This level holds historical significance and may act as a supportive zone where buyers could potentially emerge.
The 2nd support at 0.8583 is also identified as an overlap support and aligns with the 78.60% Fibonacci Retracement, providing additional confluence to its potential as a support level.
On the resistance side, the 1st resistance at 0.8650 is marked as an overlap resistance, indicating a level where selling interest may materialize.
The 2nd resistance at 0.8701 is also noted as an overlap resistance, adding another layer of potential resistance.
GBP/USD:
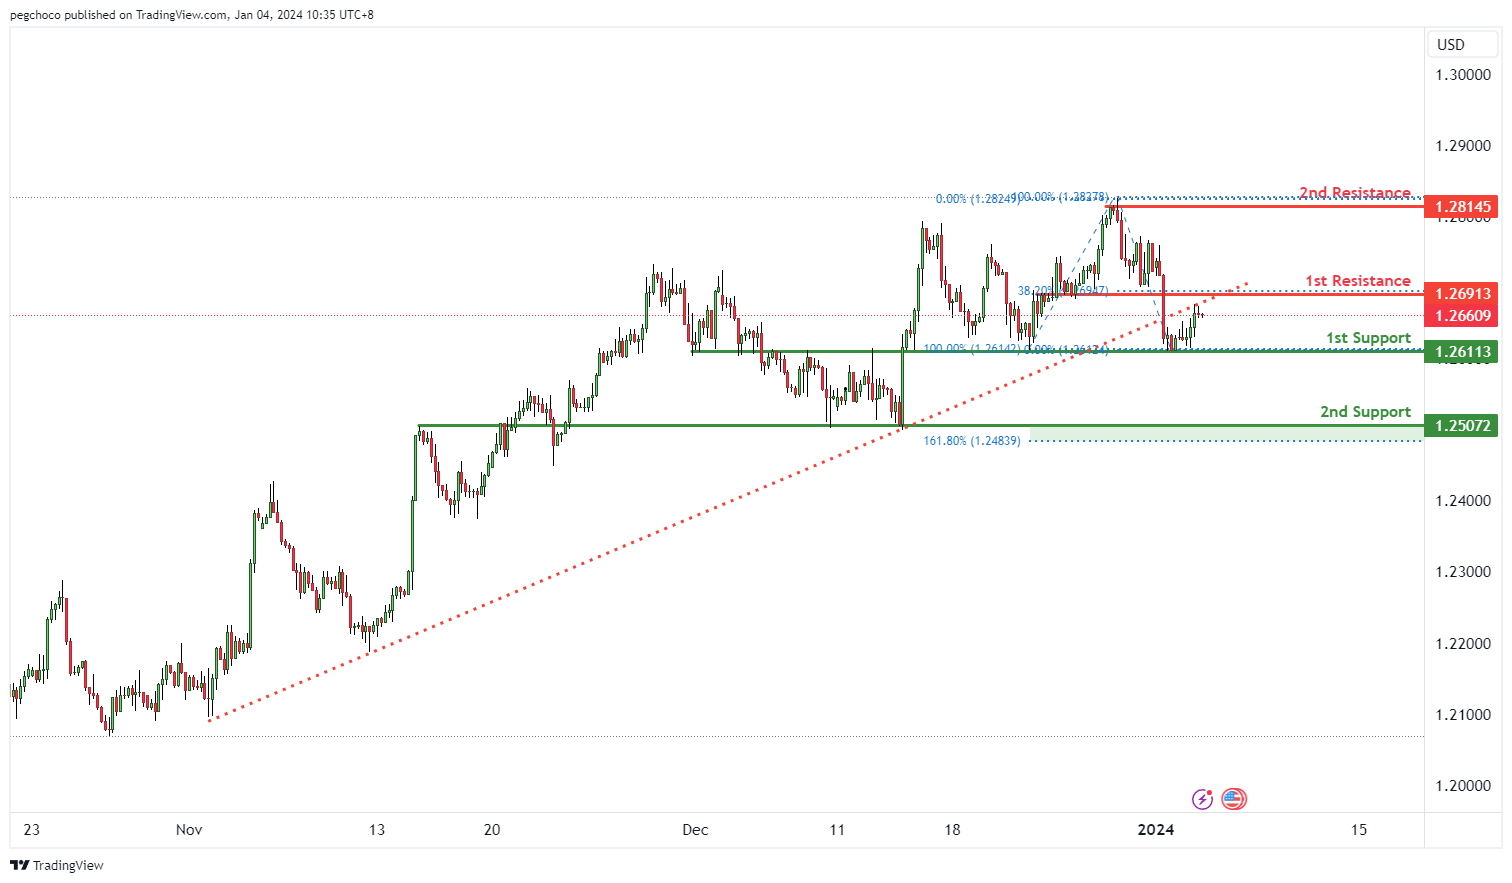
The GBP/USD chart currently has a bearish overall momentum, driven by the fact that price broke below an ascending support line, triggering a potential bearish move. This suggests that the British Pound is weaker compared to the US Dollar.
In the short term, there’s potential for a rise towards the 1st resistance level before a reversal and a drop towards the 1st support.
The 1st support at 1.2611 is categorized as an overlap support and is a significant level that may provide temporary support for the GBP/USD.
The 2nd support at 1.2507 is identified as an overlap support and is associated with the 161.80% Fibonacci Extension, further reinforcing its significance as a potential support zone.
On the resistance side, the 1st resistance at 1.2691 is categorized as a pullback resistance and is associated with the 38.20% Fibonacci Retracement. This level may act as a substantial barrier where selling interest could intensify, potentially triggering a bearish reversal in the short term.
The 2nd resistance at 1.2814 is noted as a swing high resistance. Swing highs often mark points of reversal or resistance in the price movement.
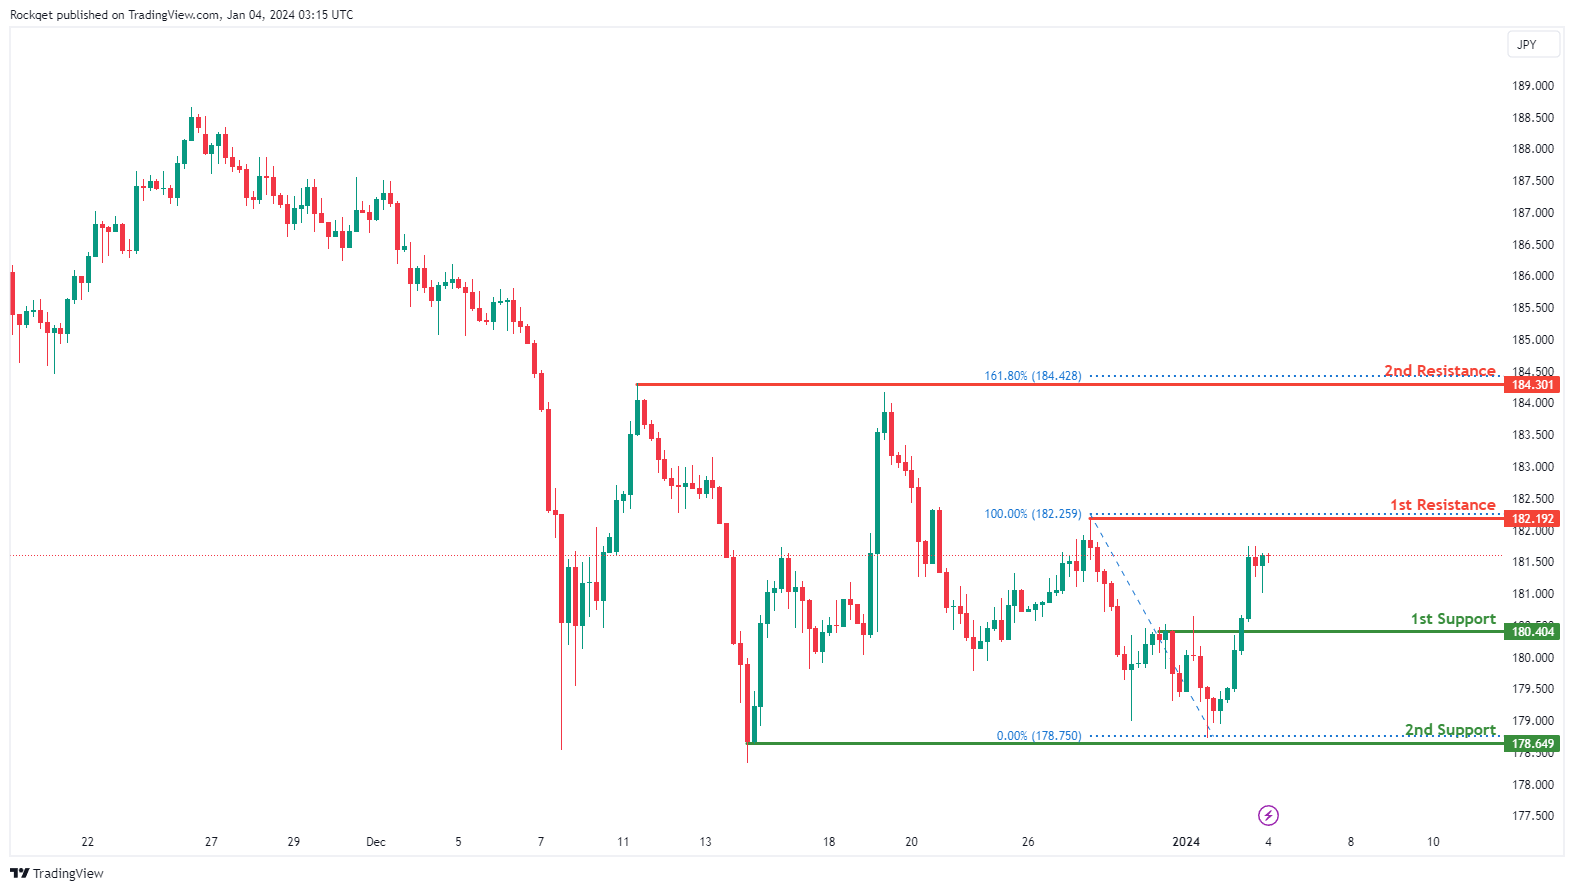
GBP/JPY:
The GBP/JPY chart currently demonstrates a neutral overall momentum, indicating a lack of a clear directional trend. In this scenario, there is a potential for price to fluctuate between the 1st resistance and 1st support levels.
The 1st support at 180.40 is identified as a pullback support, suggesting that this level has previously attracted buying interest during retracements.
The 2nd support at 178.65 is recognized as a multi-swing low support, adding significance to its potential as a support level.
On the resistance side, the 1st resistance at 182.19 is marked as a swing high resistance, representing a level where selling interest may emerge.
The 2nd resistance at 184.30 is noteworthy for being a multi-swing high resistance and aligning with the 161.80% Fibonacci Extension, potentially reinforcing its role as a resistance level.
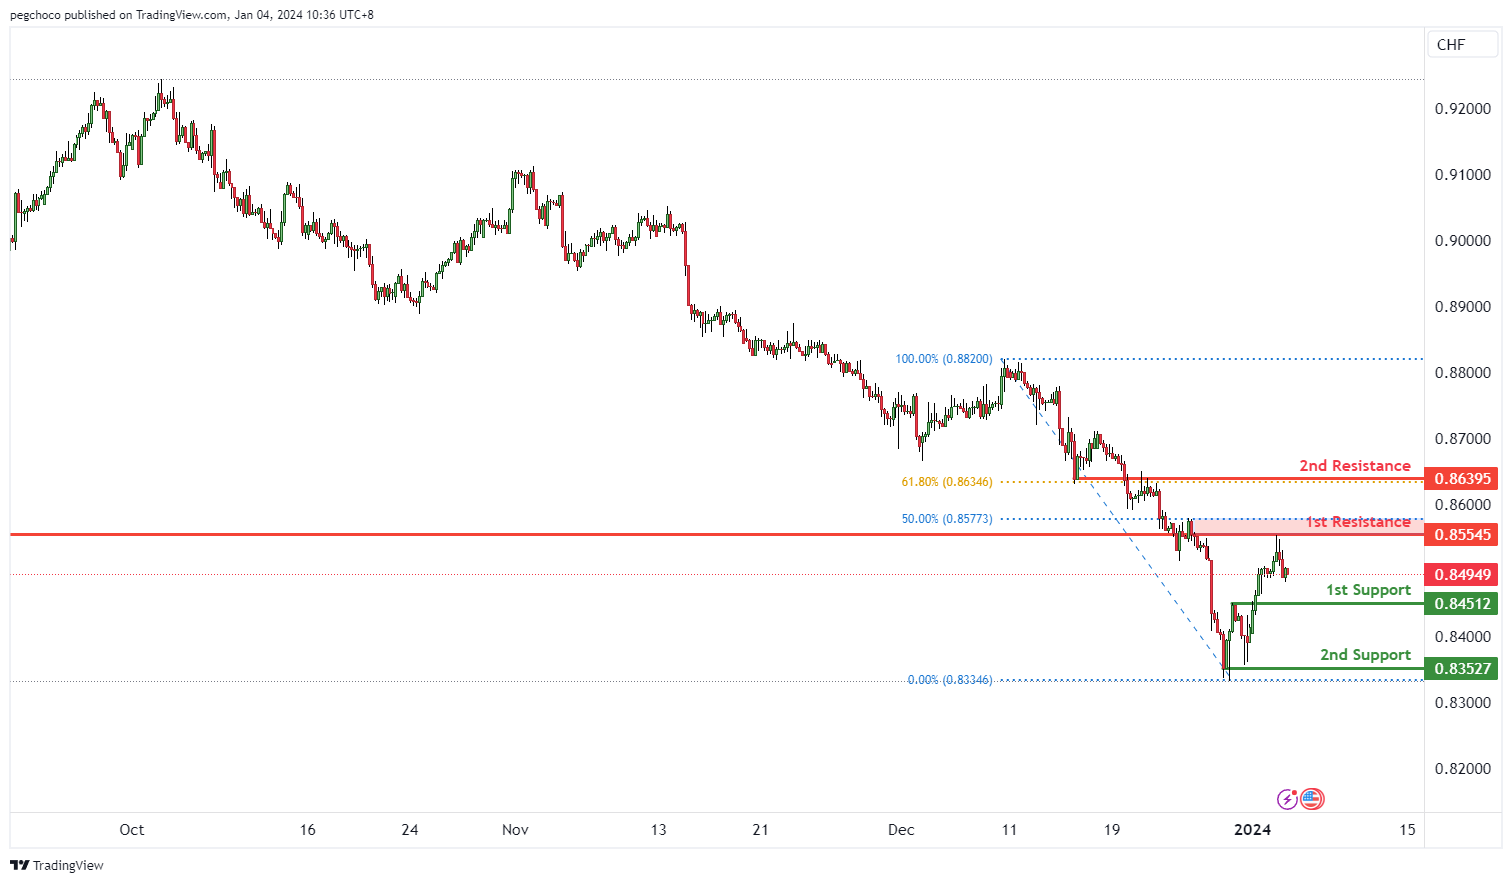
USD/CHF:
The USD/CHF chart currently has a bearish overall momentum, indicating that the US Dollar is weaker compared to the Swiss Franc.
Price could potentially continue its bearish movement towards the 1st support level.
The 1st support at 0.8451 is categorized as a pullback support. This level may serve as a significant area where buying interest could emerge temporarily, providing support for the USD/CHF pair.
The 2nd support at 0.8352 is identified as a multi-swing low support. This reinforces its significance as a potential support zone.
On the resistance side, the 1st resistance at 0.8554 is categorized as an overlap resistance and is associated with the 50% Fibonacci Retracement level. This level may act as a substantial barrier where selling interest could intensify.
The 2nd resistance at 0.8639 is also noted as an overlap resistance and is linked to the 61.80% Fibonacci Retracement level. Resistance levels like this often play a role in reversing or stalling the upward movement of the price.
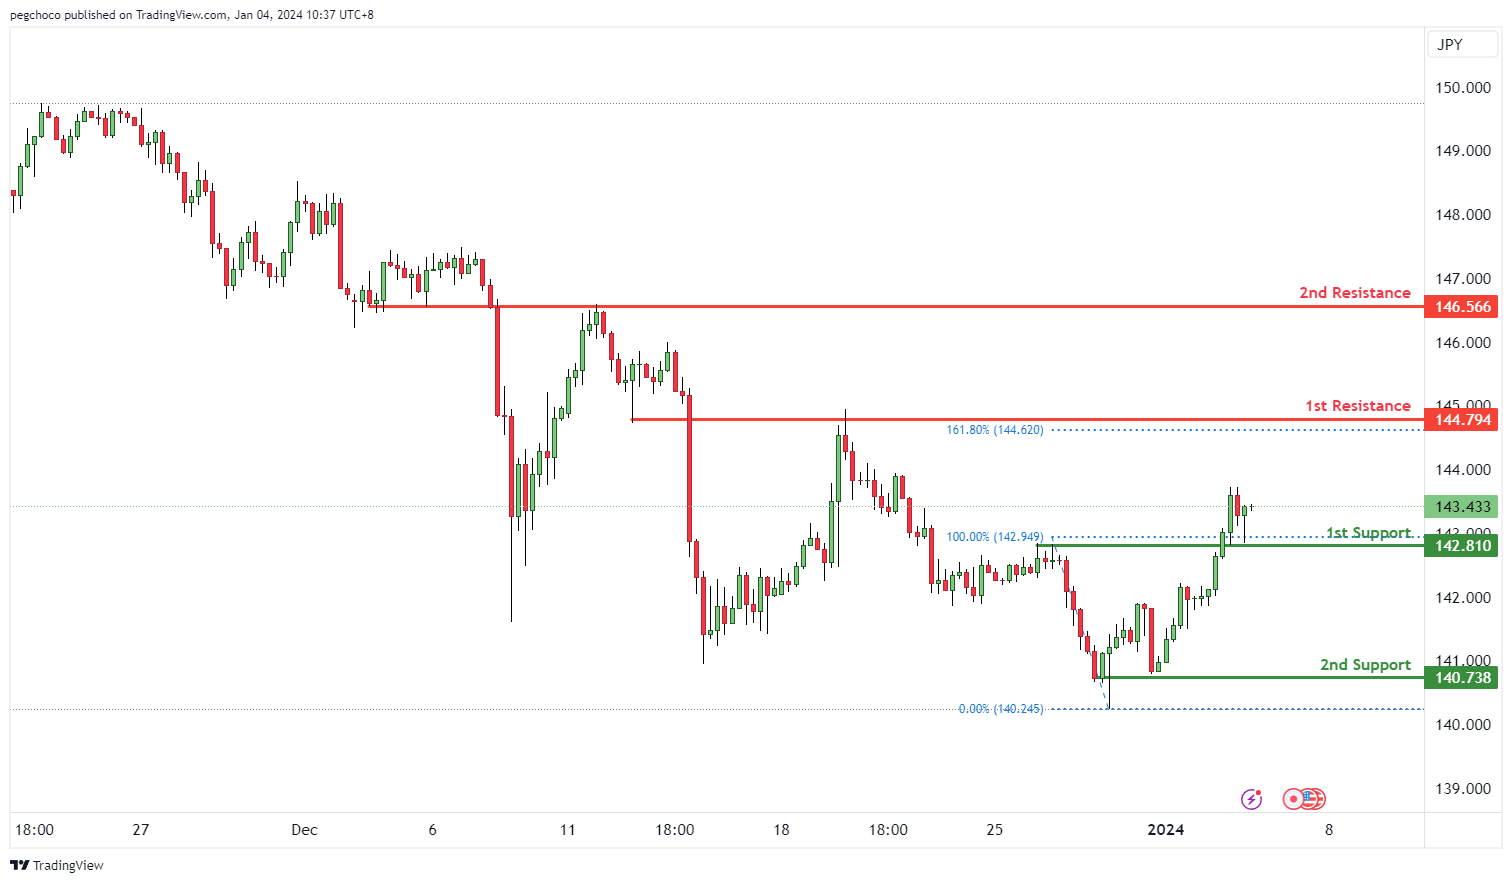
USD/JPY:
The USD/JPY chart currently has a bullish overall momentum, suggesting that the US Dollar is showing strength compared to the Japanese Yen.
Price could potentially continue its bullish movement towards the 1st resistance level.
The 1st support at 142.81 is categorized as an overlap support. This level may act as a significant area where buying interest could emerge, providing support for USD/JPY.
The 2nd support at 140.73 is identified as a swing low support, further reinforcing its significance as a potential support zone.
On the resistance side, the 1st resistance at 144.79 is categorized as an overlap resistance and is associated with the 161.80% Fibonacci Extension level. This level may serve as a substantial barrier where selling interest could intensify.
The 2nd resistance at 146.56 is also noted as an overlap resistance. Such resistance levels often play a role in reversing or slowing down the upward movement of the price.
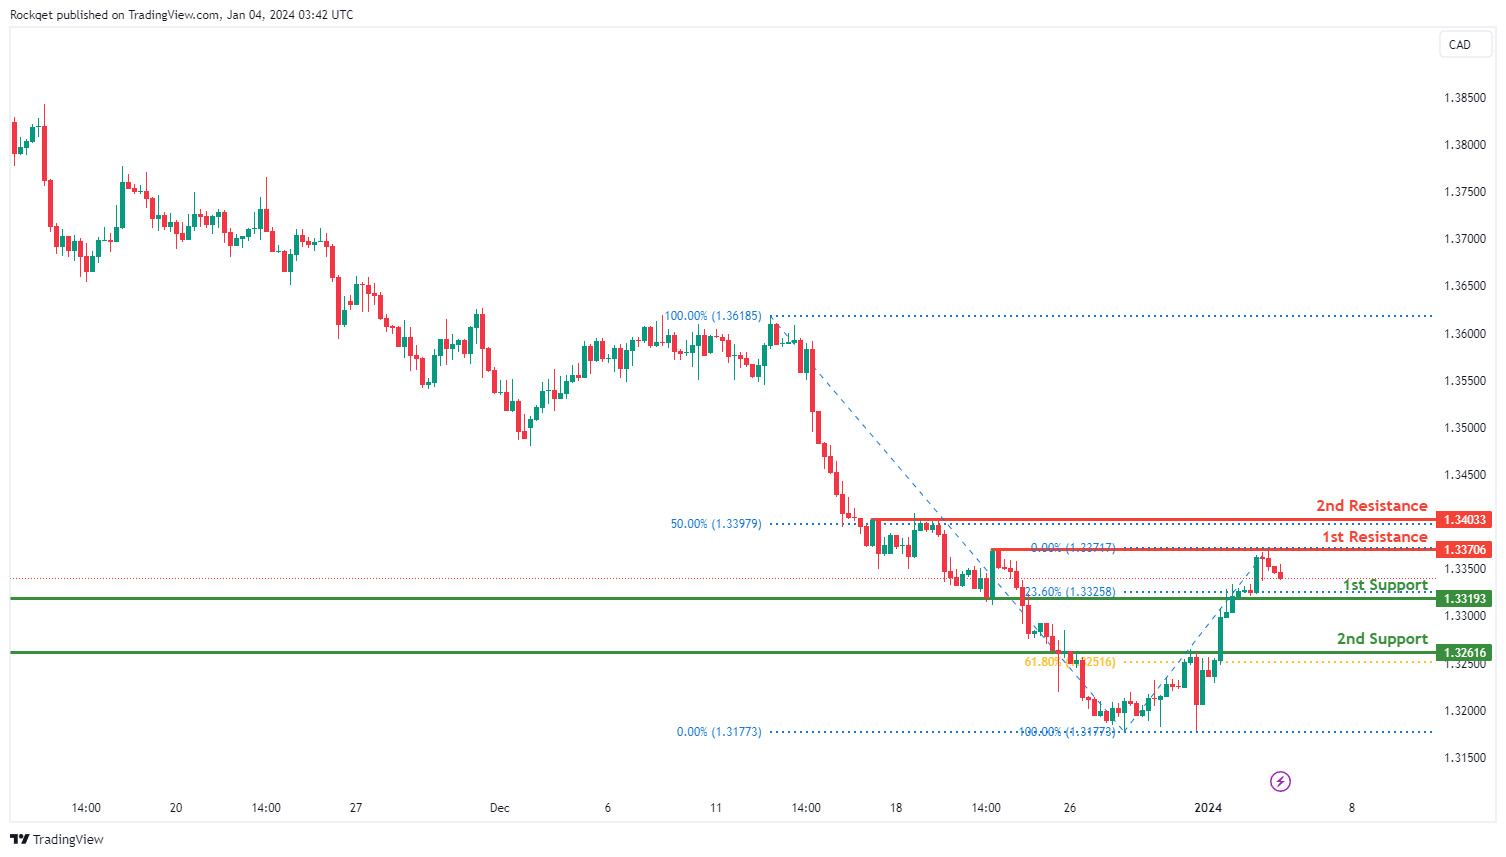
USD/CAD:
The USD/CAD chart currently exhibits an overall bullish momentum. However, there is a potential scenario for price to fall towards the 1st support before making a bullish bounce towards the 1st resistance.
The 1st support level at 1.3319 is identified as a pullback support that aligns with the 23.60% Fibonacci retracement level. Further below, the 2nd support level at 1.3261 is noted as an overlap support that aligns with the 61.80% Fibonacci retracement level, further reinforcing its importance as a key support level.
To the upside, the 1st resistance level at 1.3370 is identified as a pullback resistance. Higher up, the 2nd resistance level at 1.3403 is also marked as a pullback resistance that aligns with the 50.00% Fibonacci retracement level, suggesting a potential barrier for further upside movement.
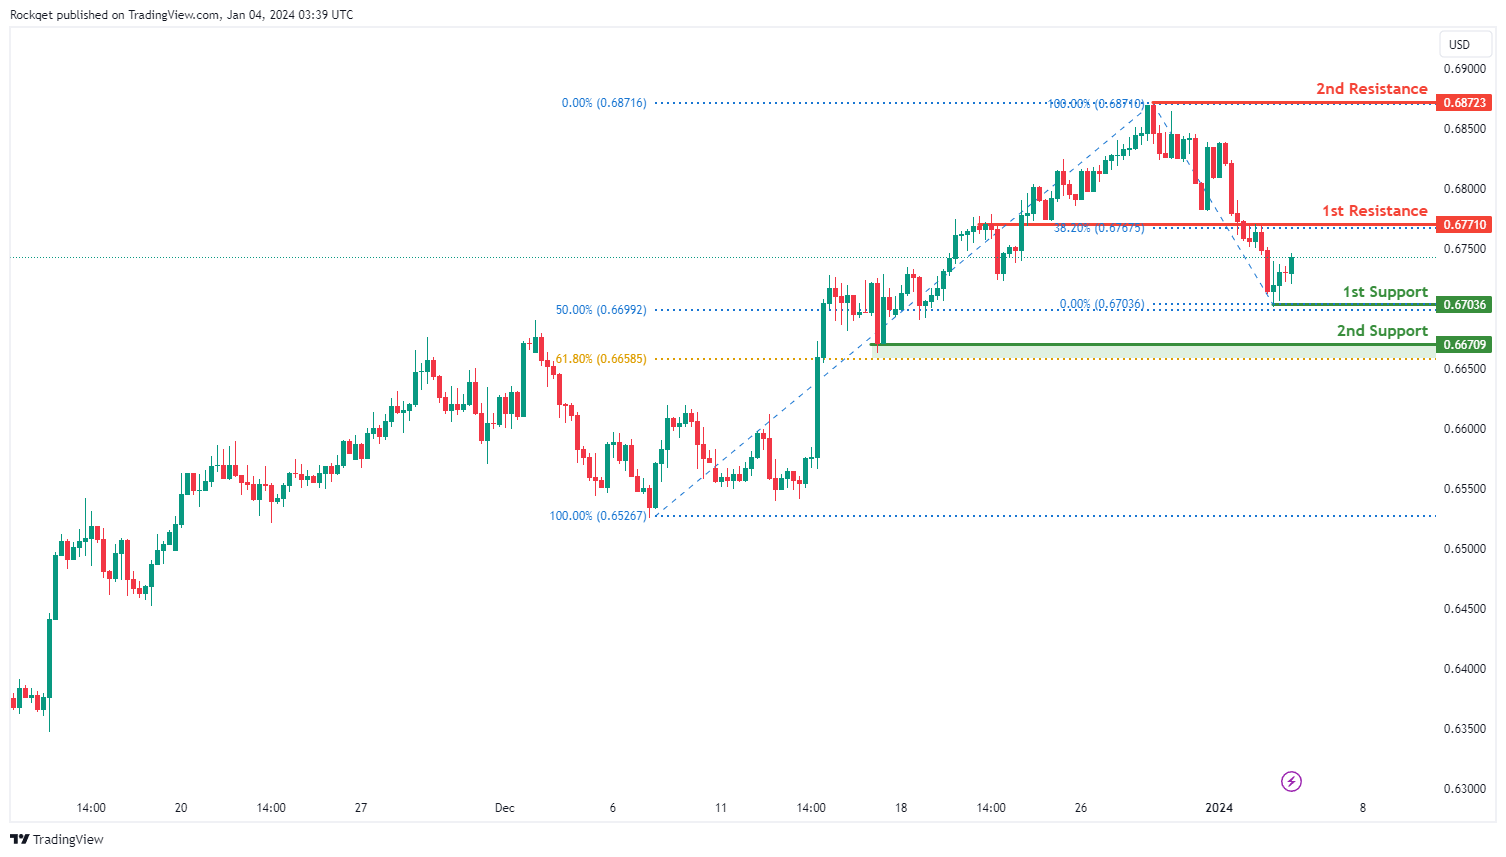
AUD/USD:
The AUD/USD chart currently exhibits an overall bearish momentum. In this context, there is a potential scenario for price to make a bearish reversal off the 1st resistance and fall towards the 1st support.
The 1st resistance level at 0.6771 is identified as an overlap resistance that aligns with the 38.20% Fibonacci retracement level. Higher up, the 2nd resistance level at 0.6872 is noted as a swing-high resistance, indicating its potential significance as a barrier for further upward movement.
To the downside, the 1st support level at 0.6703 is identified as a pullback support that aligns close to the 50.00% Fibonacci retracement level. Further below, the 2nd support level at 0.6670 is marked as a pullback support that aligns close to the 61.80% Fibonacci retracement level, further reinforcing its importance as a key support level.
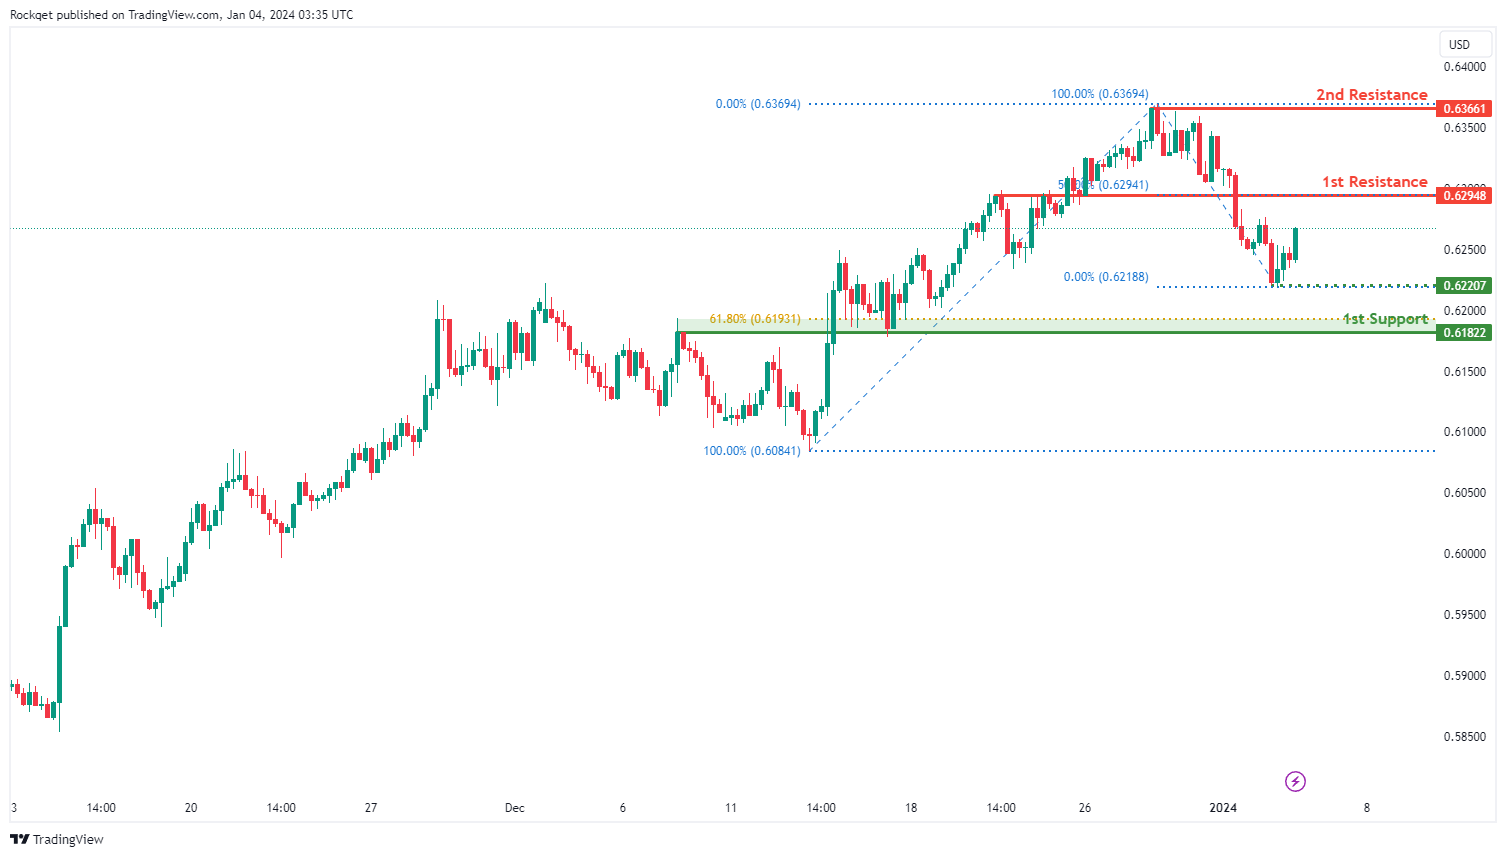
NZD/USD
The NZD/USD chart currently exhibits an overall bearish momentum. In this context, there is a potential scenario for price to make a bearish reversal off the 1st resistance and fall towards the 1st support.
The 1st resistance level at 0.6294 is identified as an overlap resistance that aligns with the 50.00% Fibonacci retracement level. Higher up, the 2nd resistance level at 0.6366 is marked as a swing-high resistance, indicating its potential significance as a barrier for further upward movement.
To the downside, the intermediate support level at 0.6220 is identified as a pullback support. Further below, the 1st support level at 0.6182 is noted as an overlap support that aligns close to the 61.80% Fibonacci retracement level, further reinforcing its importance as a key support level.
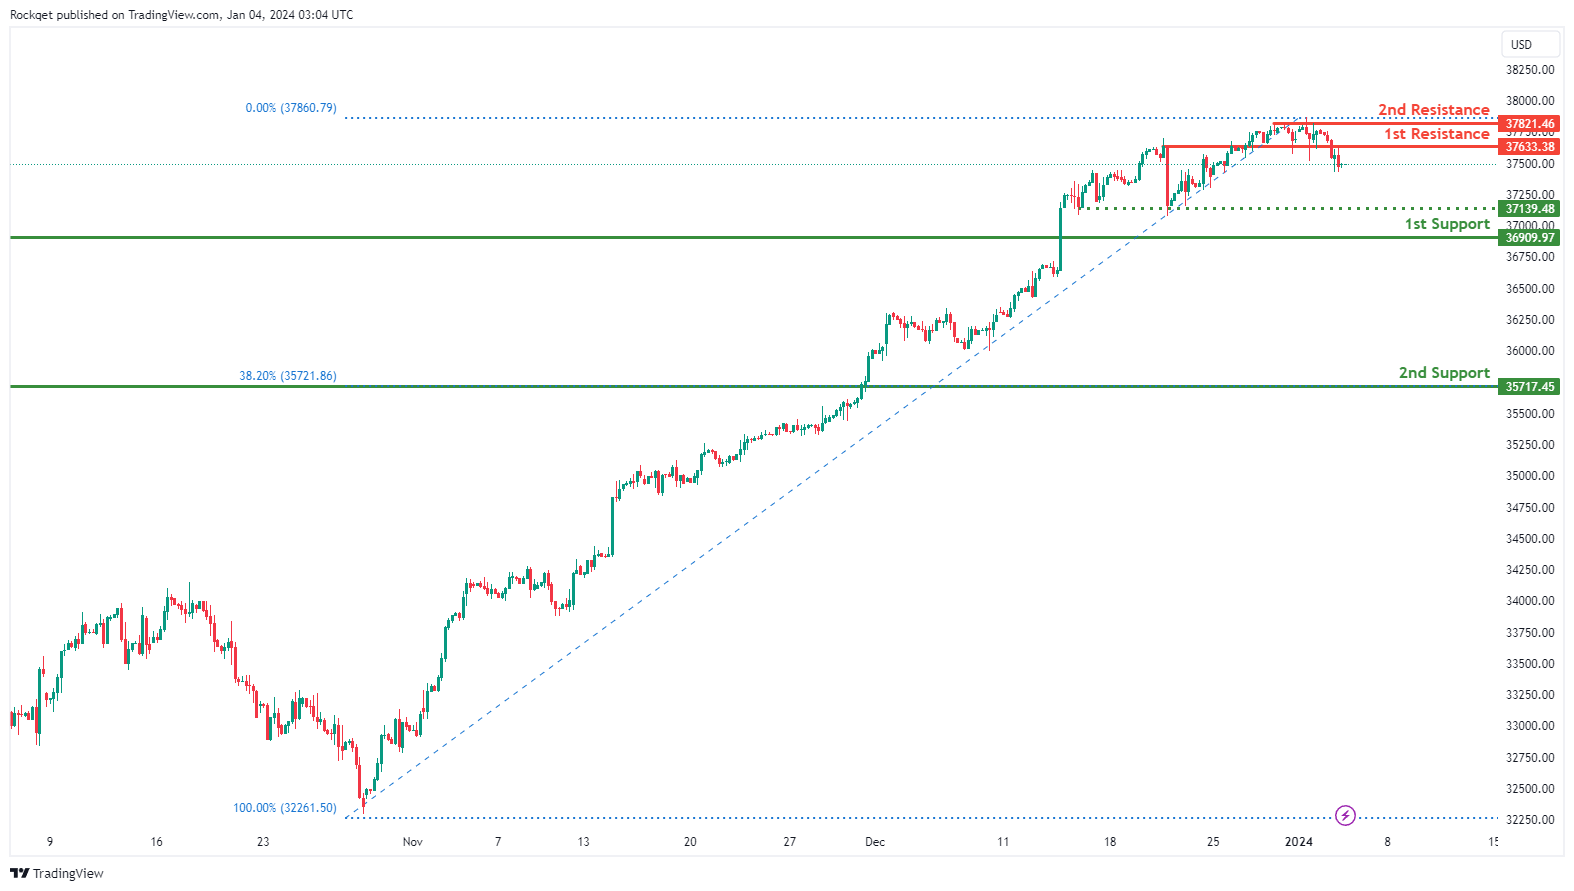
DJ30:
The DJ30 chart currently exhibits a weak bearish overall momentum, indicating a lack of a strong downward trend with low confidence. In this market condition, there is a potential scenario for a bearish continuation towards the 1st support.
The 1st support at 36909.97 is considered favorable as it is identified as a pullback support, suggesting historical significance as a level where buying interest has previously emerged during pullbacks.
The intermediate support at 37139.48 is noted as a multi-swing low support, providing an additional layer of potential buying interest.
The 2nd support at 35717.45 is recognized as a pullback support and coincides with the 38.20% Fibonacci Retracement, adding confluence to its potential as a support level.
On the resistance side, the 1st resistance at 37633.38 is identified as an overlap resistance, indicating a level where selling interest may emerge.
The 2nd resistance at 37821.46 is marked as a swing high resistance, representing a significant level where selling pressure could intensify.
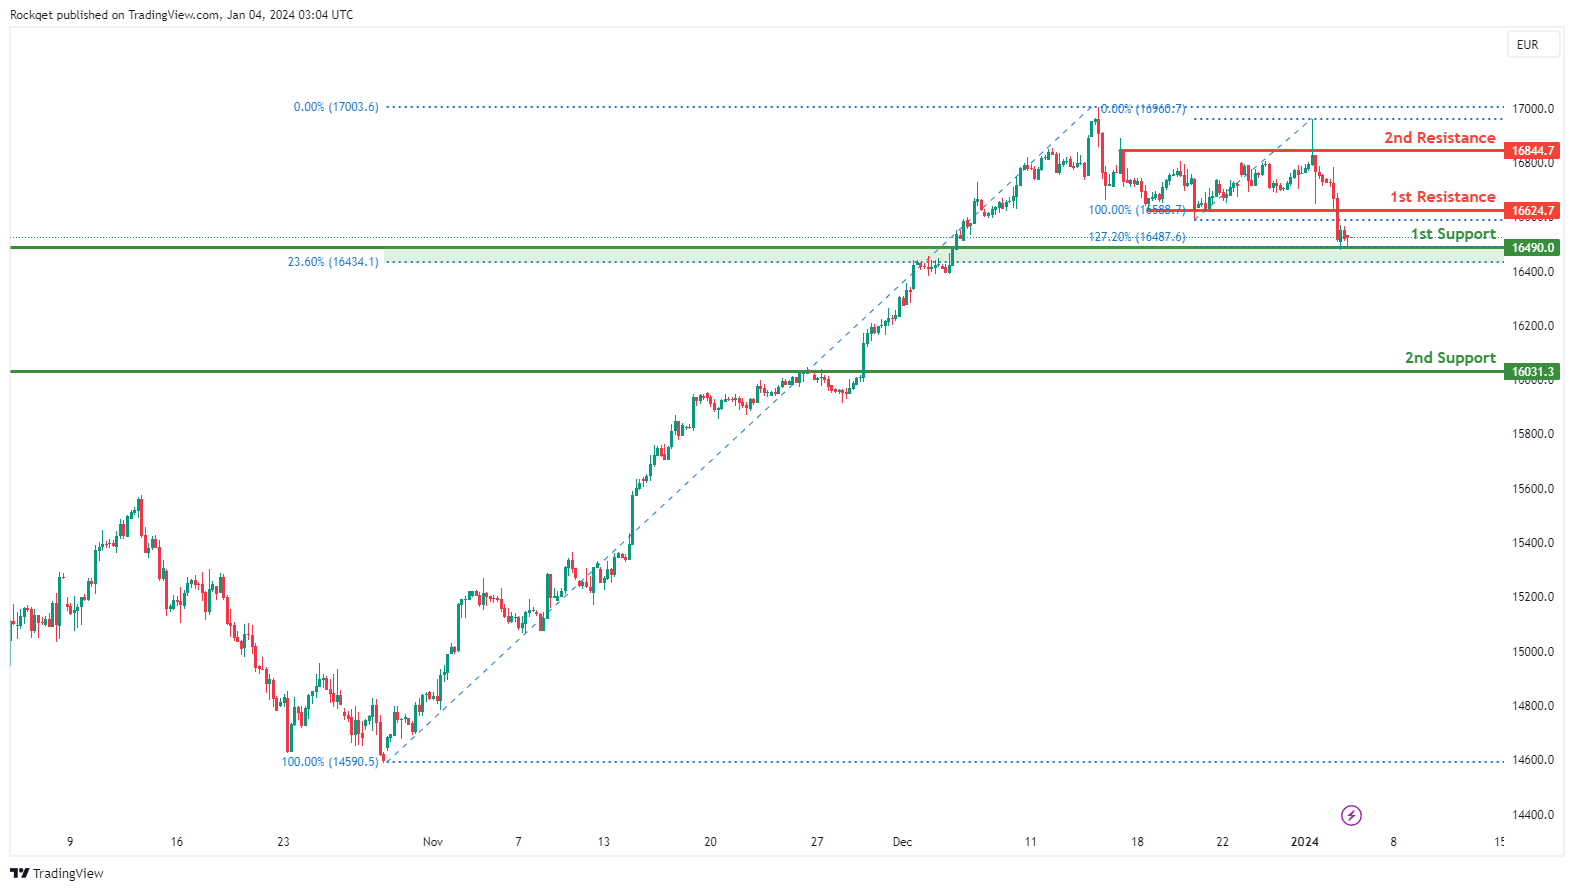
GER40:
The GER40 chart currently displays a bearish overall momentum, indicating a prevailing downward trend. Several factors contribute to this bearish momentum. There is a potential scenario for a bearish reaction off the 1st resistance, with a subsequent drop towards the 1st support.
The 1st support at 16490.00 is considered significant due to its identification as an overlap support and alignment with the 23.60% Fibonacci Retracement, providing a confluence of support factors.
The 2nd support at 16031.30 is recognized as a pullback support, further strengthening its potential as a level where buying interest may emerge.
On the resistance side, the 1st resistance at 16624.70 is identified as a pullback resistance, suggesting historical significance as a level where selling interest may materialize.
The 2nd resistance at 16844.70 is marked as a swing high resistance, indicating a significant level where selling pressure could intensify.
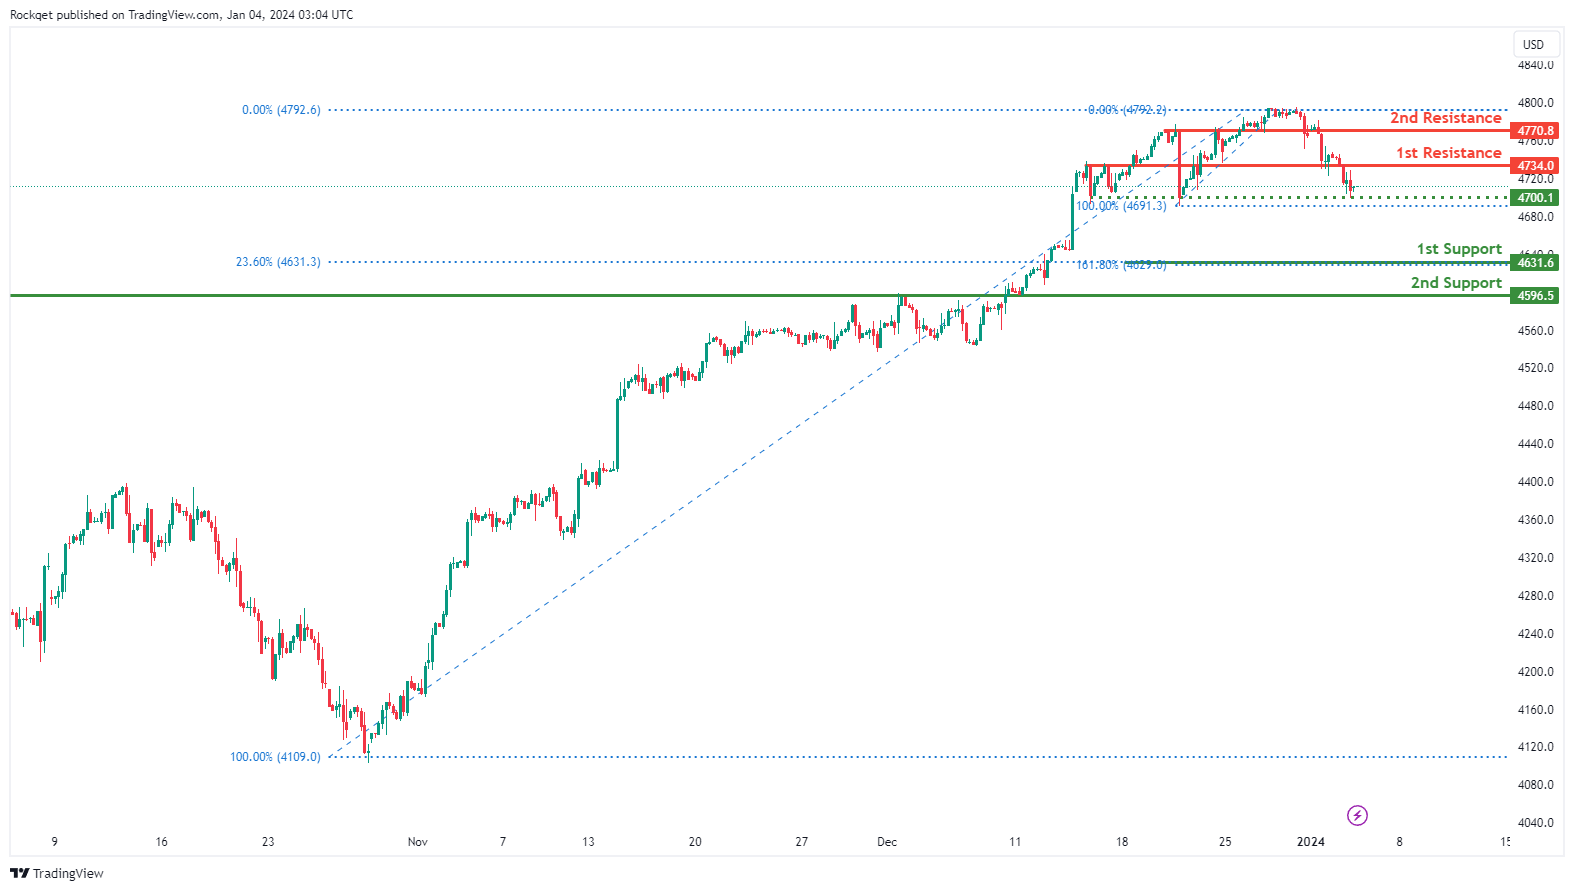
US500:
The US500 chart is currently exhibiting a weak bullish momentum with low confidence. Several factors contribute to this uncertain momentum. There is a potential scenario for a bearish reaction off the 1st resistance, with a subsequent drop towards the 1st support.
The 1st support at 4631.6 holds significance due to its alignment with the 23.60% Fibonacci Retracement and the 161.80% Fibonacci Extension, providing a confluence of support factors.
The 2nd support at 4595.5 is identified as an overlap support, further strengthening its potential as a level where buying interest may emerge.
An intermediate support at 4700.1 is recognized as a pullback support, adding an additional layer of potential buying interest at this level.
On the resistance side, the 1st resistance at 4743.0 is marked as an overlap resistance, suggesting historical significance as a level where selling interest may materialize.
The 2nd resistance at 4770.8 is also identified as an overlap resistance, contributing to the potential barrier for further upward movement.
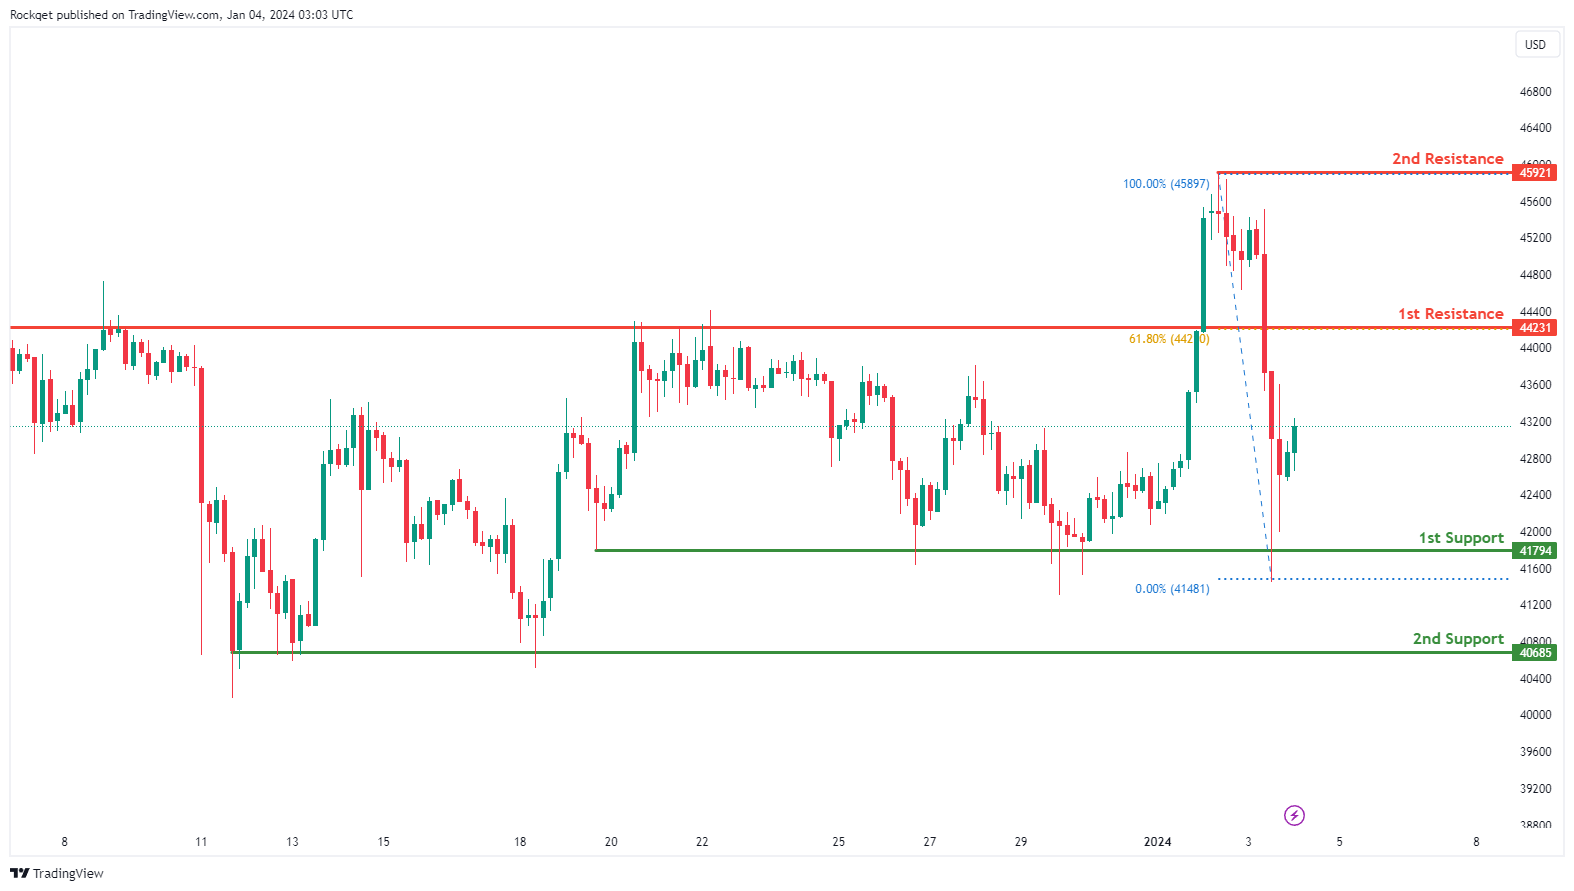
BTC/USD:
The BTC/USD chart currently displays a bullish overall momentum, indicating a potential continuation of the upward trend. There is a likelihood of a bullish movement towards the 1st resistance.
The 1st support at 41794 is considered favorable as it aligns with a multi-swing low support level, suggesting historical significance where buying interest has previously emerged.
The 2nd support at 40685 is also identified as a multi-swing low support, providing an additional layer of potential buying interest.
On the resistance side, the 1st resistance at 44231 is marked as a swing high resistance and coincides with the 61.80% Fibonacci Retracement. This level may act as a barrier where selling interest could materialize.
The 2nd resistance at 45921 is identified as a swing high resistance, further adding to the potential resistance zone for the price.
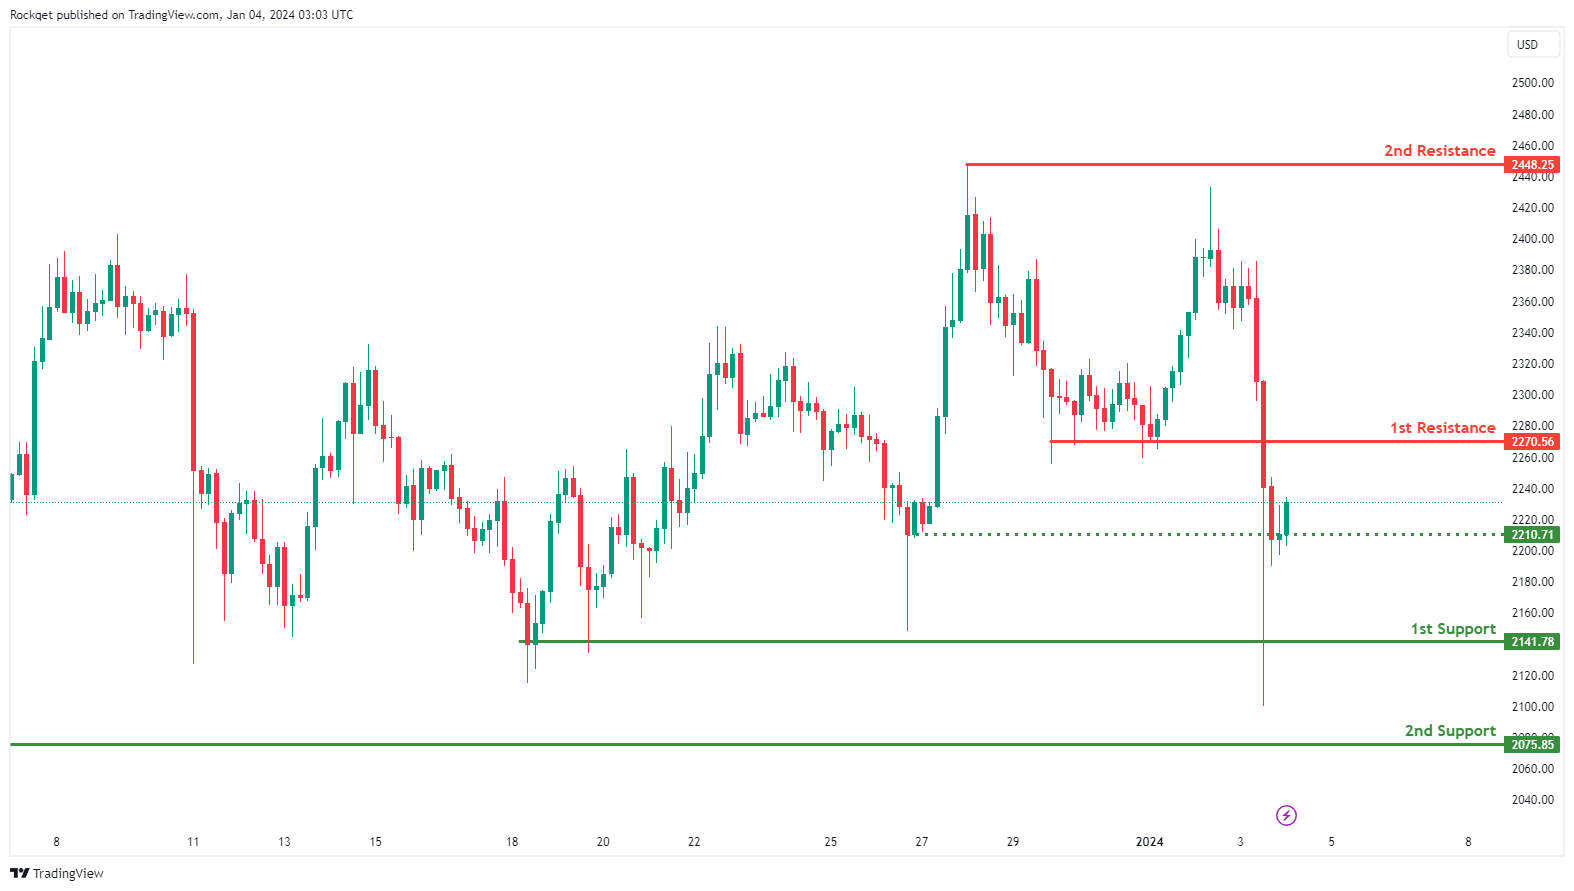
ETH/USD:
The ETH/USD chart currently exhibits a bullish overall momentum, suggesting a potential continuation of the upward trend. There is a possibility of a bullish movement towards the 1st resistance.
The 1st support at 2141.78 is considered advantageous as it corresponds to a multi-swing low support level, indicating historical significance where buying interest has previously been observed.
The 2nd support at 2075.85 is identified as a pullback support, adding an additional layer of potential buying interest.
On the resistance side, the 1st resistance at 2270.56 is marked as a pullback resistance, suggesting a level where selling interest may materialize.
The 2nd resistance at 2448.25 is recognized as a swing high resistance, further contributing to the potential resistance zone for the price.
An intermediate support level at 2210.71 is identified as a pullback support, providing an additional reference point for potential buying interest.
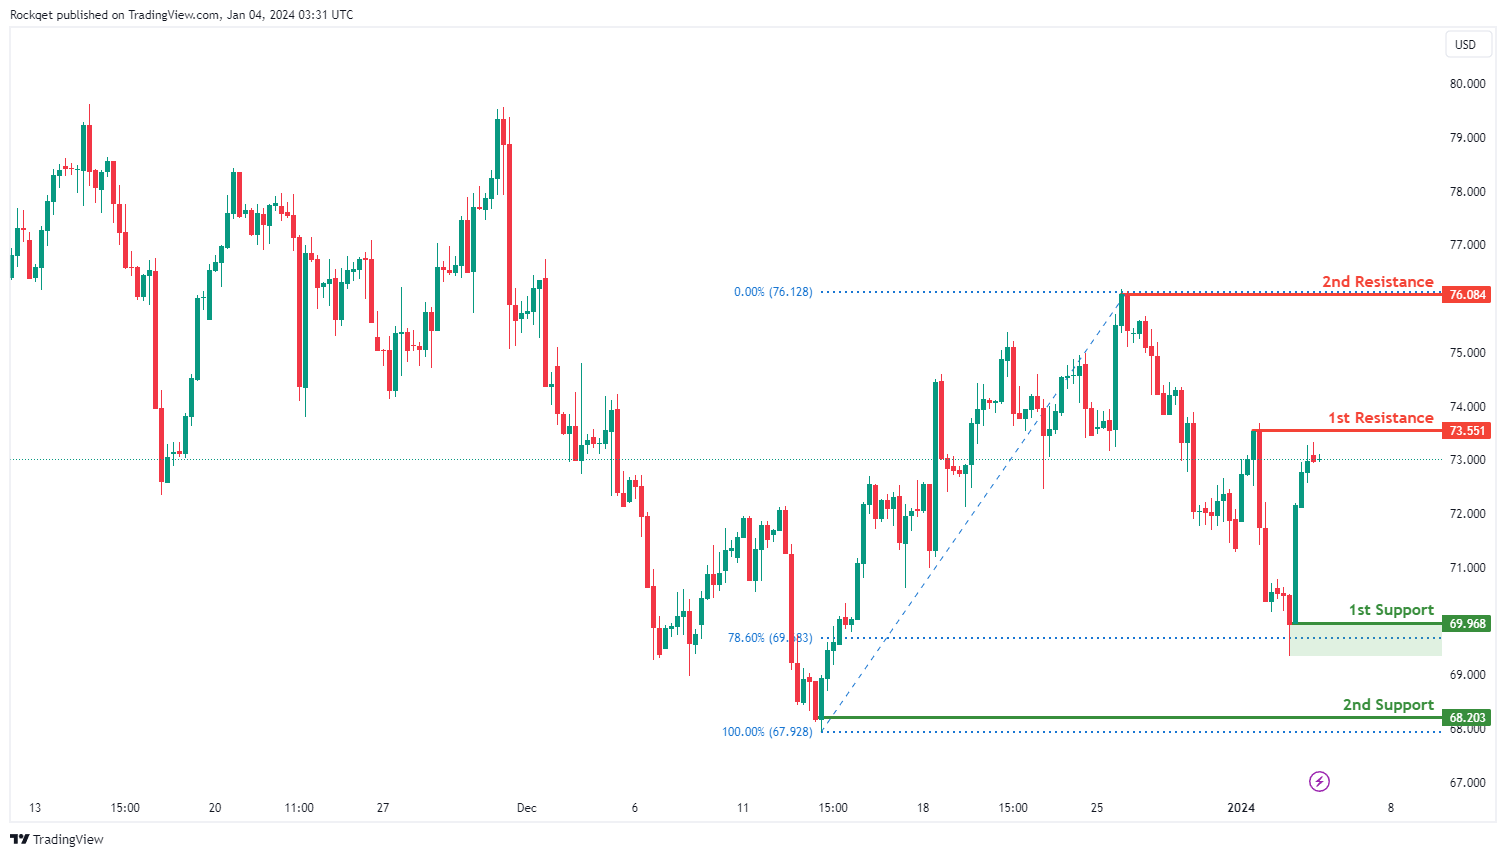
WTI/USD:
The WTI chart currently exhibits an overall bullish momentum, indicating a new uptrend. In this context, there is a potential scenario for price to rise towards the 1st resistance.
The 1st resistance level at 73.55 is identified as a pullback resistance. Higher up, the 2nd resistance level at 76.08 is noted as a swing-high resistance, further indicating its potential significance as a barrier for further upward movement.
To the downside, the 1st support level at 69.96 is identified as a swing-low support that aligns close to the 78.60% Fibonacci retracement level. Further below, the 2nd support level at 68.20 is also marked as a swing-low support, reinforcing its importance as a key support level.
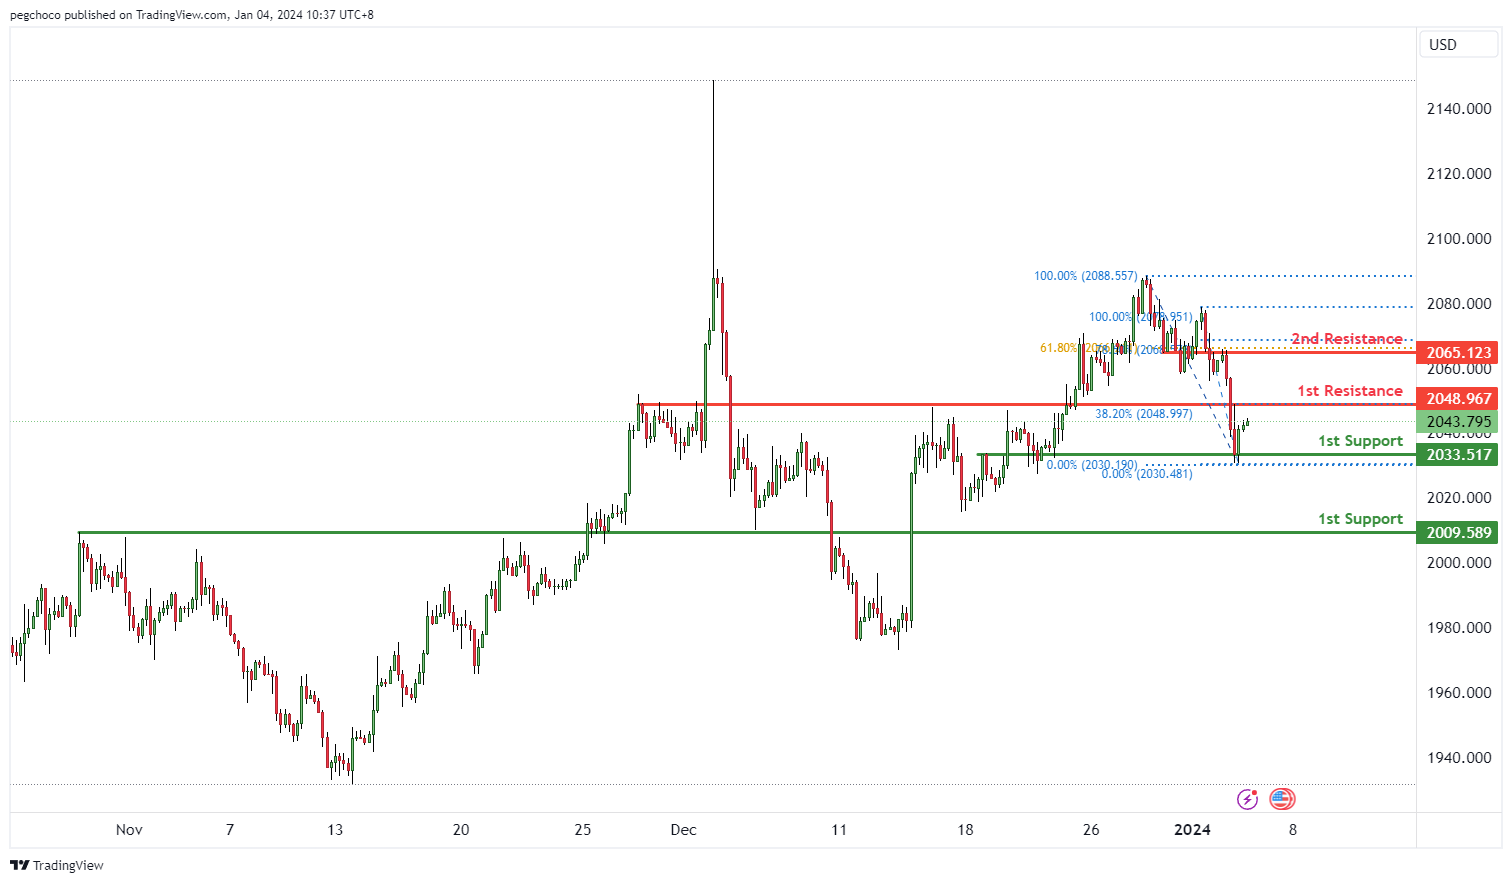
XAU/USD (GOLD):
The XAU/USD chart currently has a bearish overall momentum, indicating that gold (XAU) is weaker compared to the US Dollar (USD). In the short term, there’s potential for a bearish continuation towards the 1st support level.
The 1st support at 2049.16 is categorized as a pullback support and is reinforced by the presence of the 38.20% Fibonacci Retracement level. This level may act as a significant area where buying interest could emerge, providing temporary support for XAU/USD.
The 2nd support at 2009.58 is identified as an overlap support, further emphasizing its significance as a potential support zone. The 61.80% Fibonacci Retracement adds to the confluence of support at this level.
On the resistance side, the 1st resistance at 2088.73 is categorized as a multi-swing high resistance. This level may act as a substantial barrier where selling interest could intensify, potentially impeding any bullish advances in the short term.


