
DXY:
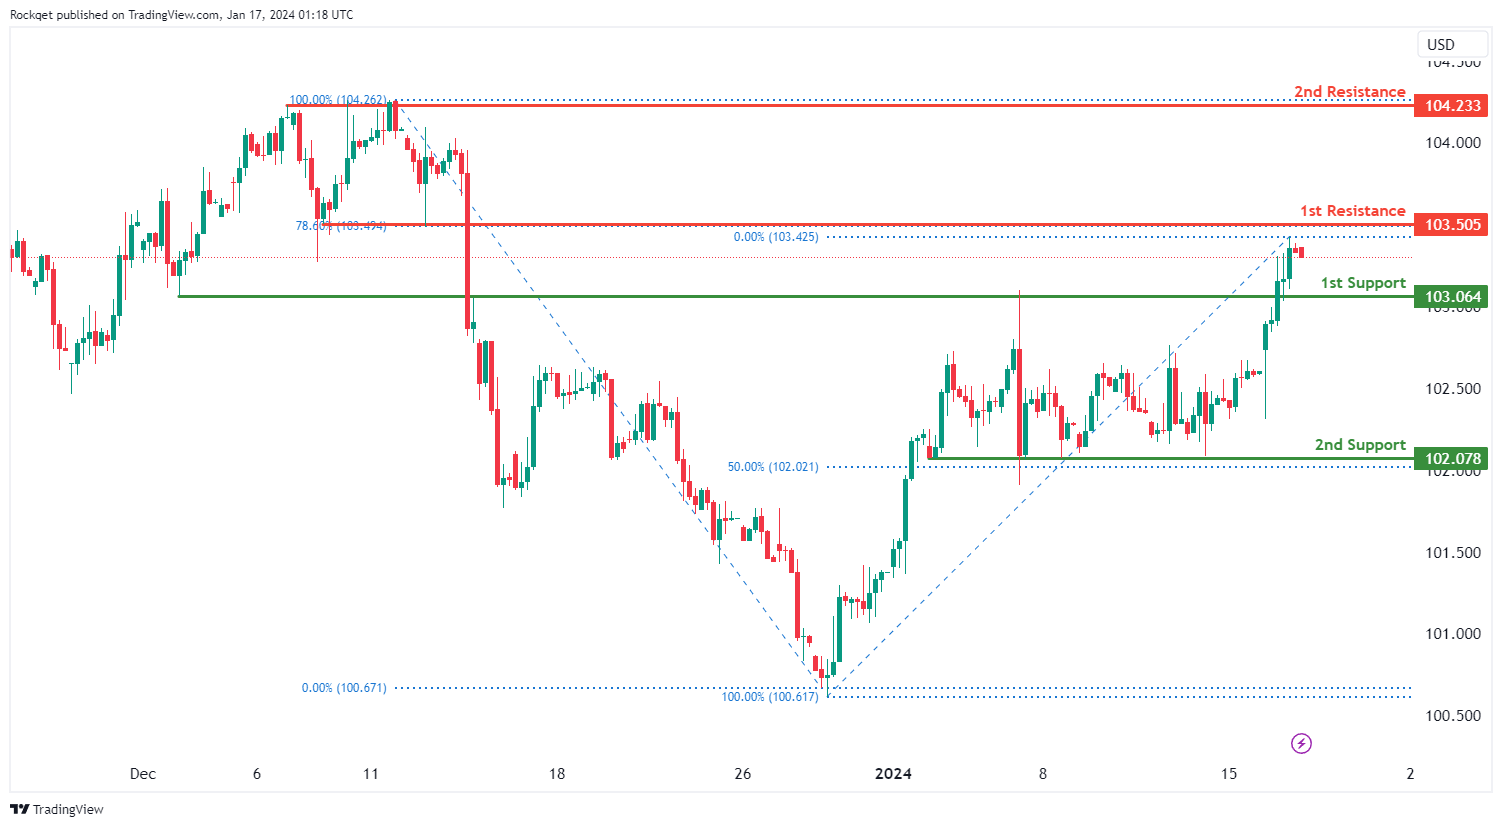
The DXY (US Dollar Index) chart currently exhibits an overall bullish momentum. In this context, there is a potential scenario for price to make a bullish continuation towards the 1st resistance.
The 1st resistance level at 103.50 is identified as a pullback resistance that aligns with the 78.60% Fibonacci retracement level. Higher up, the 2nd resistance level at 104.23 is also noted as a pullback resistance, further reinforcing its significance as a potential resistance zone.
To the downside, the 1st support level at 103.06 is identified as an overlap support. Further below, the 2nd support level at 102.07 is marked as a pullback support that aligns with the 50.00% Fibonacci retracement level, further reinforcing its importance as a key support level.
EUR/USD:
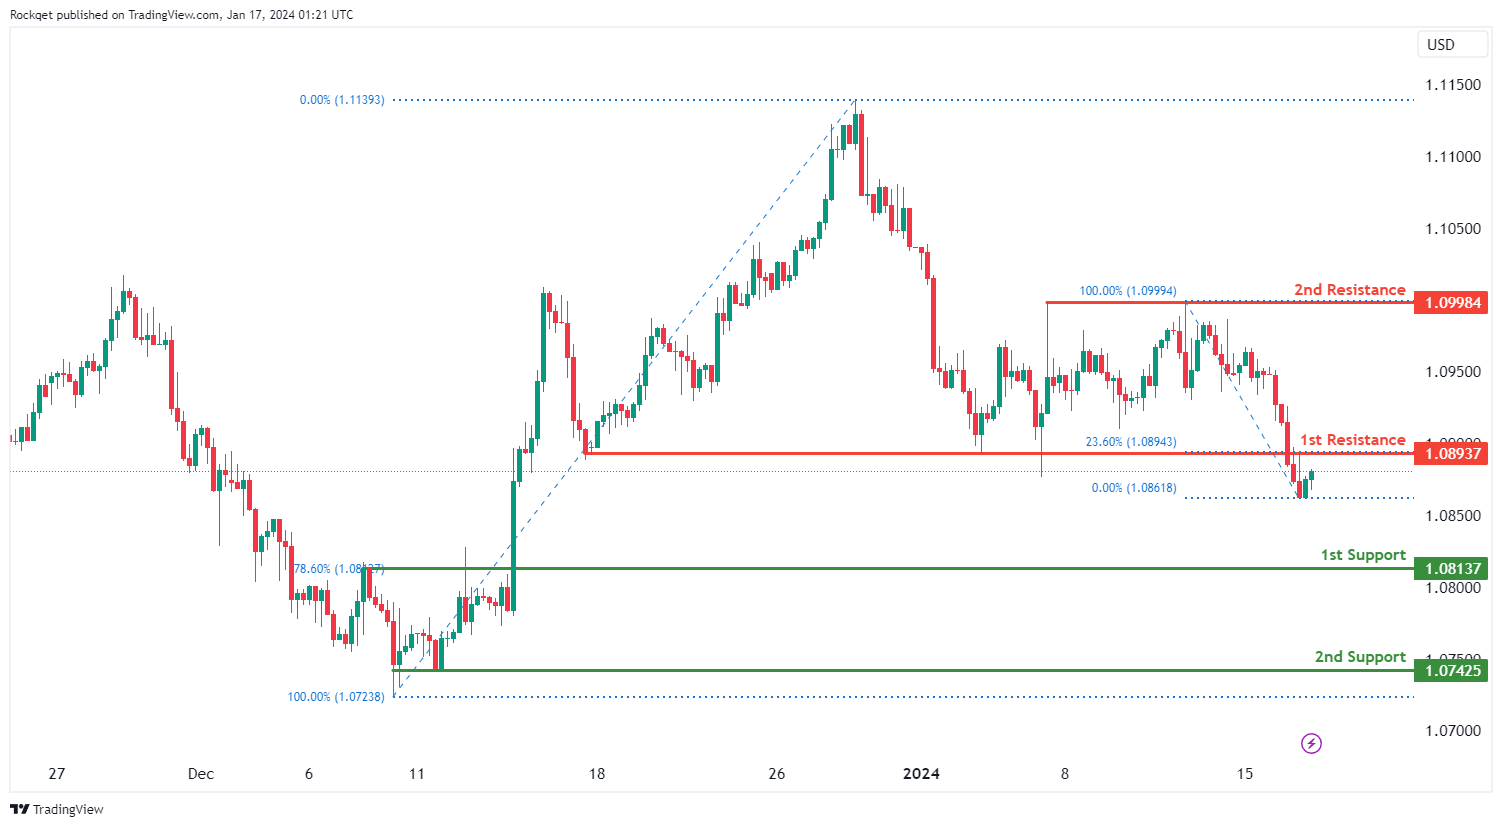
The EUR/USD chart currently exhibits an overall bearish momentum. In this context, there is a potential scenario for price to drop towards the 1st support.
The 1st support level at 1.0813 is identified as a pullback support that aligns with the 78.60% Fibonacci retracement level. Further below, the 2nd support level at 1.0742 is marked as a swing-low support, further reinforcing its importance as a key support level.
To the upside, the 1st resistance level at 1.0893 is identified as a pullback resistance that aligns with the 23.60% Fibonacci retracement level. Higher up, the 2nd resistance level at 1.0998 is also noted as a pullback resistance, suggesting a potential barrier for further upside movement.
EUR/JPY:
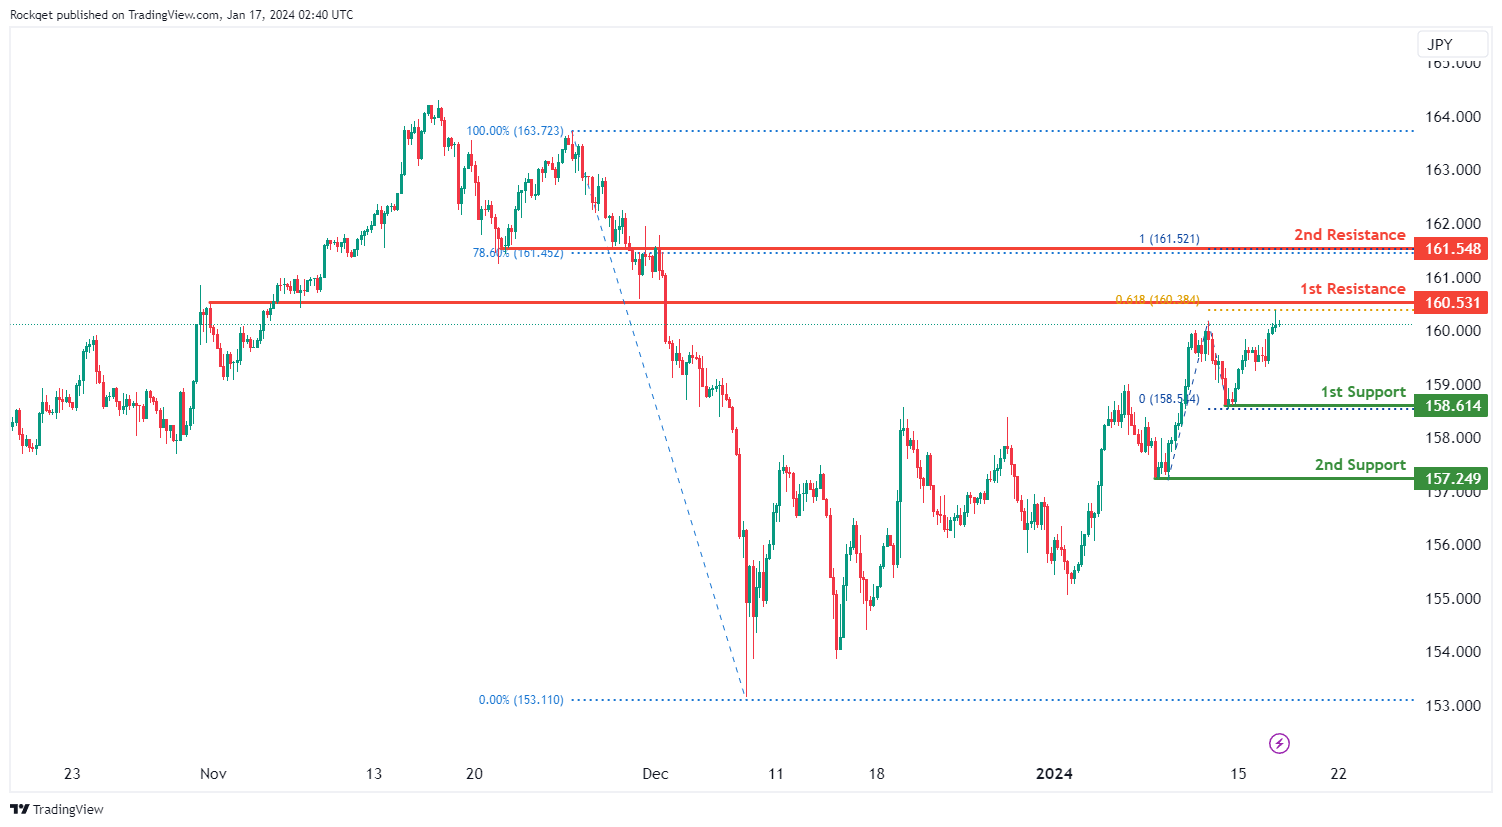
The EUR/JPY chart currently displays a bullish overall momentum, indicating a positive trend direction. Traders may anticipate a potential bullish continuation towards the 1st resistance level.
The 1st support at 158.61 is considered favorable, being identified as a swing low support. This level suggests historical significance as a point where buying interest has emerged in the past. Additionally, the 2nd support at 157.25 is another swing low support, adding to the confluence of support levels.
On the resistance side, the 1st resistance at 160.53 is identified as an overlap resistance and aligns with the 61.80% Fibonacci Projection. This confluence of technical factors adds strength to the potential resistance level. Furthermore, the 2nd resistance at 161.55 is recognized as an overlap resistance, with the additional support of the 78.60% Fibonacci Retracement.
EUR/GBP:
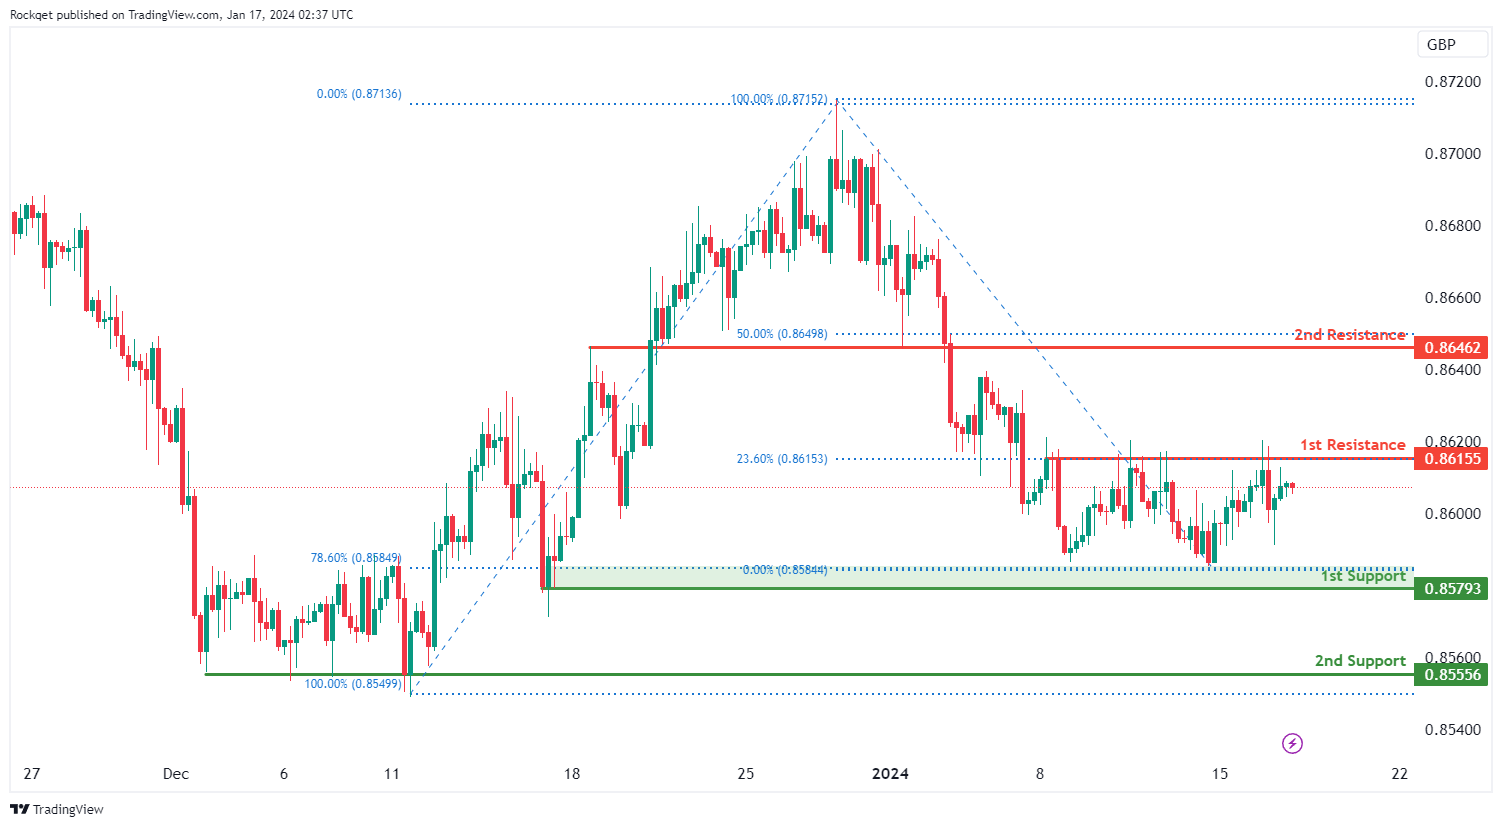
The EUR/GBP chart currently exhibits a bullish overall momentum, indicating a positive trend direction. Several factors contribute to this bullish momentum, suggesting potential upward movement in the price.
The 1st support at 0.8579 is considered favorable due to its identification as an overlap support and coincides with the 78.60% Fibonacci Retracement. This level indicates historical significance, suggesting a strong level of support. Additionally, the 2nd support at 0.8556 is recognized as a multi-swing low support, providing additional strength to the support zone.
On the resistance side, the 1st resistance at 0.8616 is identified as a swing high resistance and aligns with the 23.60% Fibonacci Retracement. This confluence of technical factors adds strength to the potential resistance level. Furthermore, the 2nd resistance at 0.8646 is acknowledged as an overlap resistance and corresponds to the 50% Fibonacci Retracement.
GBP/USD:
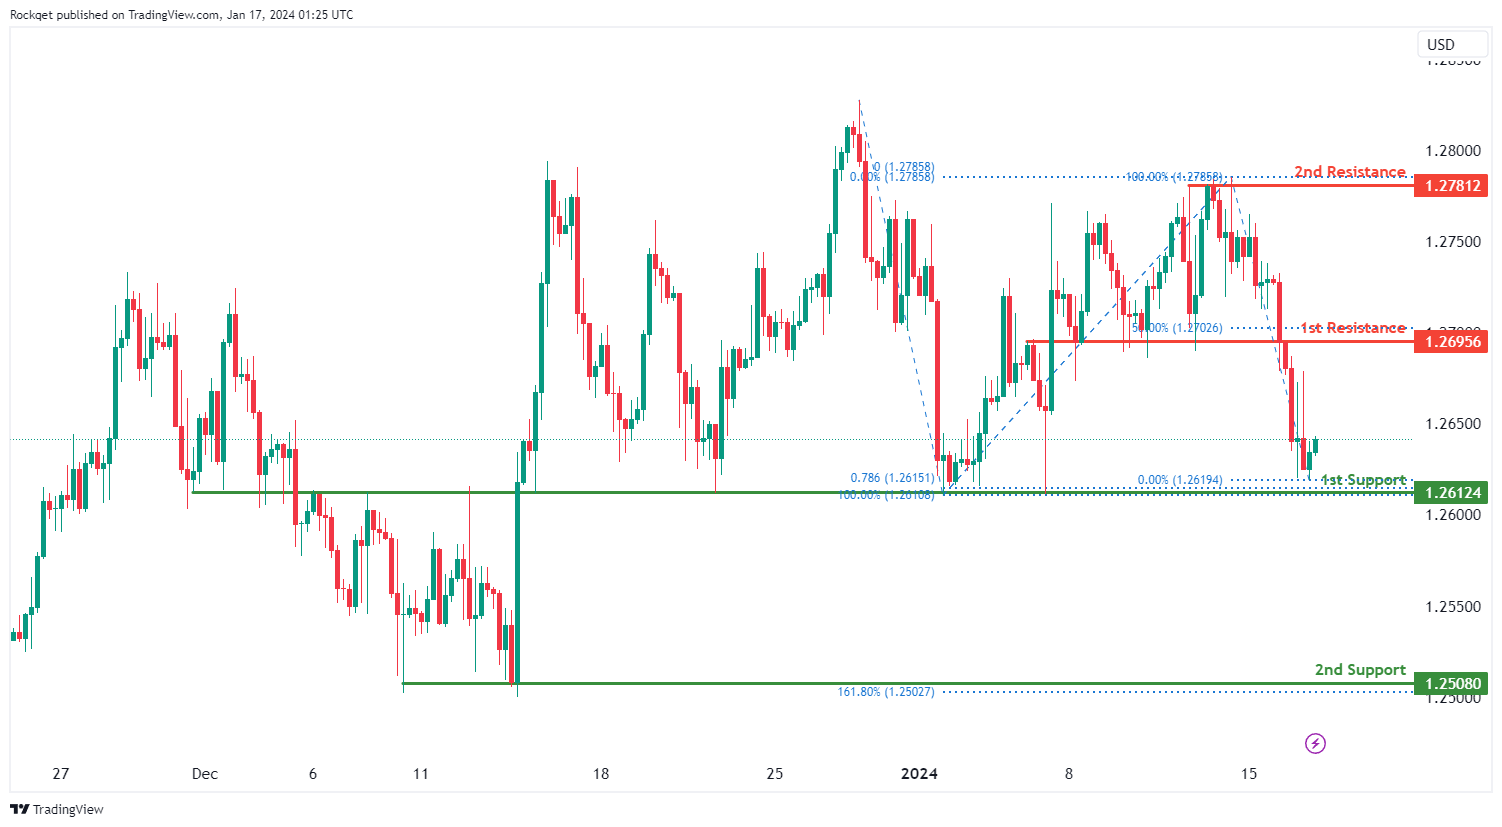
The GBP/USD chart currently exhibits an overall bearish momentum. In this context, there is a potential scenario for price to drop towards the 1st support.
The 1st support level at 1.2612 is identified as an overlap support that aligns with the 78.60% Fibonacci projection level. Further below, the 2nd support level at 1.2508 is marked as a swing-low support that aligns with the 161.80% Fibonacci extension level, further reinforcing its importance as a key support level.
To the upside, the 1st resistance level at 1.2695 is identified as an overlap resistance that aligns close to the 50.00% Fibonacci retracement level. Higher up, the 2nd resistance level at 1.2781 is noted as a swing-high resistance, suggesting a potential barrier for further upside movement.
GBP/JPY:
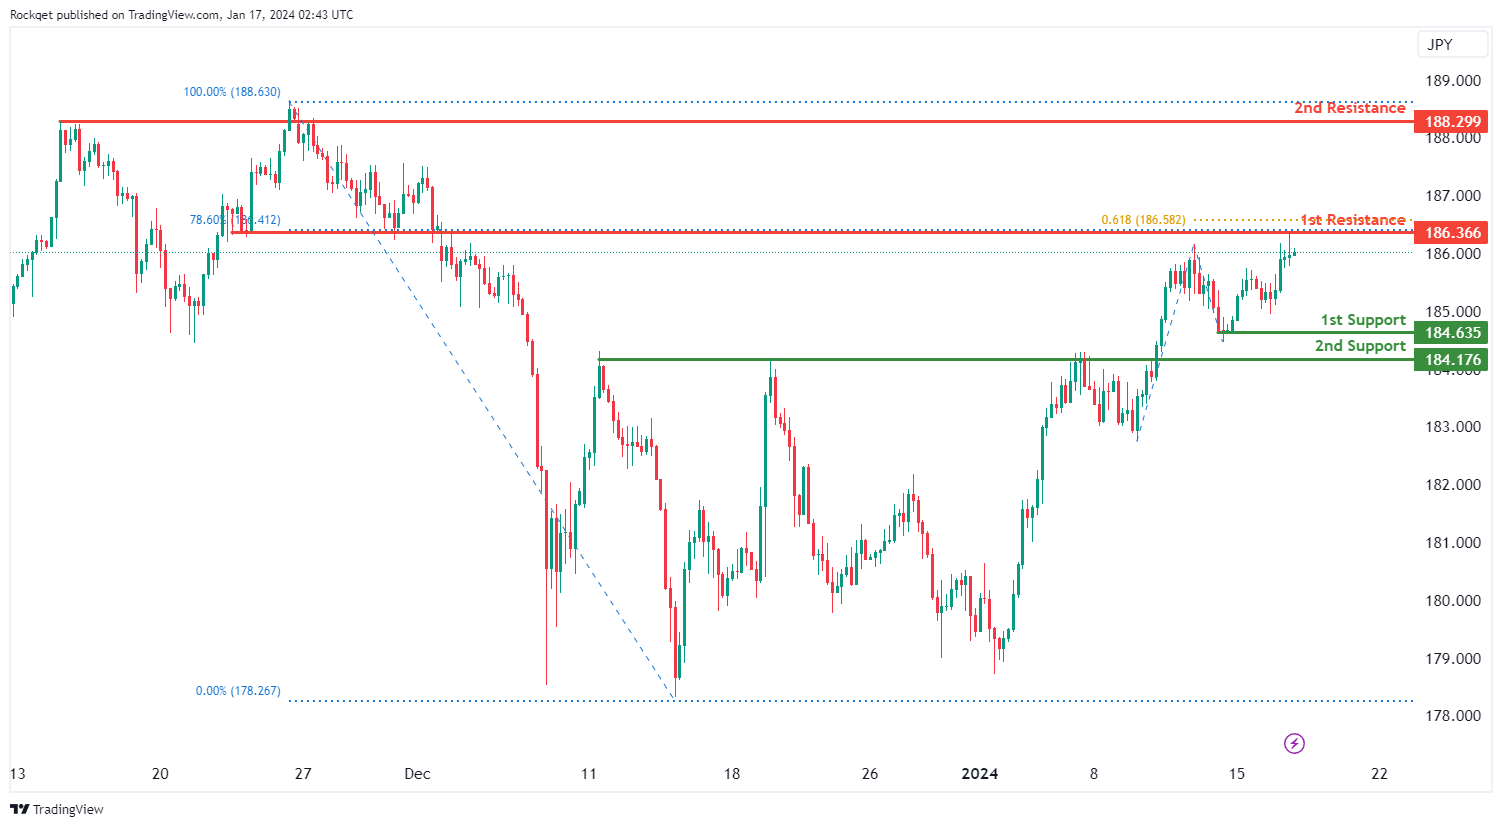
The GBP/JPY chart currently shows a bullish overall momentum, indicating an upward trend. There’s a potential for a bullish continuation towards the 1st resistance.
The 1st support at 184.64 is a swing low support, suggesting a historical area with significant buying interest. The 2nd support at 184.18 is labeled as a pullback support, indicating a potential zone for buying interest following a retracement.
On the resistance side, the 1st resistance at 183.37 is an overlap resistance, aligned with the 78.60% Fibonacci Retracement and the 61.80% Fibonacci Projection, suggesting a strong resistance zone. The 2nd resistance at 188.30 is a swing high resistance, representing a historical point of selling interest. Traders should closely monitor these levels for potential bullish movements in the GBP/JPY chart.
USD/CHF:
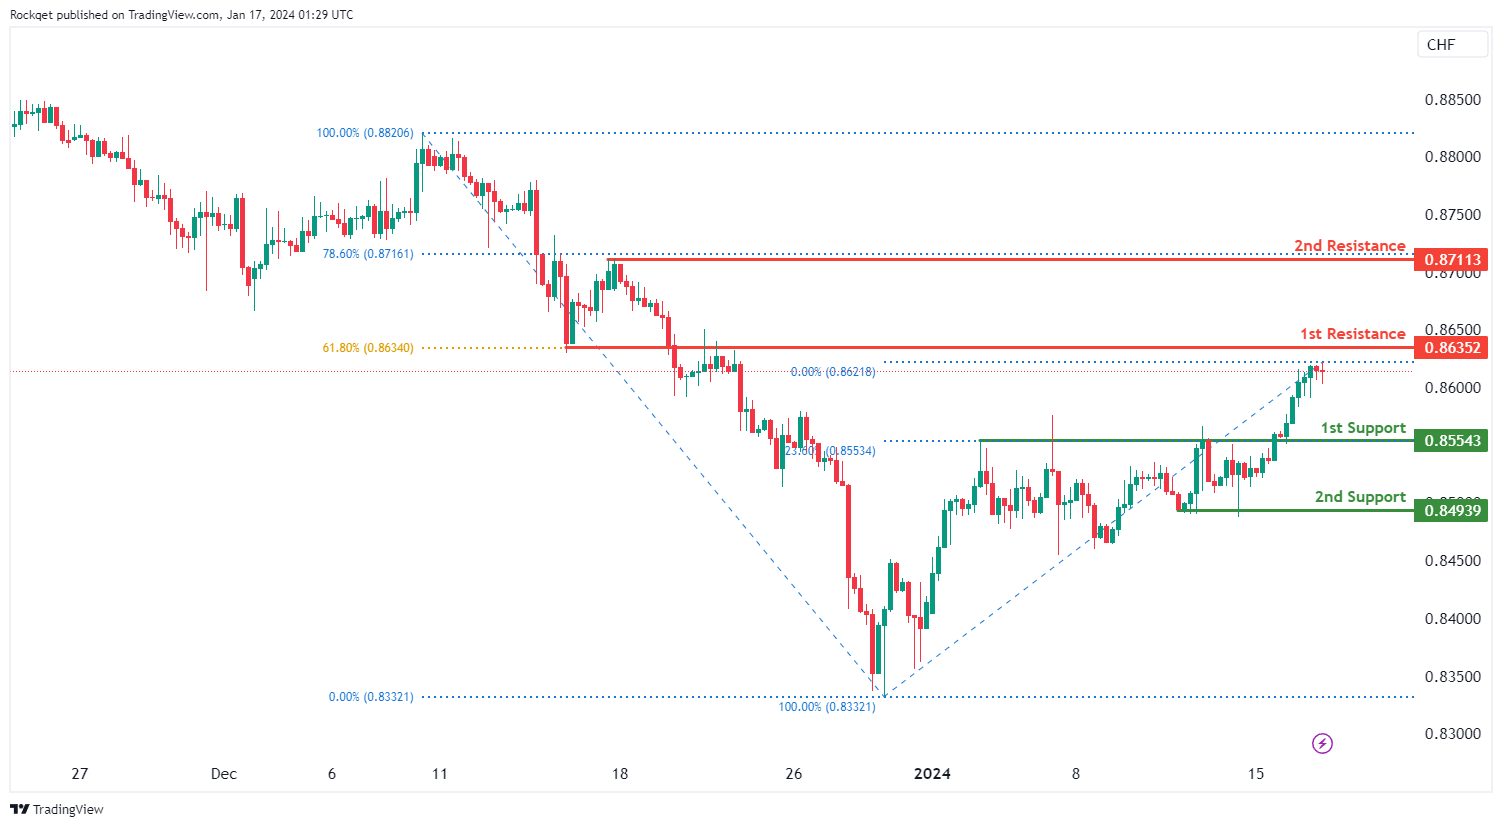
The USD/CHF chart currently exhibits an overall bullish momentum. In this context, there is a potential scenario for price to make a bullish continuation towards the 1st resistance.
The 1st resistance level at 0.8635 is identified as an overlap resistance that aligns with the 61.80% Fibonacci retracement level. Higher up, the 2nd resistance level at 0.8711 is noted as a pullback resistance that aligns with the 78.60% Fibonacci retracement level, further reinforcing its significance as a potential resistance zone.
To the downside, the 1st support level at 0.8554 is identified as a pullback support that aligns with the 23.60% Fibonacci retracement level. Further below, the 2nd support level at 0.8493 is also marked as a pullback support, further reinforcing its importance as a key support level.
USD/JPY:
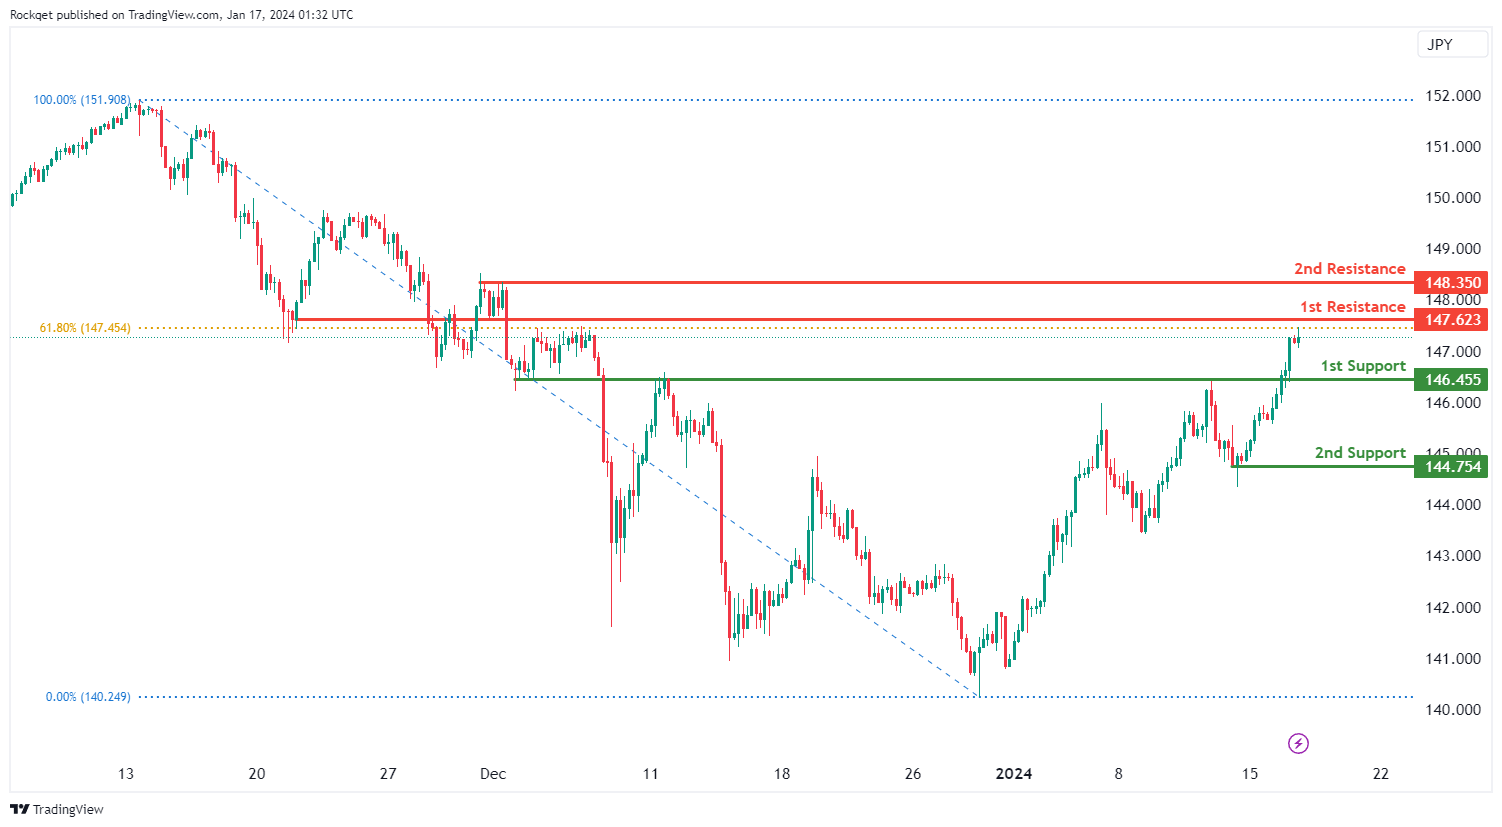
The USD/JPY chart currently exhibits an overall bullish momentum. In this context, there is a potential scenario for price to make a bullish continuation towards the 1st resistance.
The 1st resistance level at 147.62 is identified as an overlap resistance that aligns close to the 61.80% Fibonacci retracement level. Higher up, the 2nd resistance level at 148.35 is noted as a pullback resistance, further reinforcing its significance as a potential resistance zone.
To the downside, the 1st support level at 146.45 is identified as an overlap support. Further below, the 2nd support level at 144.75 is marked as a pullback support, further reinforcing its importance as a key support level.
USD/CAD:
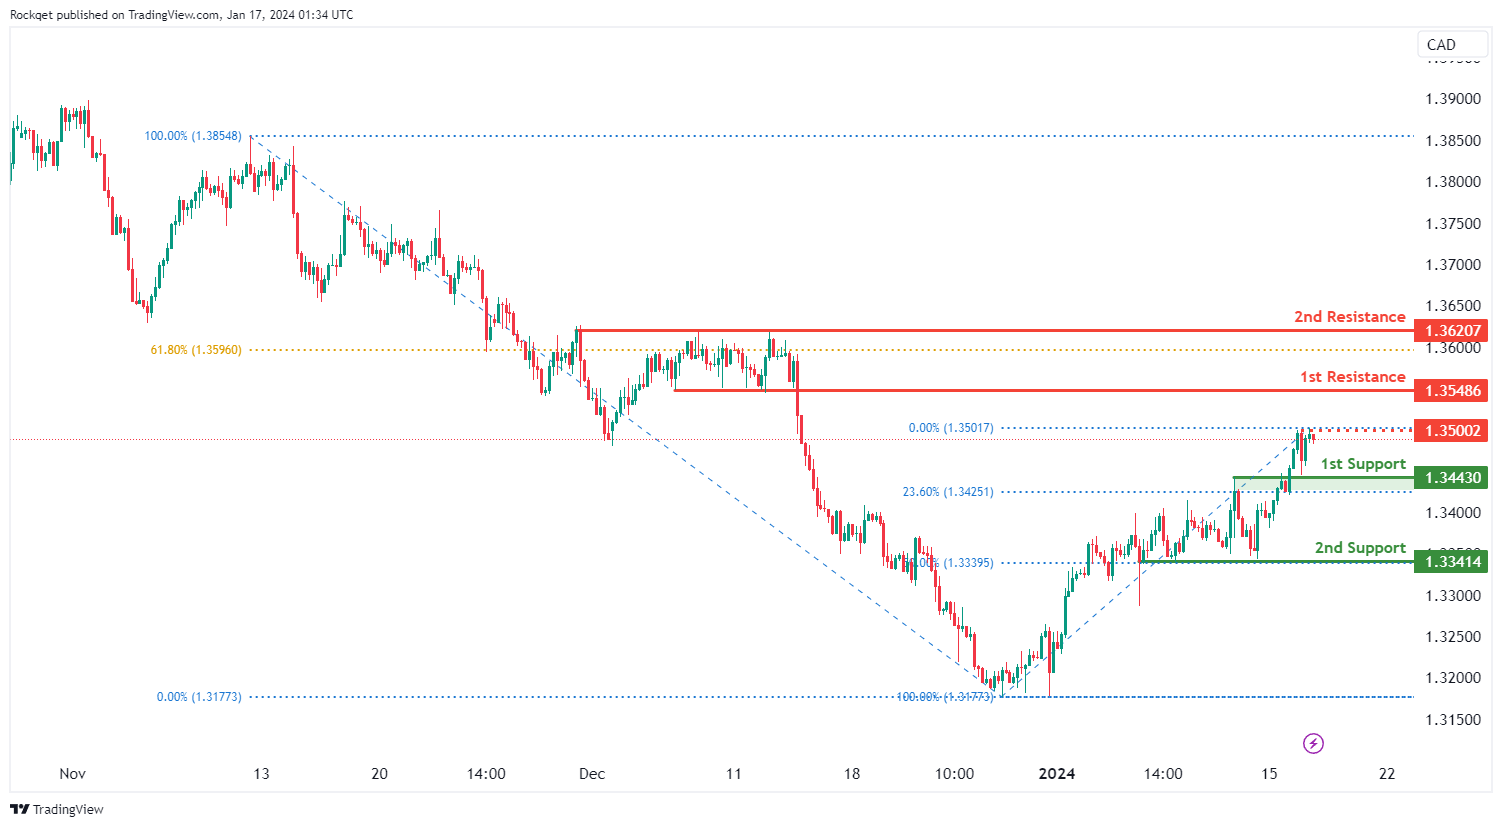
The USD/CAD chart currently exhibits an overall bullish momentum. In this context, there is a potential scenario for price to rise towards the 1st resistance.
The intermediate resistance level at 1.3500 is identified as an overlap resistance while the 1st resistance level at 1.3548 is marked as a pullback resistance. Higher up, the 2nd resistance level at 1.3620 is also noted as a pullback resistance that aligns close to the 61.80% Fibonacci retracement level, further reinforcing its significance as a potential resistance zone.
To the downside, the 1st support level at 1.3443 is identified as an overlap support that aligns close to the 23.60% Fibonacci retracement level. Further below, the 2nd support level at 1.3341 is marked as a pullback support that aligns with the 50.00% Fibonacci retracement level, further reinforcing its importance as a key support level.
AUD/USD:
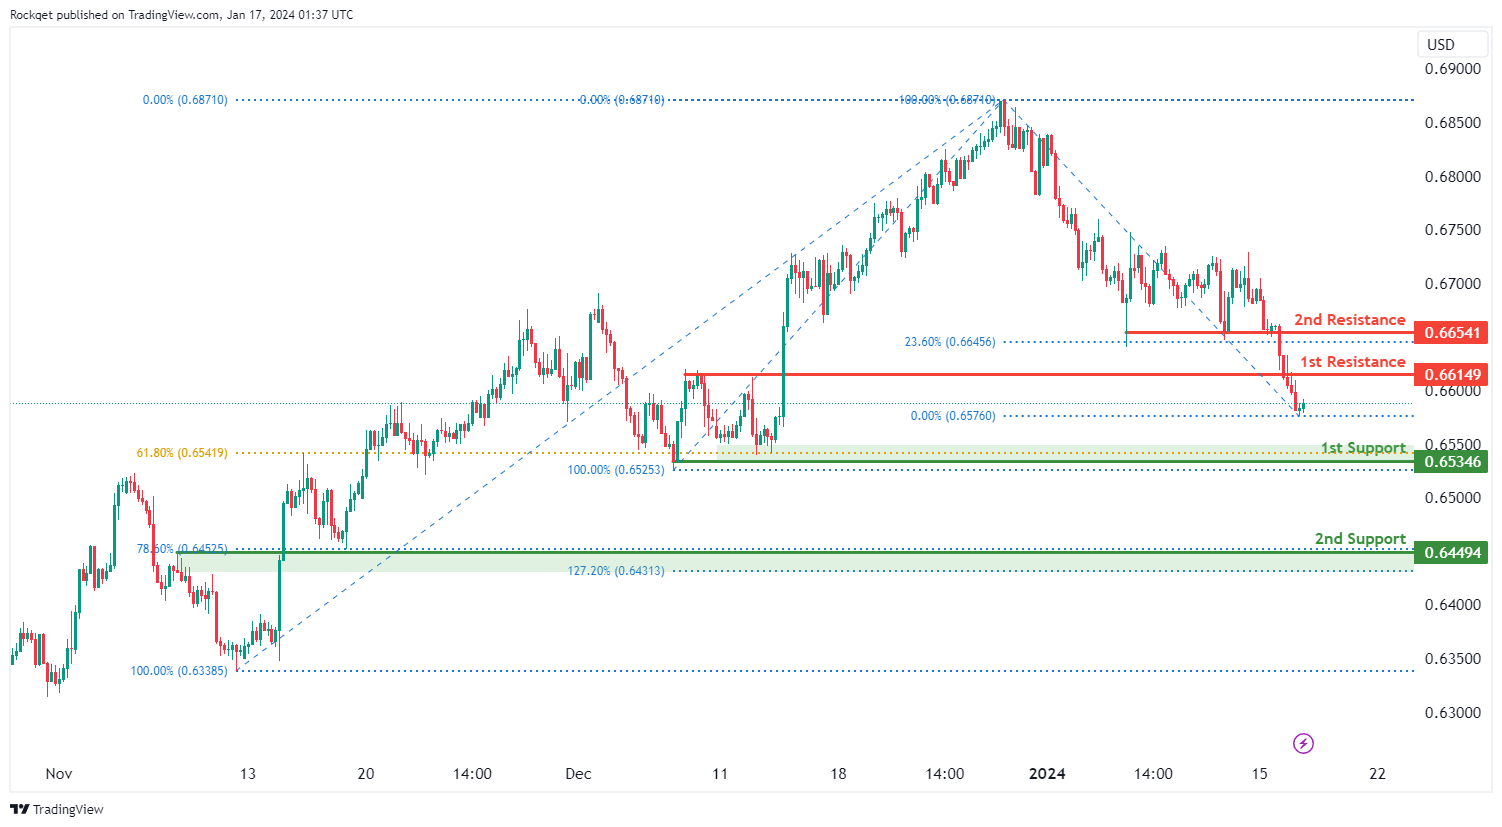
The AUD/USD chart currently exhibits an overall bearish momentum. In this context, there is a potential scenario for price to drop towards the 1st support.
The 1st support level at 0.6534 is identified as a pullback support that aligns with the 61.80% Fibonacci retracement level. Further below, the 2nd support level at 0.6449 is marked as an overlap support that aligns with a confluence of Fibonacci levels i.e. the 78.60% retracement and the 127.20% extension, further reinforcing its importance as a key support level.
To the upside, the 1st resistance level at 0.6614 is identified as a pullback resistance. Higher up, the 2nd resistance level at 0.6654 is also noted as a pullback resistance that aligns close to the 23.60% Fibonacci retracement level, suggesting a potential barrier for further upside movement.
NZD/USD
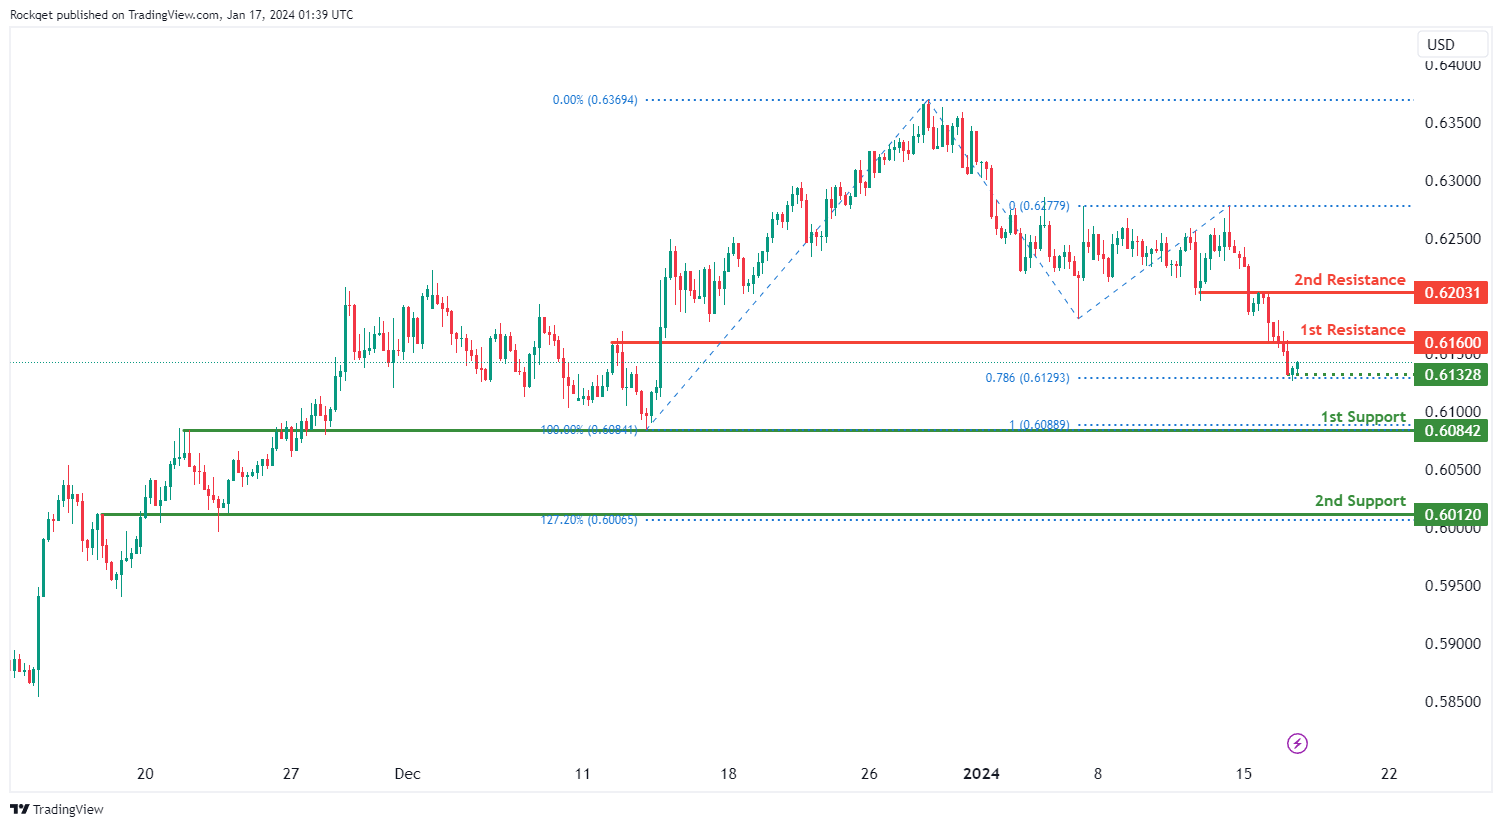
The NZD/USD chart currently exhibits an overall bearish momentum. In this context, there is a potential scenario for price to drop towards the 1st support.
The intermediate support level at 0.6132 is identified as a pullback support that aligns with the 78.60% Fibonacci projection level while the 1st support level at 0.6084 is noted as an overlap support that aligns with the 100.00% Fibonacci projection level. Further below, the 2nd support level at 0.6012 is also marked as an overlap support that aligns with the 127.20% Fibonacci extension level, further reinforcing its importance as a key support level.
To the upside, the 1st resistance level at 0.6160 is identified as a pullback resistance. Higher up, the 2nd resistance level at 0.6203 is noted as an overlap resistance, suggesting a potential barrier for further upside movement.
DJ30:
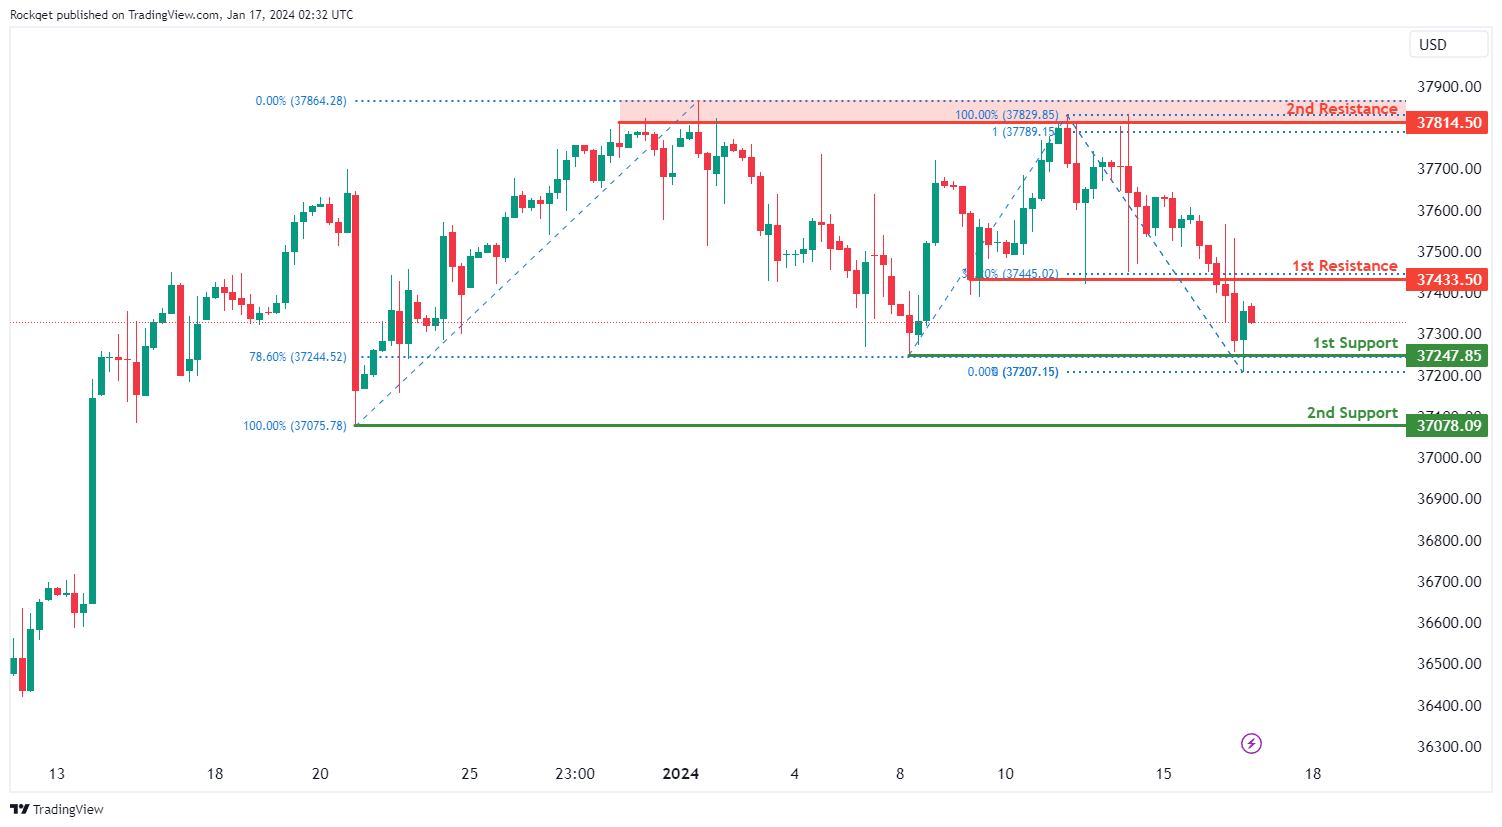
The DJ30 chart currently exhibits a neutral overall momentum, indicating a lack of a clear trend direction. The price could potentially experience fluctuations between the 1st resistance and 1st support levels.
The 1st support at 37247.85 is considered favorable due to its identification as a swing low support, indicating a historical level where buying interest has emerged. Additionally, this level aligns with the 78.60% Fibonacci Retracement, adding confluence to its potential as a support zone. The 2nd support at 37078.09 is recognized as a swing low support, further reinforcing its significance as a potential level of buying interest.
On the resistance side, the 1st resistance at 37433.50 is identified as an overlap resistance, suggesting a historical point where selling interest has been present. The 2nd resistance at 37814.50 is associated with multi-swing high resistance, indicating a zone where selling pressure may intensify.
GER40:
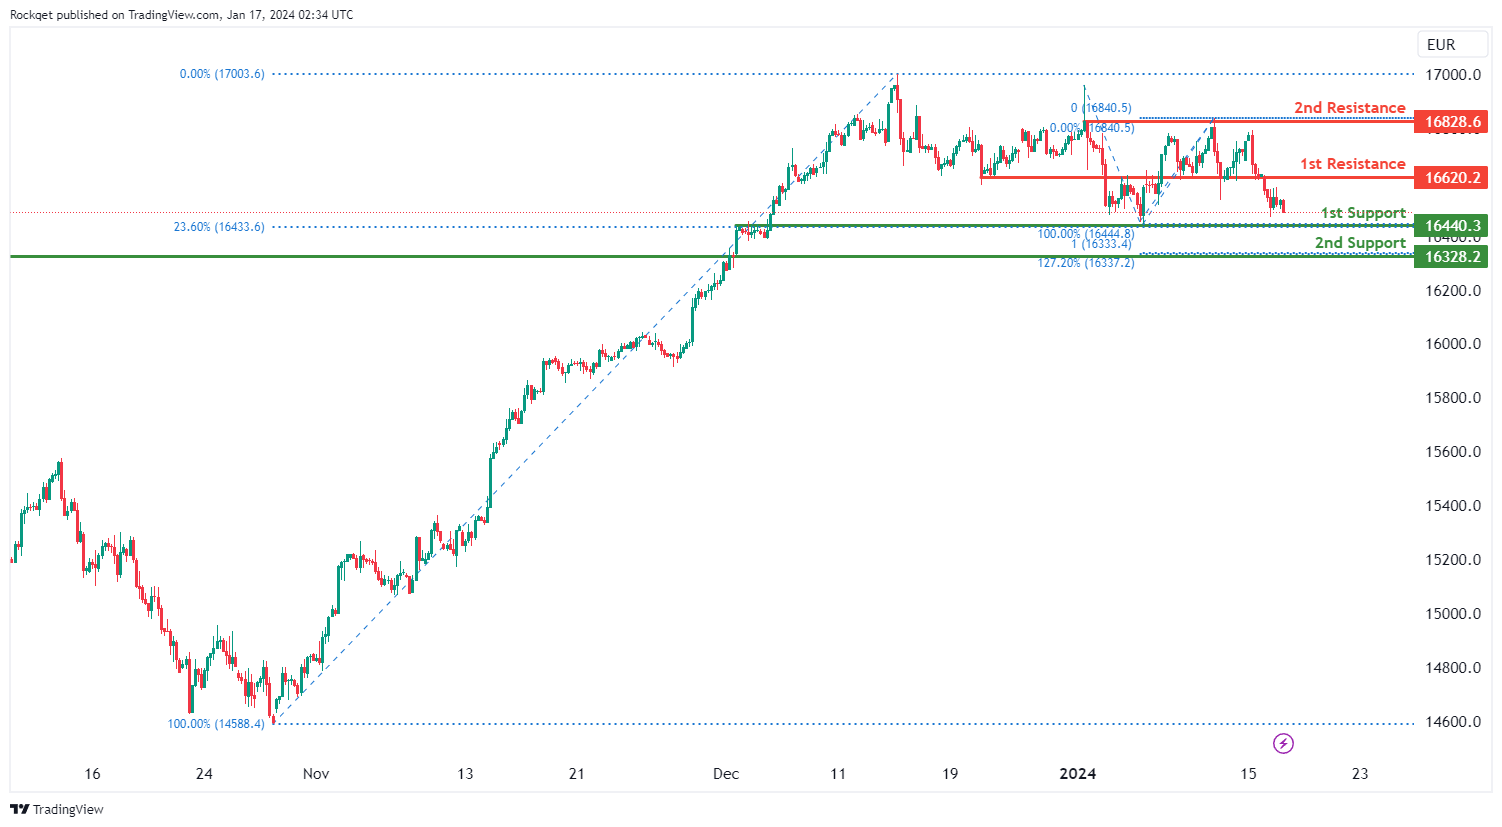
The GER40 chart currently displays a bearish overall momentum, indicating a prevailing downward trend. Several factors contribute to this bearish momentum, suggesting a potential continuation of the downtrend.
The 1st support at 16440.30 is considered favorable due to its identification as an overlap support. This level also coincides with the 23.60% Fibonacci Retracement, indicating historical significance and suggesting a potential level where buying interest has previously emerged. Additionally, the 2nd support at 16328.20 is recognized as a pullback support and aligns with the 127.20% Fibonacci Extension, providing additional strength to this potential support level.
On the resistance side, the 1st resistance at 16620.20 is identified as an overlap resistance, indicating a historical point where selling interest has been present. The 2nd resistance at 16828.60 is associated with swing high resistance, suggesting a zone where selling pressure may intensify.
US500:
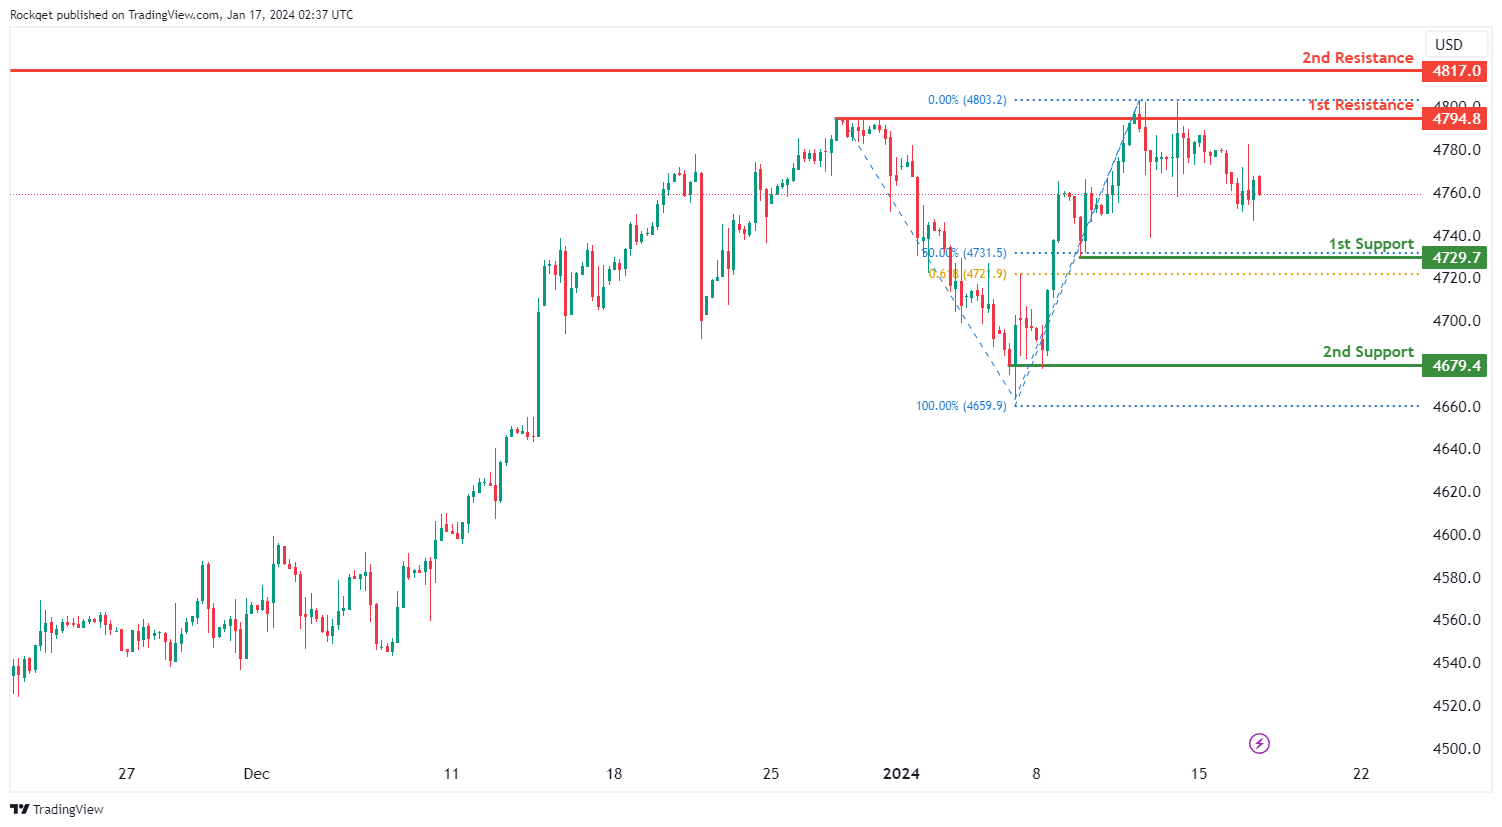
The US500 chart currently reflects a neutral overall momentum, indicating a lack of a clear trend direction. Several factors contribute to this neutral momentum, suggesting potential fluctuations between the 1st resistance and 1st support levels.
The 1st support at 4729.7 is considered favorable due to its identification as a pullback support. This level also coincides with the 61.80% Fibonacci Projection, adding confluence to its potential as a support level. Additionally, the 2nd support at 4679.4 is recognized as a swing low support, providing additional strength to the support zone.
On the resistance side, the 1st resistance at 4794.8 is identified as a multi-swing high resistance, indicating a historical point where selling interest has been present. Furthermore, the intermediate resistance at 4817.0 is associated with swing high resistance, suggesting a zone where selling pressure may intensify.
BTC/USD:
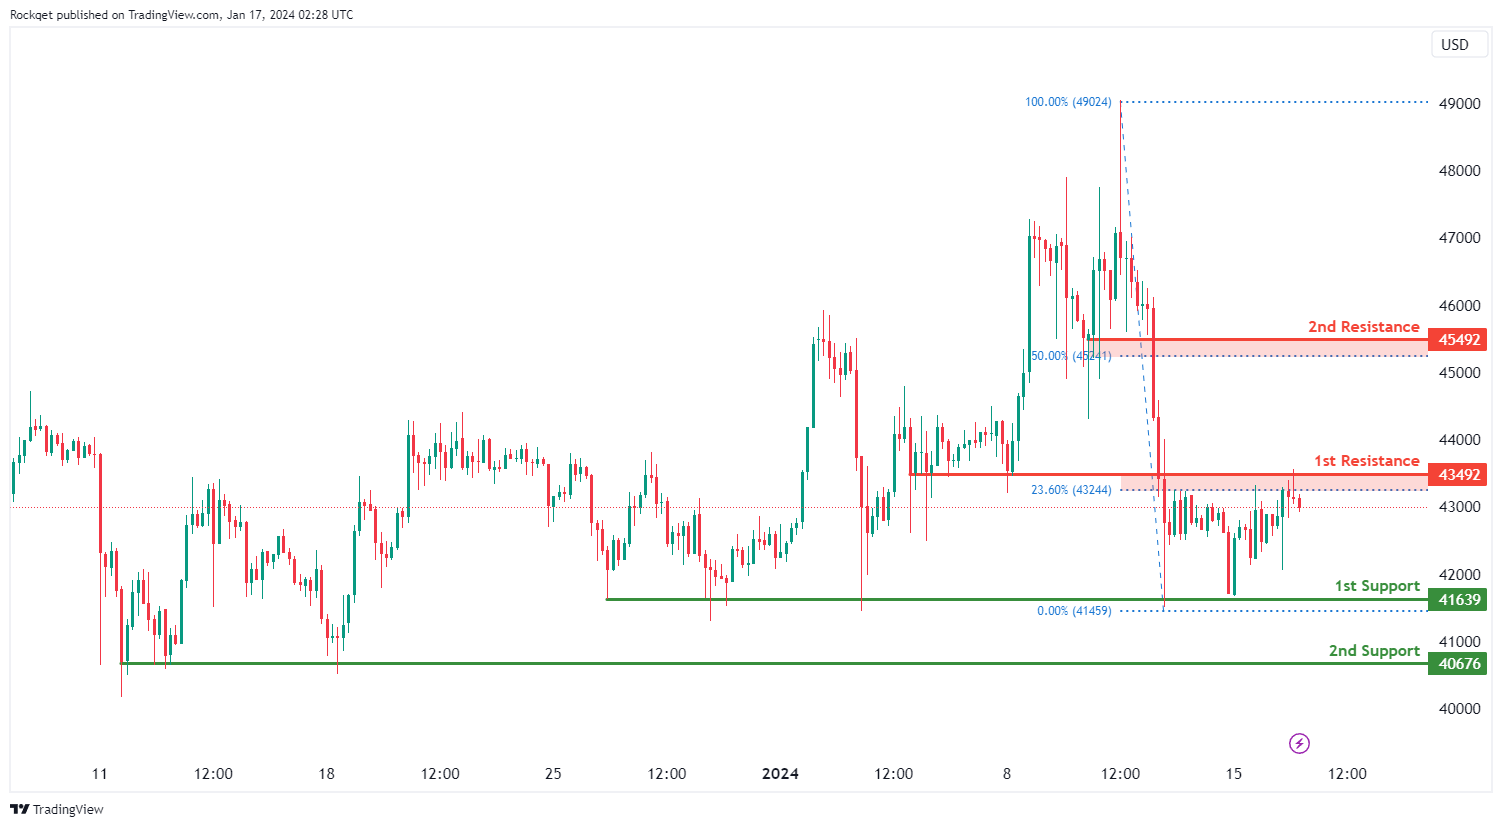
The BTC/USD chart currently displays a bearish overall momentum, indicating a downward trend. There is a potential scenario where the price could experience a bearish reaction off the 1st resistance and drop to the 1st support.
The 1st support at 41639 is considered favorable due to its identification as a multi-swing low support. This level suggests historical significance, serving as a point where buying interest has previously emerged. Additionally, the 2nd support at 40679 is recognized as another multi-swing low support, adding confluence to the potential support zone.
On the resistance side, the 1st resistance at 43492 is identified as an overlap resistance and aligns with the 23.60% Fibonacci Retracement. This confluence of technical factors adds strength to the potential resistance level. Furthermore, the 2nd resistance at 45492 is acknowledged as a pullback resistance and corresponds to the 50% Fibonacci Retracement.’
ETH/USD:
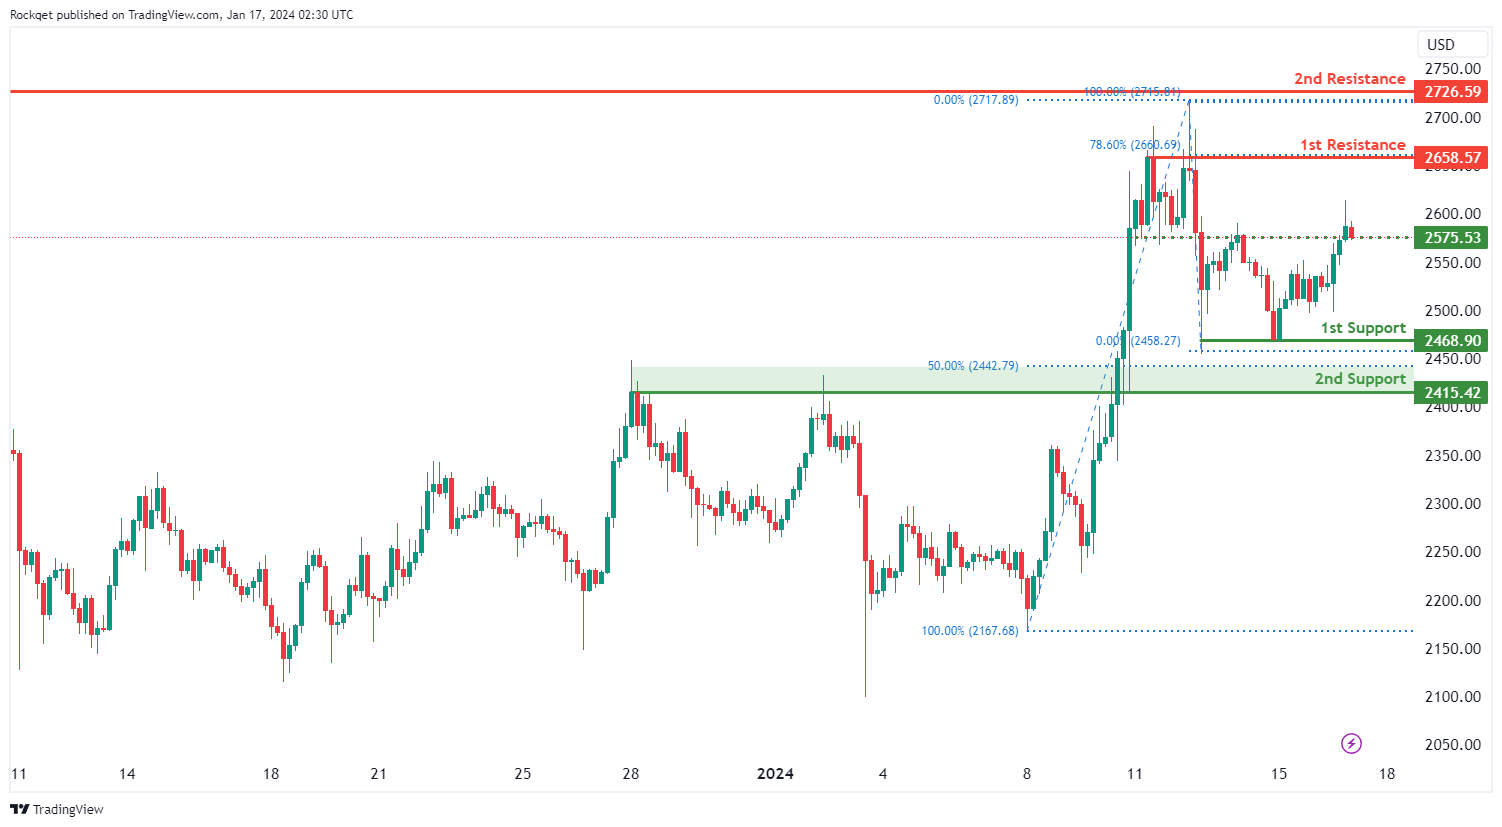
The ETH/USD chart currently exhibits a neutral overall momentum, suggesting a lack of a clear trend direction. There is a potential scenario where the price could make fluctuations between the 1st resistance and 1st support levels.
The 1st support at 2568.90 is considered favorable due to its identification as a pullback support. This level suggests historical significance, acting as a point where buying interest has previously emerged. Additionally, the 2nd support at 2415.42 is recognized as another pullback support, adding confluence to the potential support zone.
On the resistance side, the 1st resistance at 2658.57 is identified as a swing high resistance and aligns with the 78.60% Fibonacci Retracement. This confluence of technical factors adds strength to the potential resistance level. Furthermore, the 2nd resistance at 2726.59 is acknowledged as a swing high resistance.
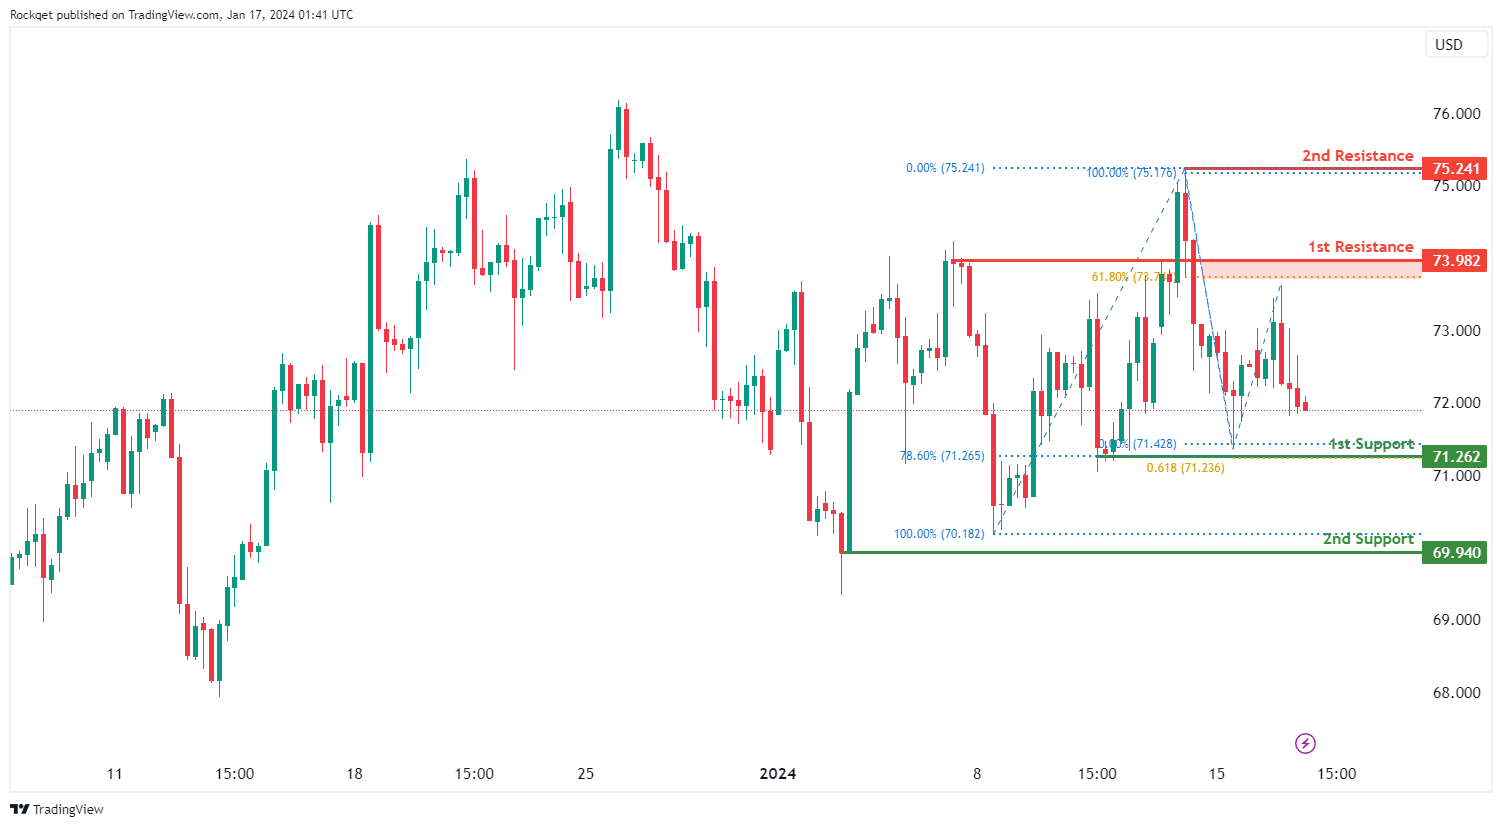
WTI/USD:
The WTI (West Texas Intermediate) chart currently exhibits a neutral bias, indicating a potential for price to fluctuate between the 1st resistance and the 1st support.
The 1st resistance level at 73.98 is identified as a pullback resistance that aligns close to the 61.80% Fibonacci retracement level. Higher up, the 2nd resistance level at 75.24 is noted as a swing-high resistance, suggesting a potential barrier for further upside movement.
To the downside, the 1st support level at 71.26 is identified as a pullback support that aligns with a confluence of Fibonacci levels i.e. the 78.60% retracement and the 61.80% projection. Further below, the 2nd support level at 69.94 is marked as a swing-low support, further reinforcing its importance as a key support level.
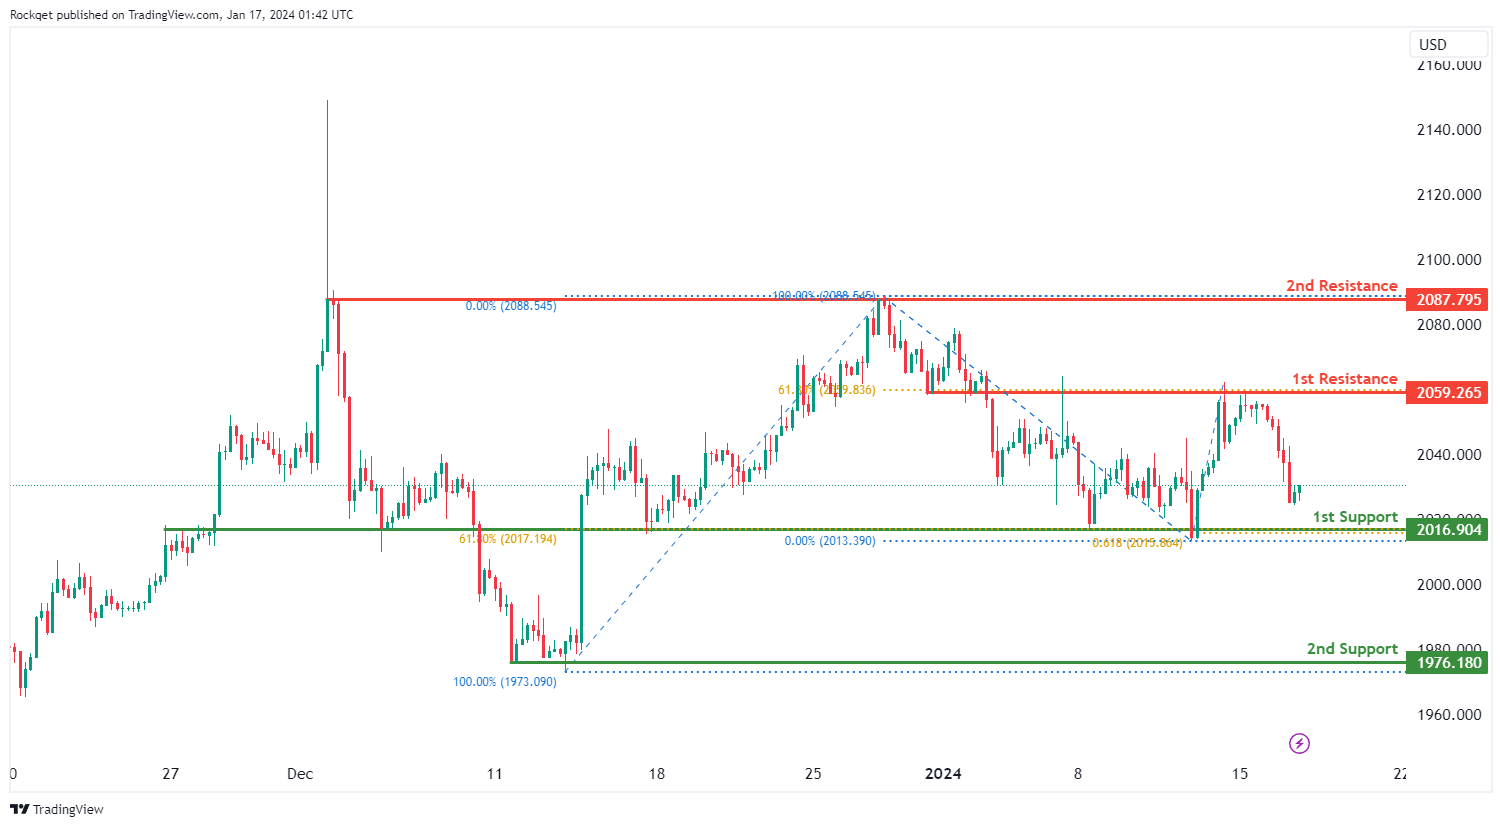
XAU/USD (GOLD):
The XAU/USD (Gold/US Dollar) chart currently shows an overall bearish momentum. In this context, there is a potential scenario for price to make a bearish continuation towards the 1st support.
The 1st support level at 2,016.90 is marked as an overlap support that aligns with a confluence of Fibonacci levels i.e. the 61.80% retracement and the 61.80% projection. Further below, the 2nd support level at 1,976.18 is categorized as a swing-low support, further reinforcing its significance as a potential support zone.
On the resistance side, the 1st resistance level at 2,059.26 is identified as an overlap resistance that aligns with the 61.80% Fibonacci retracement level. Higher up, the 2nd resistance level at 2,087.79 is marked as a multi-swing-high resistance, indicating a significant potential resistance point.


