
In this technical blog, we will look at the past performance of the 4-hour Elliott Wave Charts of Natural Gas ticker symbol: $NG_F. In which, the rally from the 29 March 2023 low unfolded in an impulse sequence & provided an extreme trading opportunity. In this case, the pullback managed to reach the equal legs area & provided a buying opportunity. So, we advised members not to sell it but to buy the equal legs area for a minimum reaction higher to happen. We will explain the structure & forecast below:
Natural Gas 4-hour Elliott Wave Chart From 12.03.2023
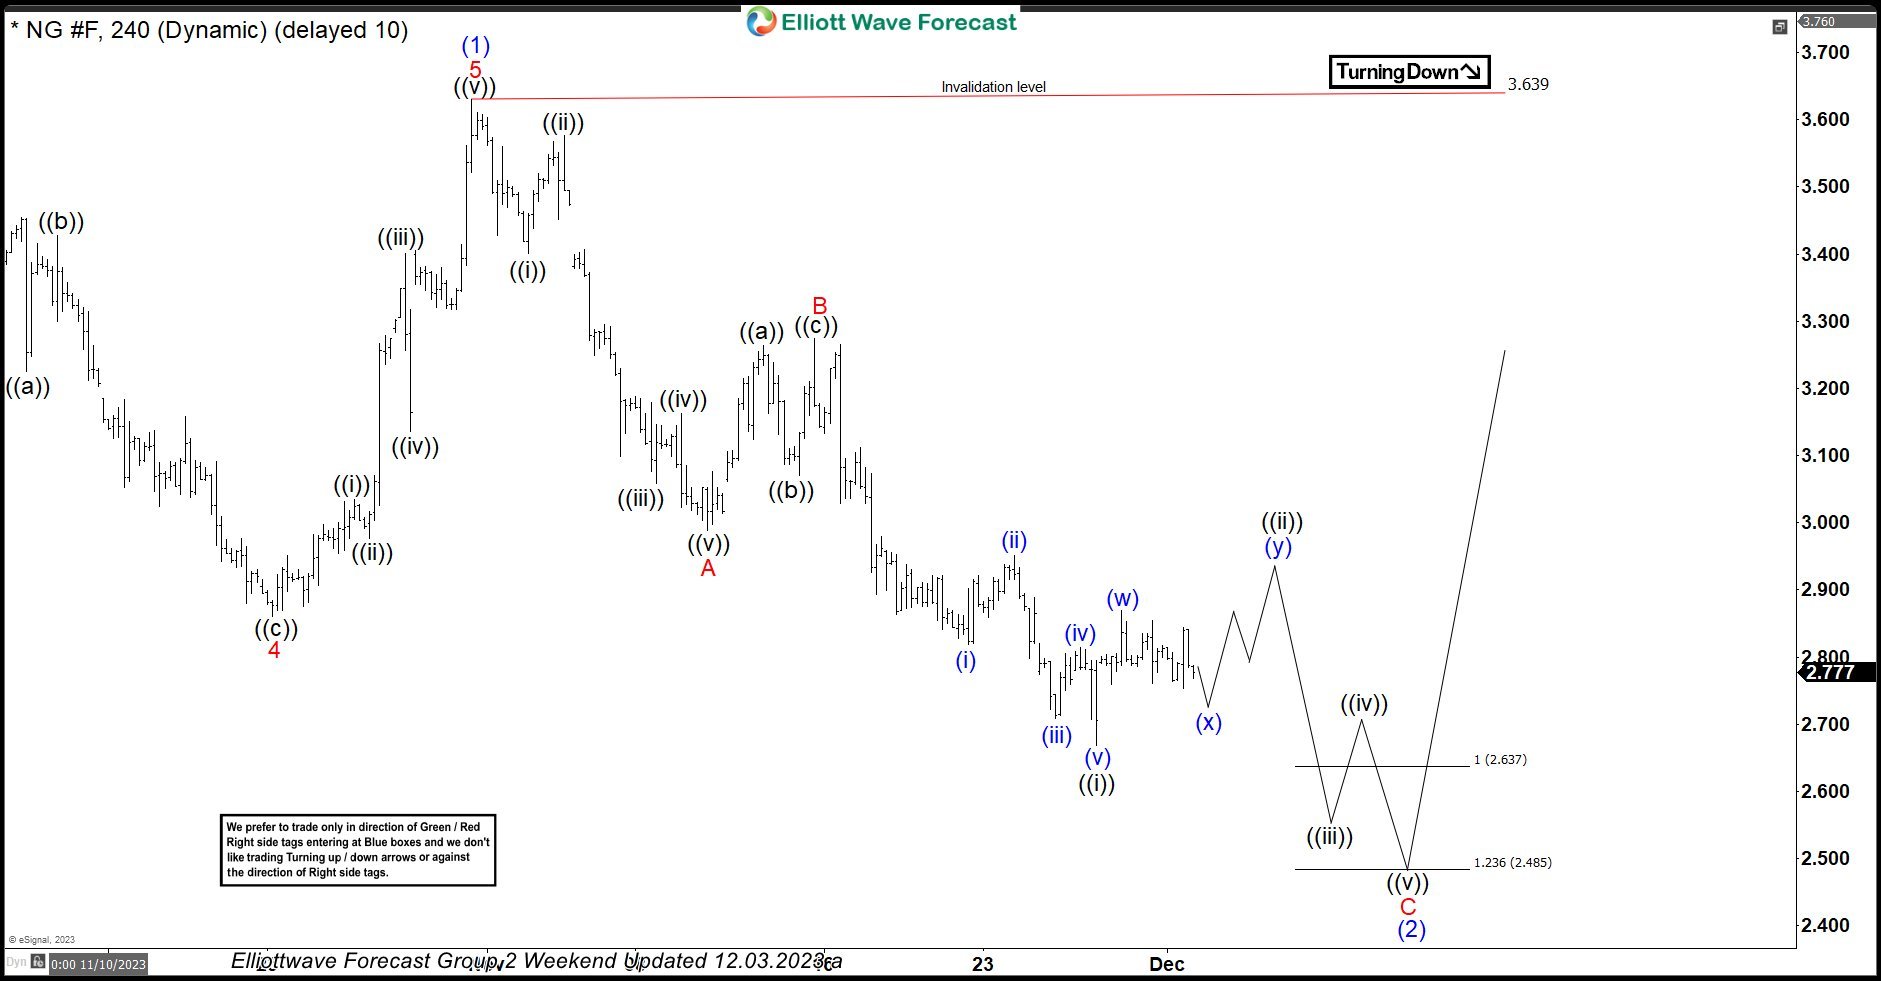
Here’s the Elliott wave Chart from the 12/03/2023 weekend update. In which, rally to $3.630 high ended the wave (1) & made a pullback in wave (2). The internals of that pullback unfolded as Elliott wave zigzag structure where wave A ended at $2.989 low. A bounce to $3.275 high ended wave B bounce. Then started the next leg lower in wave C towards $2.637- $2.485 equal legs area. From there, buyers were expected to appear looking for new highs ideally or for a 3-wave bounce minimum.
Natural Gas 4-hour Elliott Wave Chart From 1.07.2024
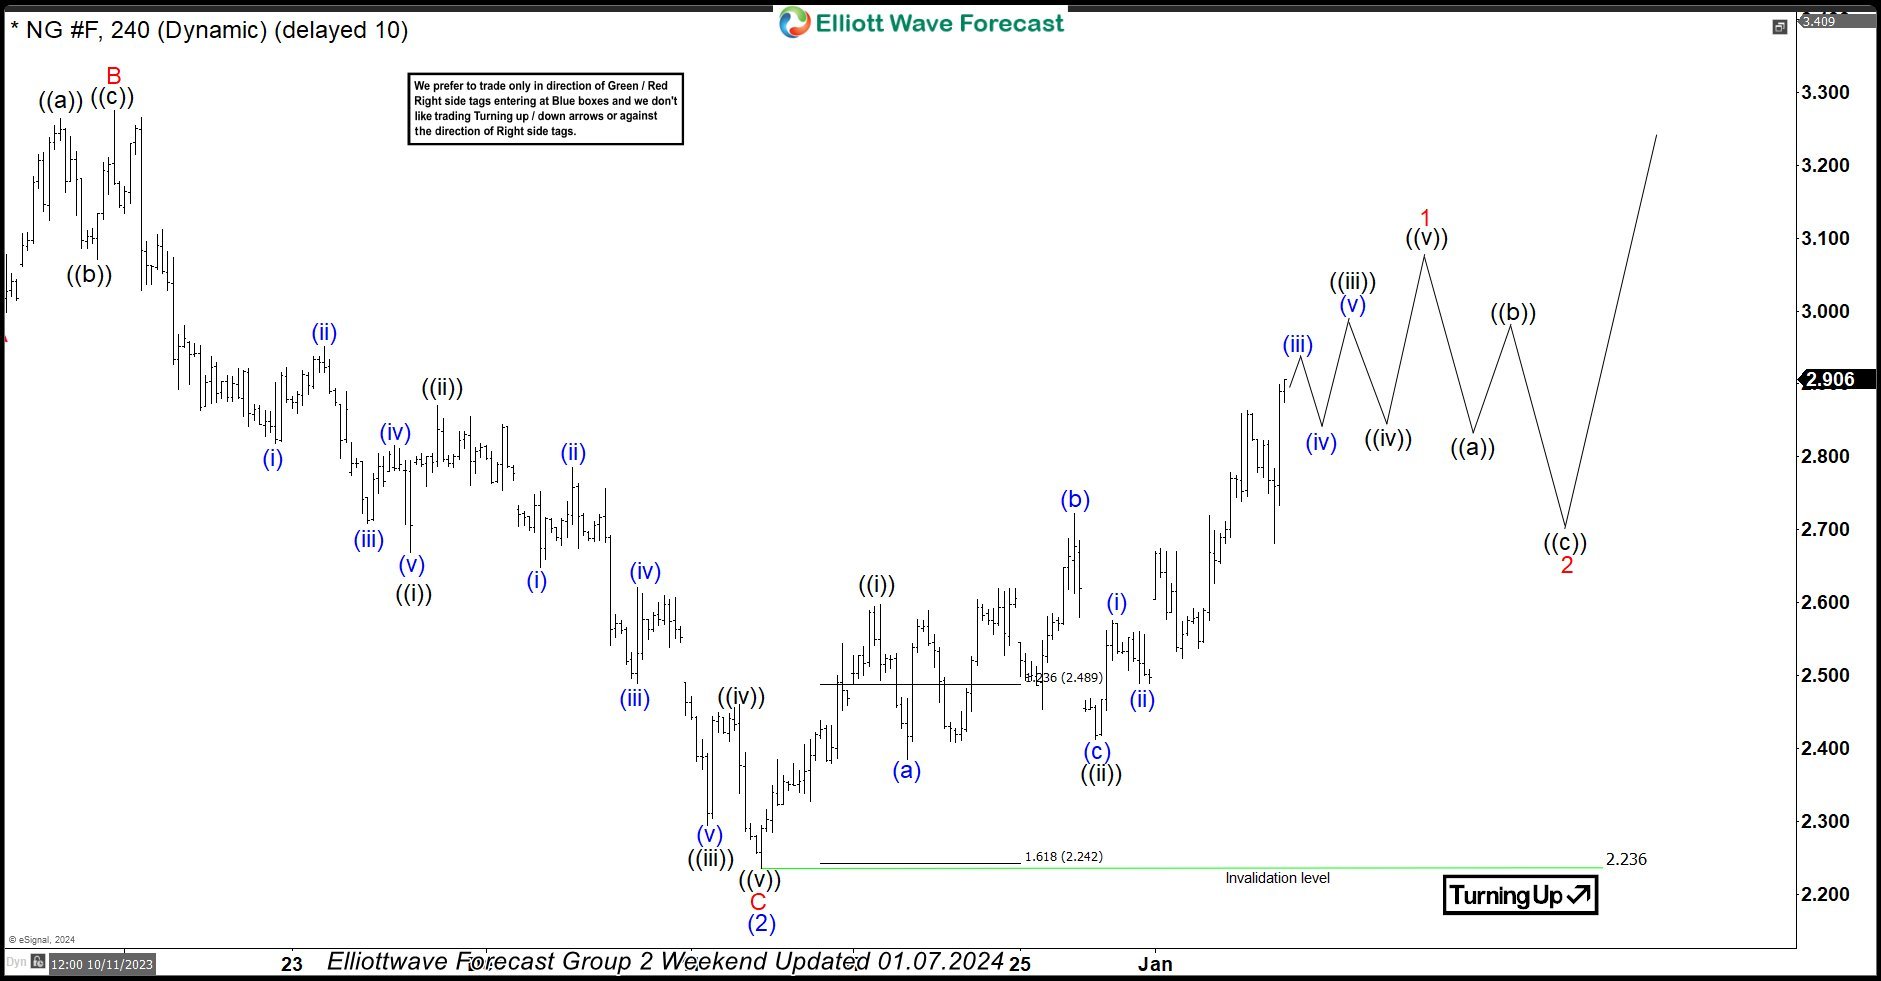
Above is the Elliott wave Chart from the 1/07/2024 Weekend update. The Natural Gas is showing a reaction higher taking place from the equal legs area. Right after ending the zigzag correction. Allowed members to create a risk-free position shortly after taking a long position. However, a break above $3.630 high is yet to be seen to confirm the next extension higher & avoid a double correction lower.


