
DXY:
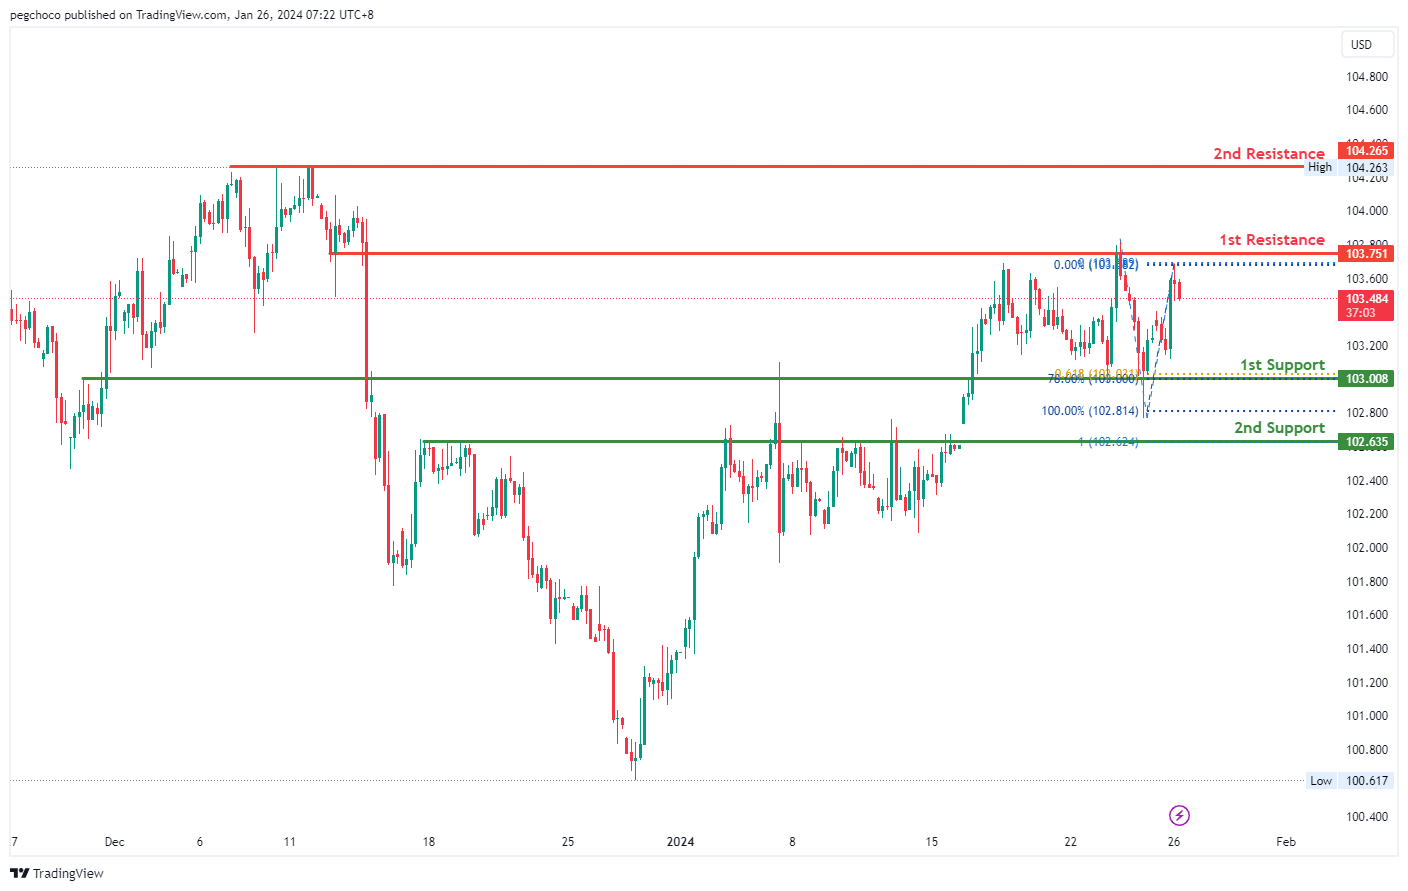
The DXY (US Dollar Currency Index) chart is currently displaying a bearish overall momentum, indicating weakness in the US Dollar. According to your analysis, there is potential for a bearish continuation in the price towards the 1st support level.
The 1st support level at 103.00 is considered significant for several reasons. It represents an overlap support, indicating that this price level has historically acted as both support and resistance. Additionally, it coincides with the 78.60% Fibonacci Retracement level and the 61.80% Fibonacci Projection, indicating Fibonacci confluence. This confluence of Fibonacci levels adds significant strength to this support zone, suggesting it may serve as a strong area where price could potentially find support during a bearish move.
The 2nd support level at 102.63 is identified as a pullback support and also coincides with the 100% Fibonacci Projection, further reinforcing its importance as a potential support level during price pullbacks.
On the resistance side, the 1st resistance level at 103.75 is recognized as an overlap resistance, indicating that this price level has historically served as both support and resistance. This makes it a potential barrier where selling pressure could emerge.
The 2nd resistance level at 104.26 is categorized as a multi-swing high resistance, indicating that it represents a historical point where the price has encountered resistance and potential selling interest.
EUR/USD:
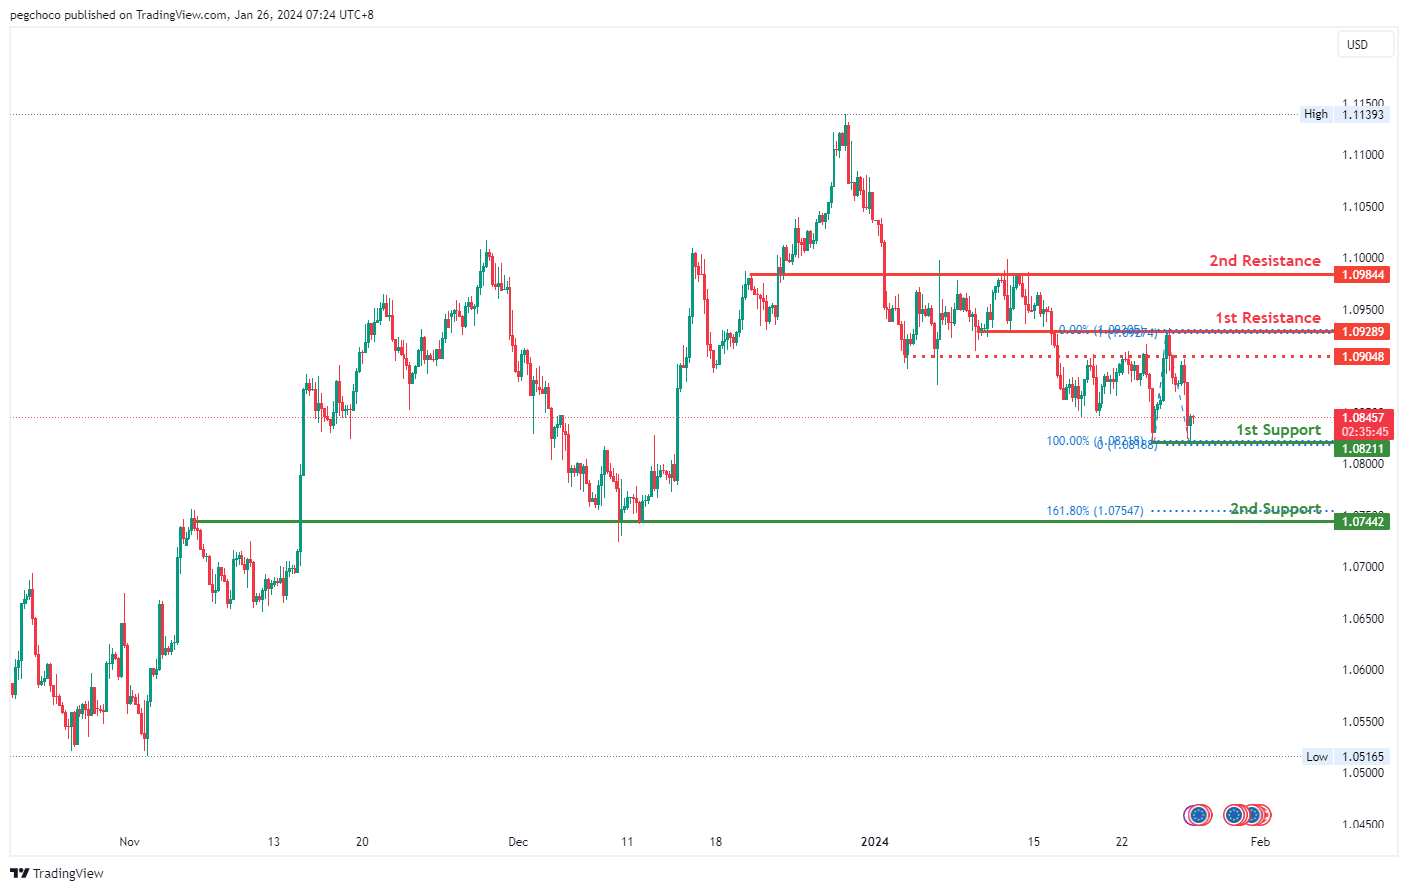
The EUR/USD trading pair is currently exhibiting a bullish overall momentum, indicating strength in the Euro relative to the US Dollar. Your analysis suggests that there is potential for a bullish continuation in the price towards the 1st resistance level.
The 1st support level at 1.0821 is considered significant for several reasons. It represents a swing low support and coincides with the 100% Fibonacci Projection, indicating that this level corresponds to a previous significant low point on the chart and that Fibonacci confluence adds to its importance as a potential support level.
The 2nd support level at 1.0744 is identified as an overlap support and also aligns with the 161.80% Fibonacci Extension level, further reinforcing its significance as a support zone.
On the resistance side, the 1st resistance level at 1.0928 is recognized as an overlap resistance, indicating that this price level has historically served as both support and resistance. This makes it a potential barrier where selling pressure could emerge.
The 2nd resistance level at 1.0984 is also identified as an overlap resistance, emphasizing its historical significance as a potential barrier for further upward price movement.
Additionally, there is an intermediate resistance level at 1.0904, characterized as an overlap resistance. This further supports the idea of potential resistance at this level.
EUR/JPY:
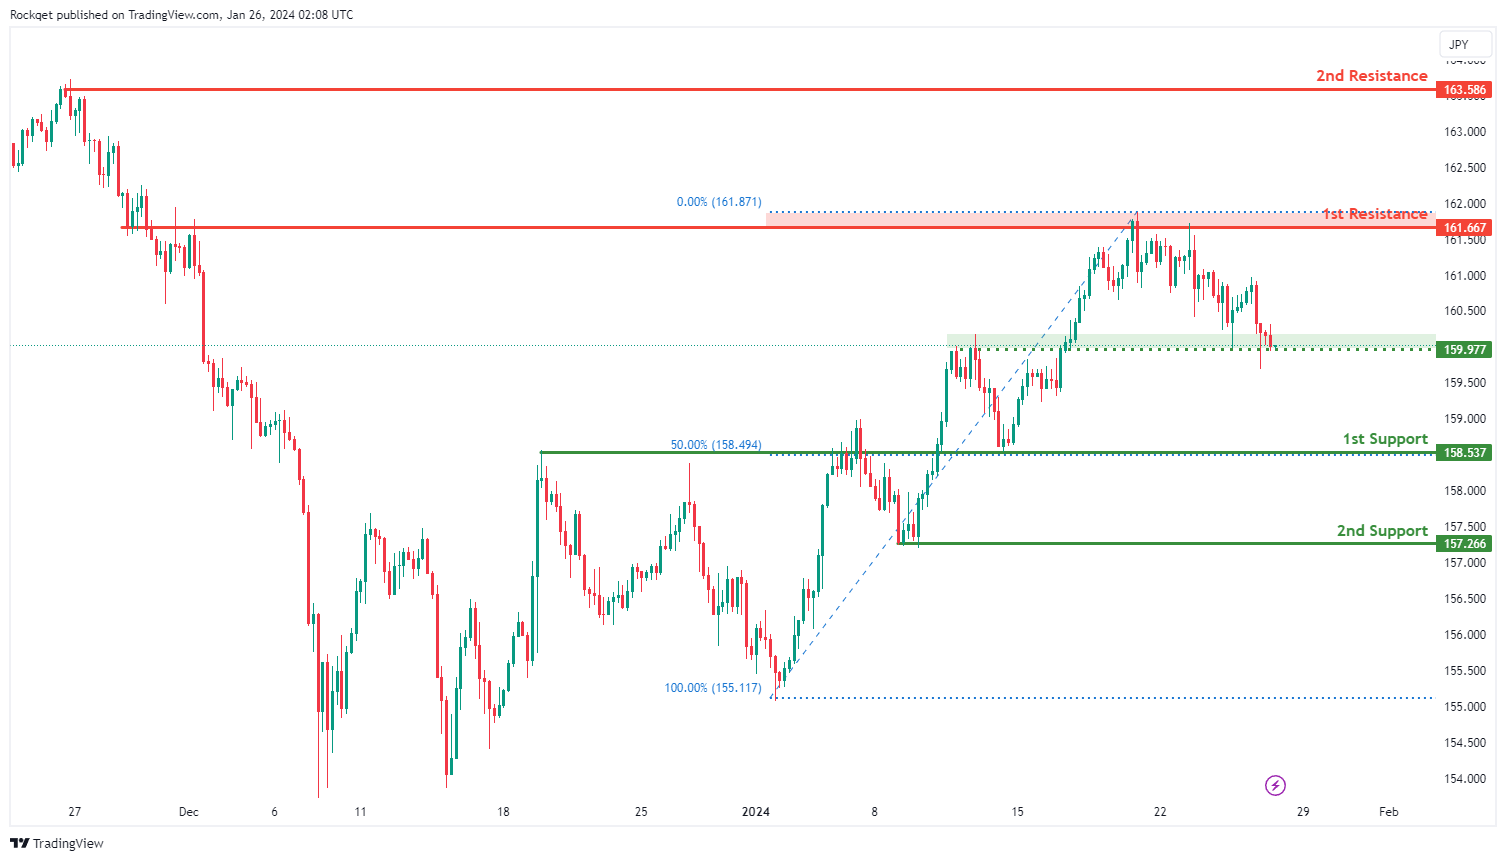
The EUR/JPY chart currently demonstrates a bearish overall momentum, indicating a prevailing downward trend. Several factors contribute to this bearish sentiment, suggesting a potential continuation of the downward movement in the price.
The 1st support at 158.537 is considered favorable due to its identification as an overlap support and alignment with the 50% Fibonacci Retracement. This level indicates historical significance, suggesting a strong level of support.
Additionally, the 2nd support at 157.266 is recognized as a pullback support, providing additional strength to the support zone.
In addition, there is an intermediate support at 159.27, which is considered an overlap support. This level further reinforces the potential support zone.
On the resistance side, the 1st resistance at 161.667 is highlighted as an overlap resistance, indicating a historical level where selling interest may emerge.
Furthermore, the 2nd resistance at 163.586 is acknowledged as a swing high resistance, adding to the potential resistance levels.
EUR/GBP:
The EUR/GBP chart currently exhibits a bearish overall momentum, indicating a prevailing downward trend. Several factors contribute to this bearish sentiment, suggesting a potential continuation of the downward movement in the price.
The 1st support at 0.85306 is considered favorable for its identification as a pullback support, indicating a historical level where buying interest has previously emerged.
Additionally, the 2nd support at 0.85146 is recognized as a swing low support, providing additional strength to the potential support zone. This support level also coincides with the 127.20% Fibonacci Extension, adding confluence to its significance.
On the resistance side, the 1st resistance at 0.85565 is highlighted as an overlap resistance, indicating a historical level where selling interest may emerge.
Furthermore, the 2nd resistance at 0.85889 is acknowledged as another overlap resistance, adding additional significance to this potential resistance level.

GBP/USD:
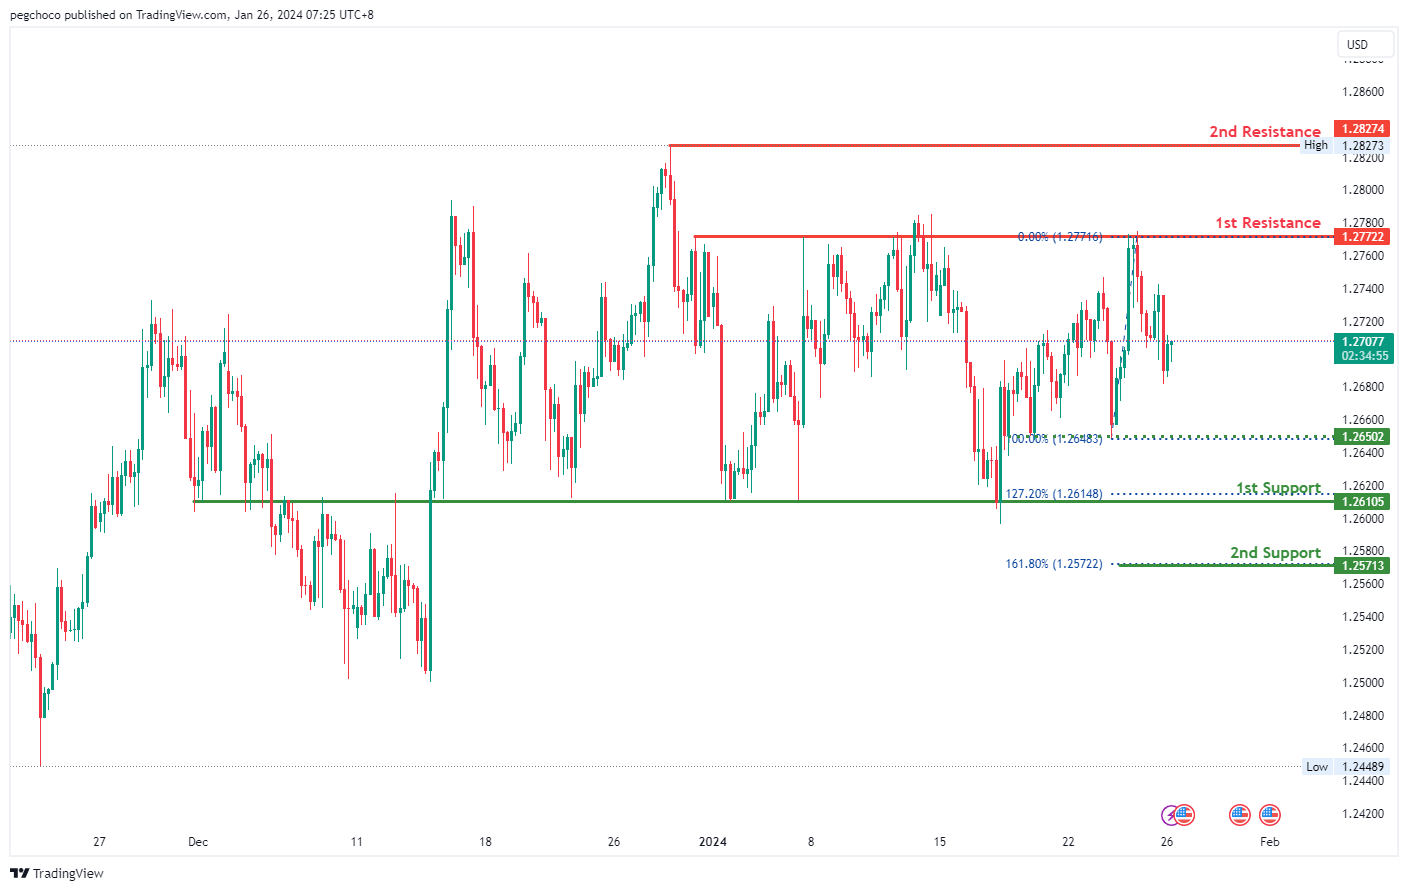
The GBP/USD trading pair currently has a bearish overall momentum, indicating weakness in the British Pound relative to the US Dollar. Your analysis suggests that there is potential for a bearish continuation in the price towards the 1st support level.
The 1st support level at 1.2610 is considered significant for several reasons. It represents an overlap support and coincides with the 127.20% Fibonacci Extension level, indicating that this level corresponds to a previous significant level on the chart, and the Fibonacci confluence adds to its importance as a potential support level during a bearish move.
The 2nd support level at 1.2571 is identified as a support level and aligns with the 161.80% Fibonacci Extension level, further reinforcing its significance as a support zone.
On the resistance side, the 1st resistance level at 1.2772 is recognized as a multi-swing high resistance, indicating that it represents a historical point where the price has encountered resistance and potential selling interest.
The 2nd resistance level at 1.2827 is categorized as a swing high resistance, suggesting that it represents a historical point where the price has encountered resistance.
Additionally, there is an intermediate support level at 1.2650, characterized as a multi-swing low support, which may act as a minor support area during the bearish move.
GBP/JPY:
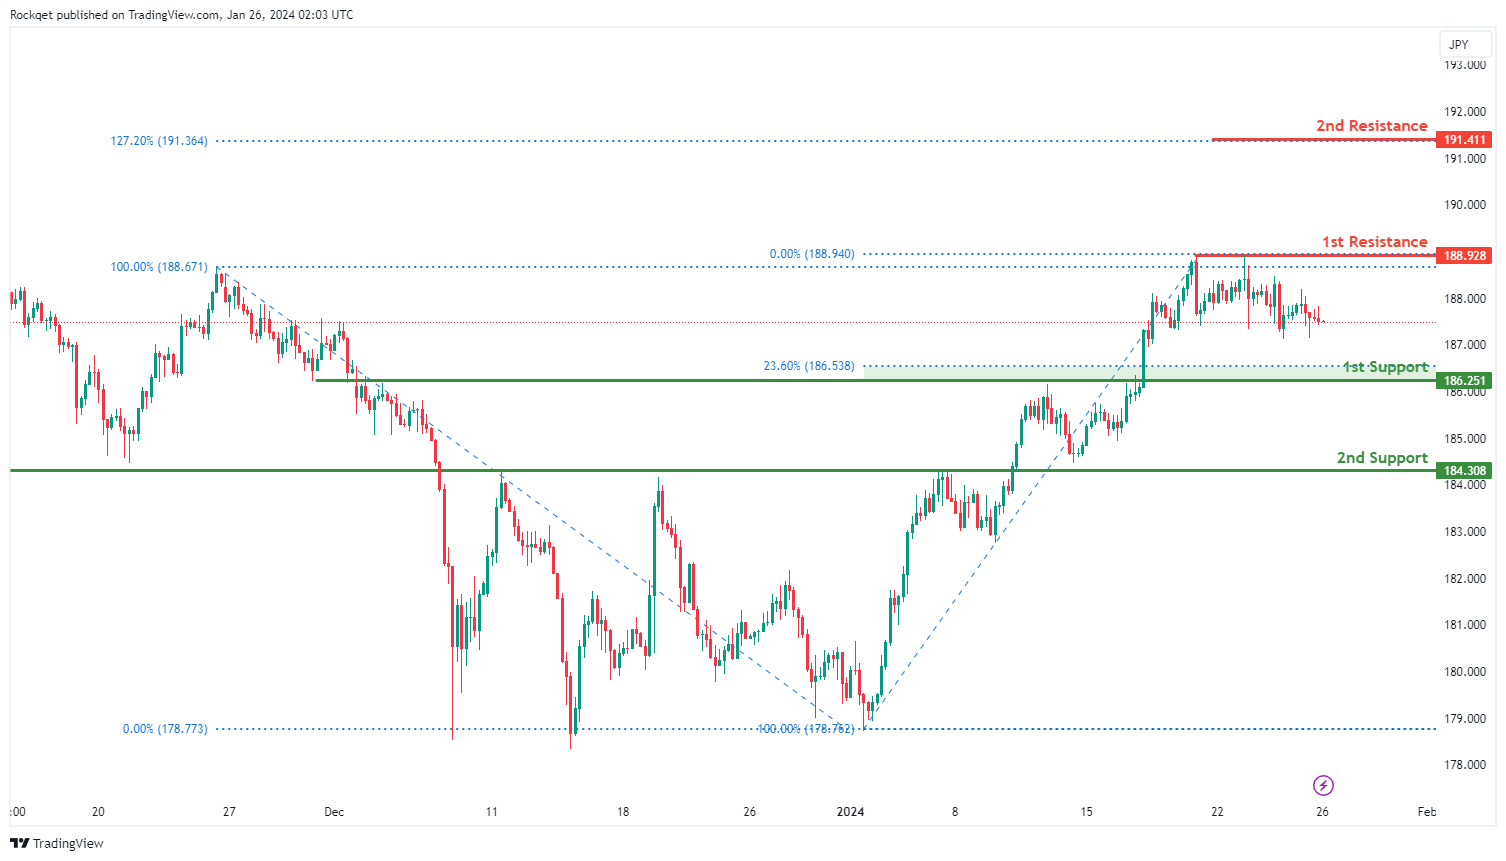
The GBP/JPY chart currently reflects a neutral overall momentum, indicating a lack of a clear trend direction. Several factors contribute to this neutral stance, suggesting potential fluctuations in the price between identified support and resistance levels.
The 1st support at 186.251 is considered favorable due to its identification as an overlap support and alignment with the 23.60% Fibonacci Retracement. This level represents a historical point where buying interest has previously emerged.
Additionally, the 2nd support at 184.308 is recognized as a pullback support, providing additional strength to the support zone.
On the resistance side, the 1st resistance at 188.928 is highlighted as a swing high resistance, indicating a historical level where selling interest may emerge.
Furthermore, the 2nd resistance at 191.411 is acknowledged as a level where the price might encounter resistance, given the 127% Fibonacci Extension.
USD/CHF:
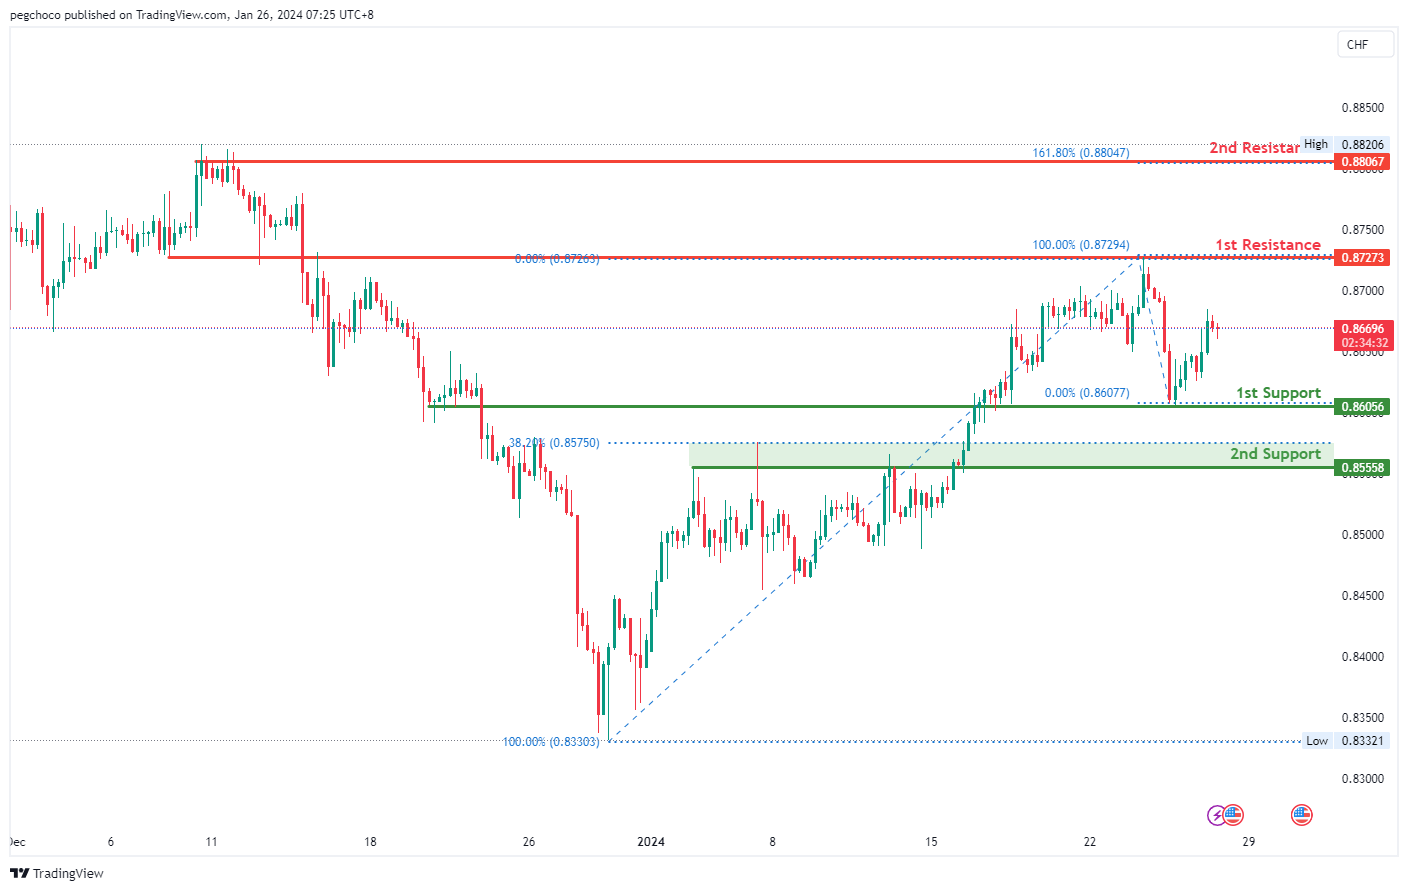
The USD/CHF trading pair currently exhibits a bullish overall momentum, indicating strength in the US Dollar relative to the Swiss Franc. Your analysis suggests that there is potential for a bullish continuation in the price towards the 1st resistance level.
The 1st support level at 0.8605 is considered significant as it represents an overlap support, indicating that this price level has historically acted as both support and resistance. This suggests that it may serve as a strong area where price could potentially find support during a bullish move.
The 2nd support level at 0.8555 is identified as a pullback support and also coincides with the 38.20% Fibonacci Retracement level. This confluence of factors adds further significance to this support zone, implying that it may act as a notable support level during price pullbacks.
On the resistance side, the 1st resistance level at 0.8727 is recognized as an overlap resistance, indicating that this price level has historically served as both support and resistance. This makes it a potential barrier where selling pressure could emerge.
The 2nd resistance level at 0.8806 is categorized as a multi-swing high resistance, indicating that it represents a historical point where the price has encountered resistance and potential selling interest.
USD/JPY:
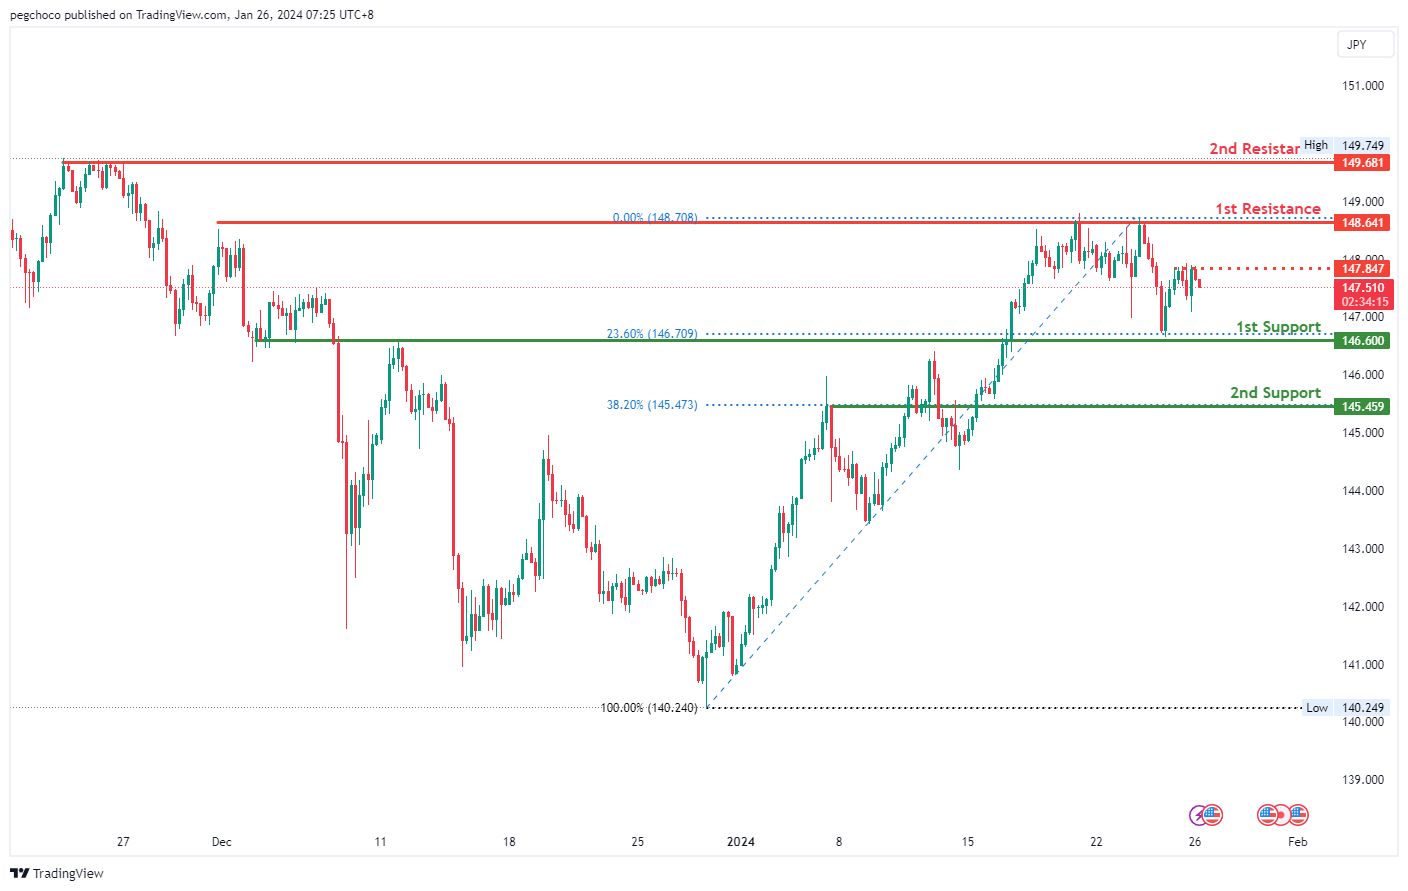
The USD/JPY trading pair currently has a bearish overall momentum, indicating weakness in the US Dollar relative to the Japanese Yen. Your analysis suggests that there is potential for a bearish continuation in the price towards the 1st support level.
The 1st support level at 146.50 is considered significant for several reasons. It represents an overlap support and coincides with the 23.60% Fibonacci Retracement level, indicating that this level corresponds to a previous significant low point on the chart, and the Fibonacci confluence adds to its importance as a potential support level during a bearish move.
The 2nd support level at 144.45 is identified as an overlap support and aligns with the 38.20% Fibonacci Retracement level, further reinforcing its significance as a support zone.
On the resistance side, the 1st resistance level at 148.64 is recognized as a multi-swing high resistance, indicating that it represents a historical point where the price has encountered resistance and potential selling interest.
The 2nd resistance level at 149.68 is categorized as a multi-swing high resistance, emphasizing its historical significance as a potential barrier for further upward price movement.
Additionally, there is an intermediate resistance level at 147.84, characterized as a multi-swing high resistance, which may act as a minor resistance area during the bearish move.
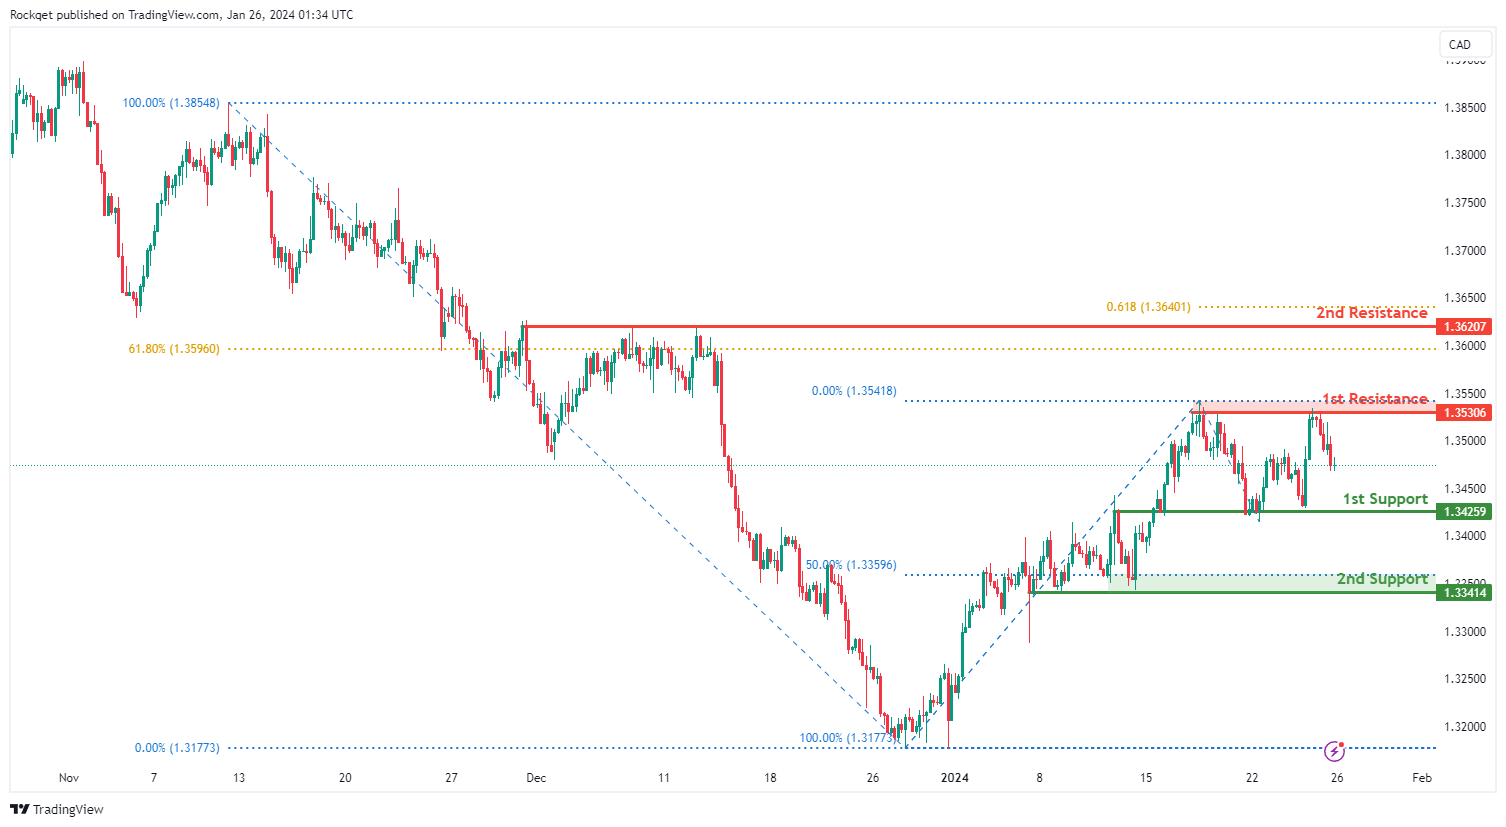
USD/CAD:
The USD/CAD chart currently exhibits a neutral bias. In this context, there is a potential scenario for price to fluctuate between the 1st support and the 1st resistance.
The 1st support level at 1.3425 is identified as an overlap support. Further below, the 2nd support level at 1.3341 is marked as a pullback support that aligns close to the 50.00% Fibonacci retracement level, further reinforcing its importance as a key support level.
To the upside, the 1st resistance level at 1.3530 is identified as a pullback resistance. Higher up, the 2nd resistance level at 1.3620 is also noted as a pullback resistance that aligns close to a confluence of Fibonacci levels i.e. the 61.80% retracement and the 61.80% projection, further reinforcing its significance as a potential resistance zone.
AUD/USD:
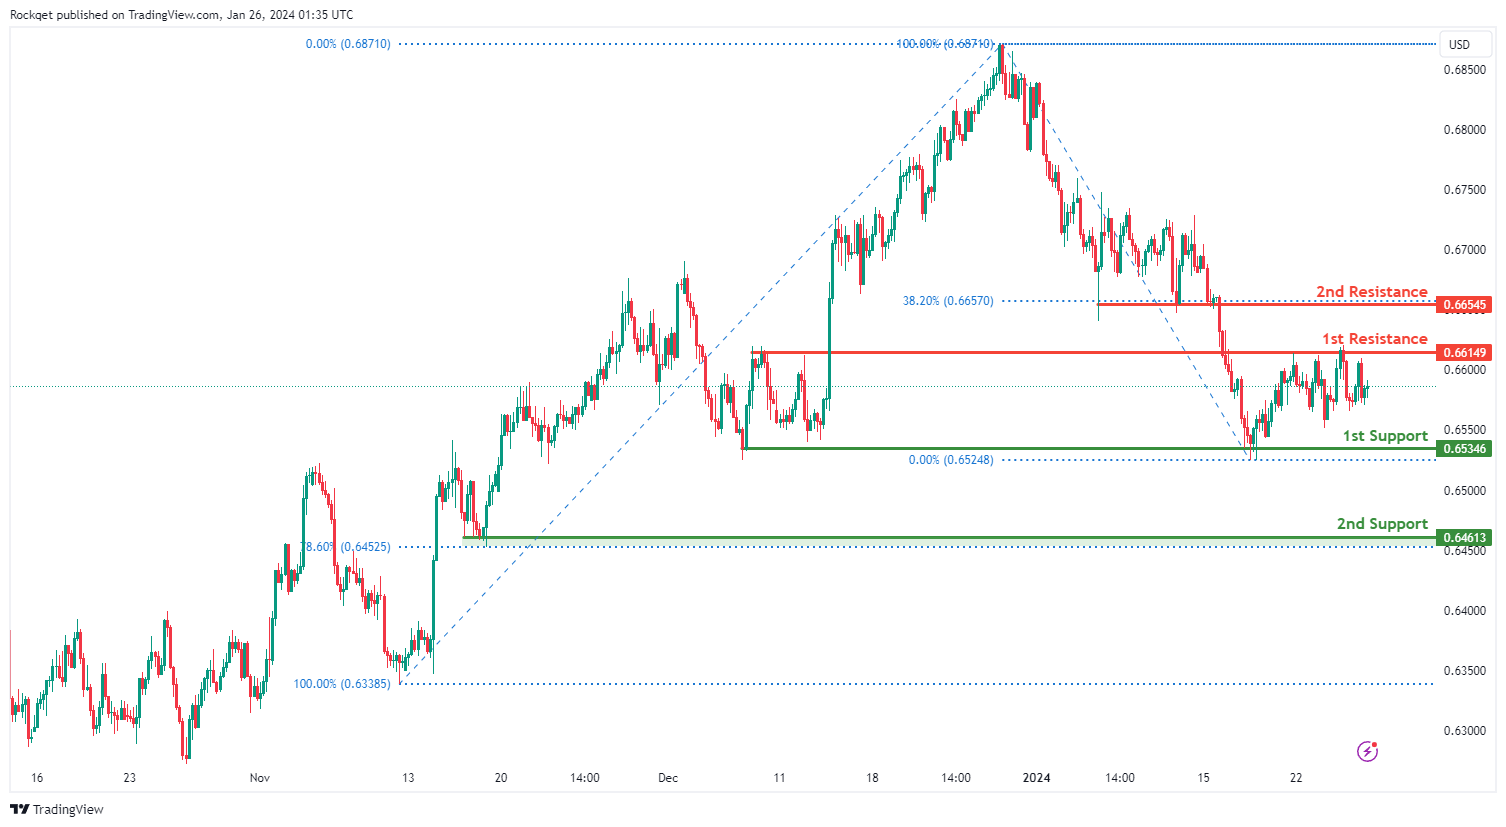
The AUD/USD chart currently exhibits a neutral bias. In this context, there is a potential scenario for price to fluctuate between the 1st support and the 1st resistance.
The 1st resistance level at 0.6614 is identified as a pullback resistance. Higher up, the 2nd resistance level at 0.6654 is also noted as a pullback resistance that aligns with the 38.20% Fibonacci retracement level, suggesting a potential barrier for further upside movement.
To the downside, the 1st support level at 0.6534 is identified as a pullback support. Further below, the 2nd support level at 0.6461 is also marked as a pullback support that aligns close to the 78.60% Fibonacci retracement level, further reinforcing its importance as a key support level.
NZD/USD
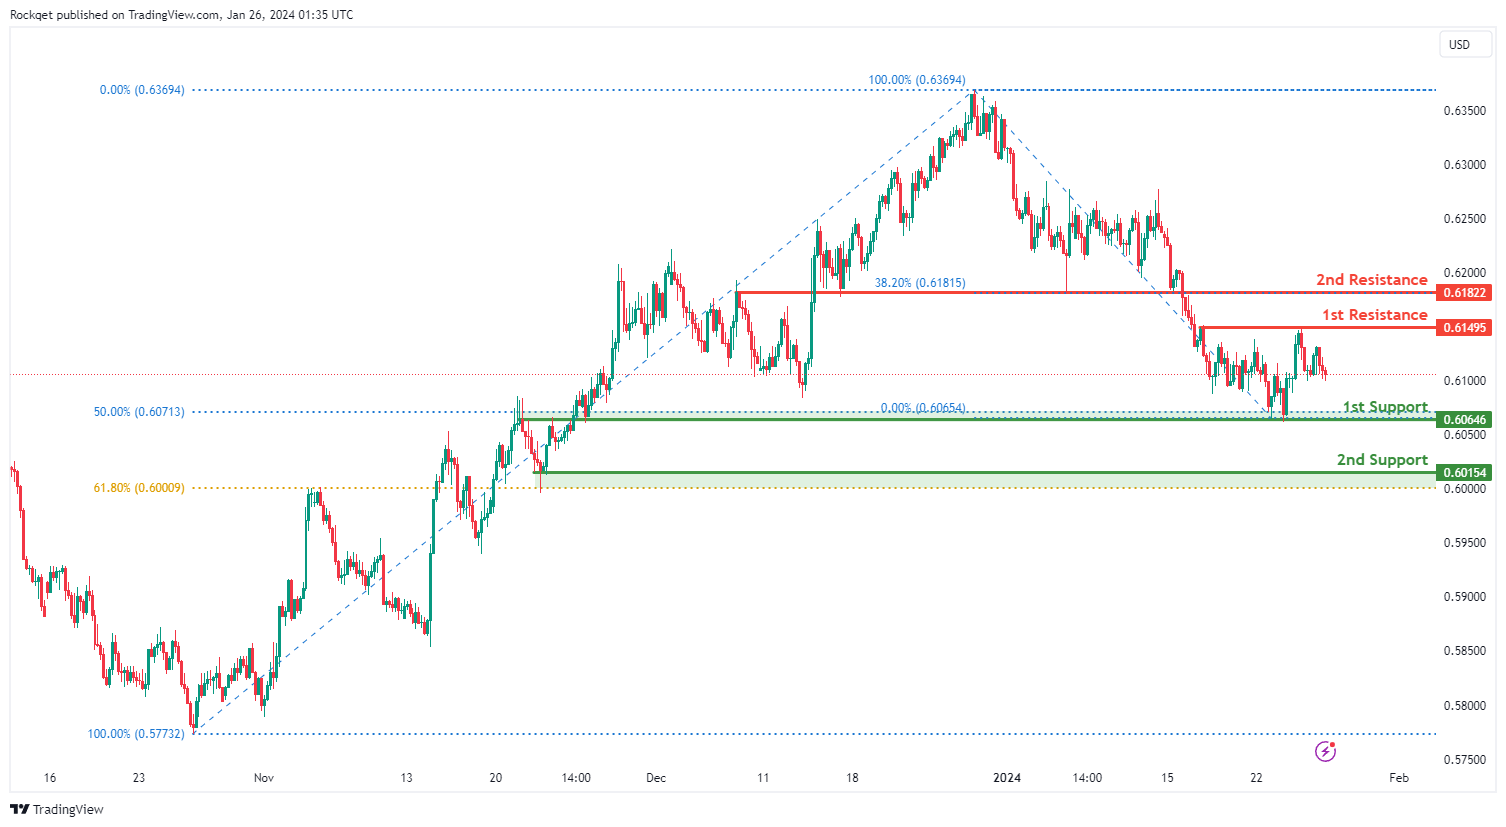
The NZD/USD chart currently exhibits a neutral bias. In this context, there is a potential scenario for price to fluctuate between the 1st support and the 1st resistance.
The 1st resistance level at 0.6149 is identified as a pullback resistance. Higher up, the 2nd resistance level at 0.6182 is noted as an overlap resistance that aligns with the 38.20% Fibonacci retracement level, suggesting a potential barrier for further upside movement.
To the downside, the 1st support level at 0.6064 is identified as an overlap support that aligns close to the 50.00% Fibonacci retracement level. Further below, the 2nd support level at 0.6015 is marked as a pullback support that aligns close to the 61.80% Fibonacci retracement level, further reinforcing its importance as a key support level.
DJ30:
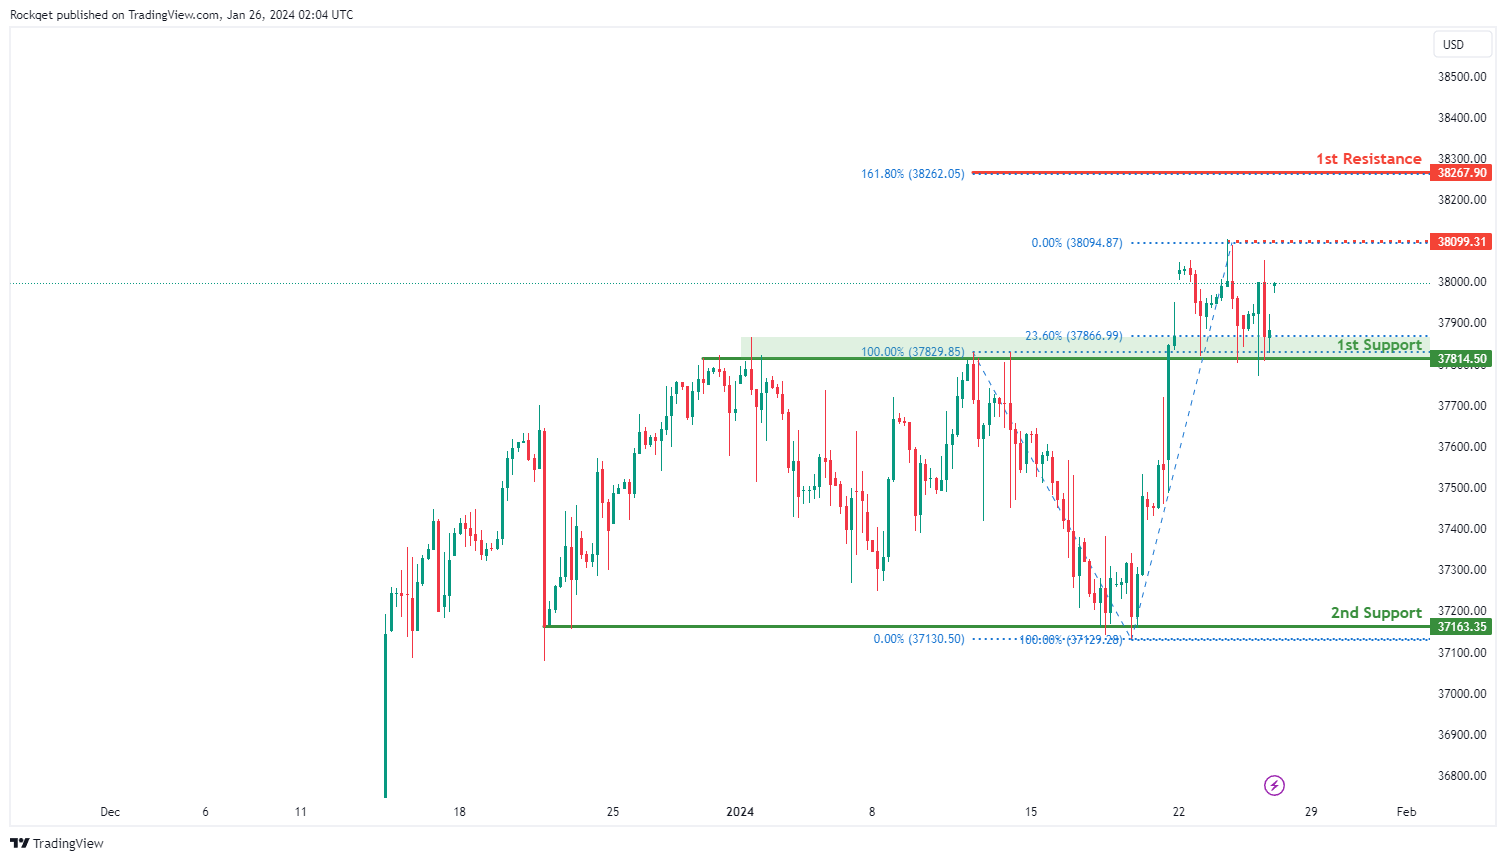
The DJ30 (Dow Jones Industrial Average) chart currently exhibits neutral overall momentum, indicating a lack of a clear trend direction. Several factors contribute to this neutral stance, suggesting potential fluctuations in the price between identified support and resistance levels.
The 1st support at 37814.50 is considered favorable for several reasons. Firstly, it is identified as an overlap support, representing a historical level where buying interest has previously emerged. Additionally, this support level coincides with the 23.60% Fibonacci Retracement, further strengthening its significance.
The 2nd support at 37163.35 is recognized as a multi-swing low support, providing additional reinforcement to the potential support zone.
On the resistance side, the intermediate resistance at 38099.31 is highlighted as a level where swing high resistance is observed. This level may pose a challenge to the bearish momentum.
Furthermore, the 1st resistance at 38267.90 is identified as the 161.80% Fibonacci Extension, adding confluence to its potential as a resistance level.
GER40:
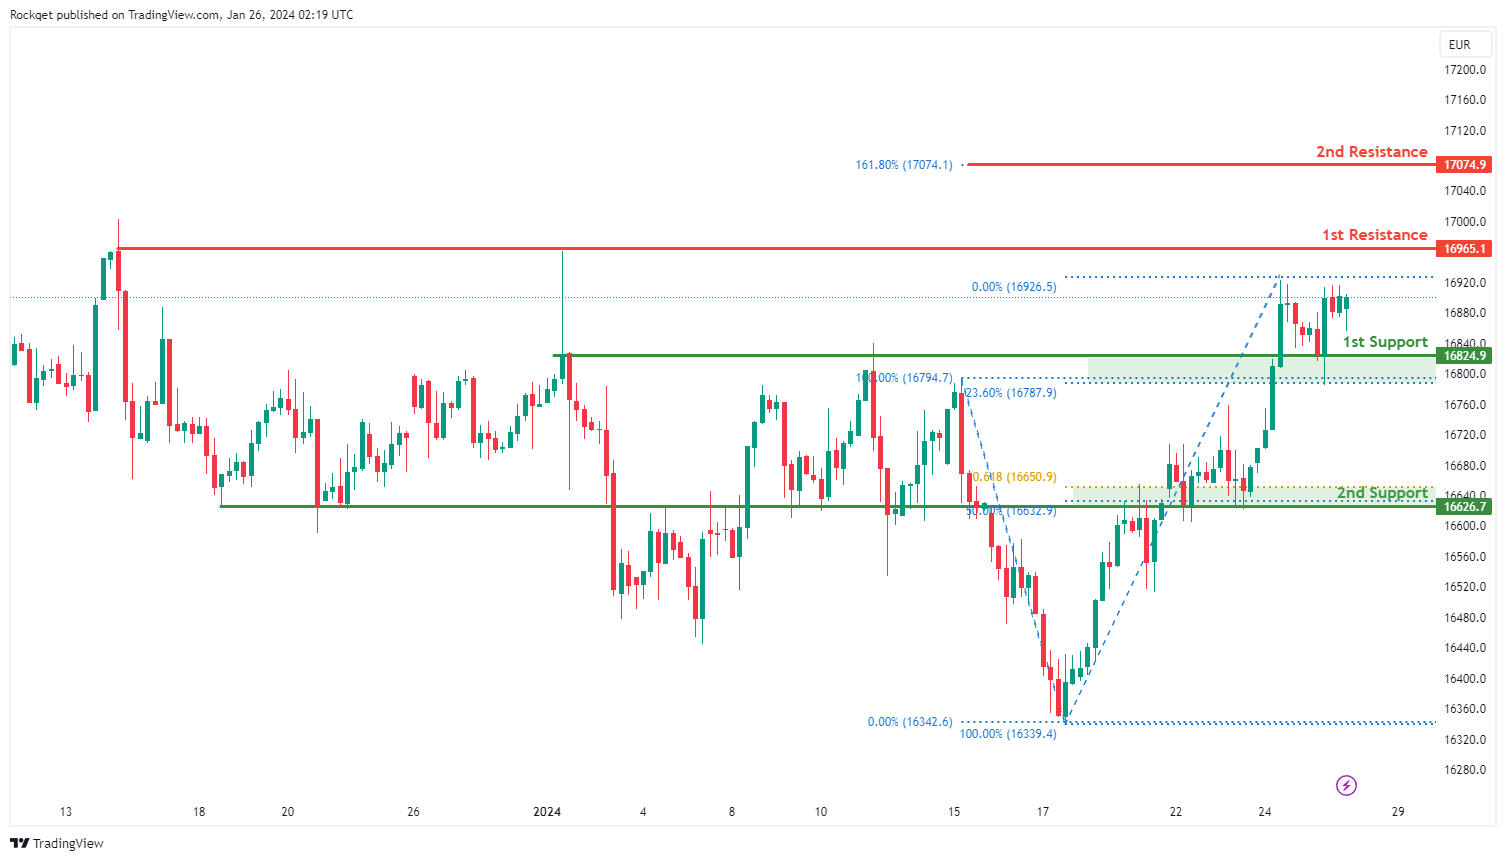
The GER40 (DAX) chart currently exhibits a a bullish overall momentum, indicating a prevailing upward trend. Several factors contribute to this bullish momentum, suggesting potential upward movement in the price.
The 1st support at 16824.9 is considered favorable for several reasons. Firstly, it is identified as a pullback support, indicating a historical level where buying interest has previously emerged. Additionally, this support level aligns with the 23.60% Fibonacci Retracement, adding confluence to its significance.
The 2nd support at 16626.7 is recognized as a multi-swing low support, providing additional strength to the potential support zone. Furthermore, it coincides with the 50% Fibonacci Retracement and the 61.80% Fibonacci Projection, further reinforcing its importance.
On the resistance side, the 1st resistance at 16965.1 is highlighted as a swing high resistance, indicating a historical level where selling interest may emerge.
Additionally, the 2nd resistance at 17074.9 is acknowledged as a level where the price might encounter resistance, given the 161.80% Fibonacci Retracement.
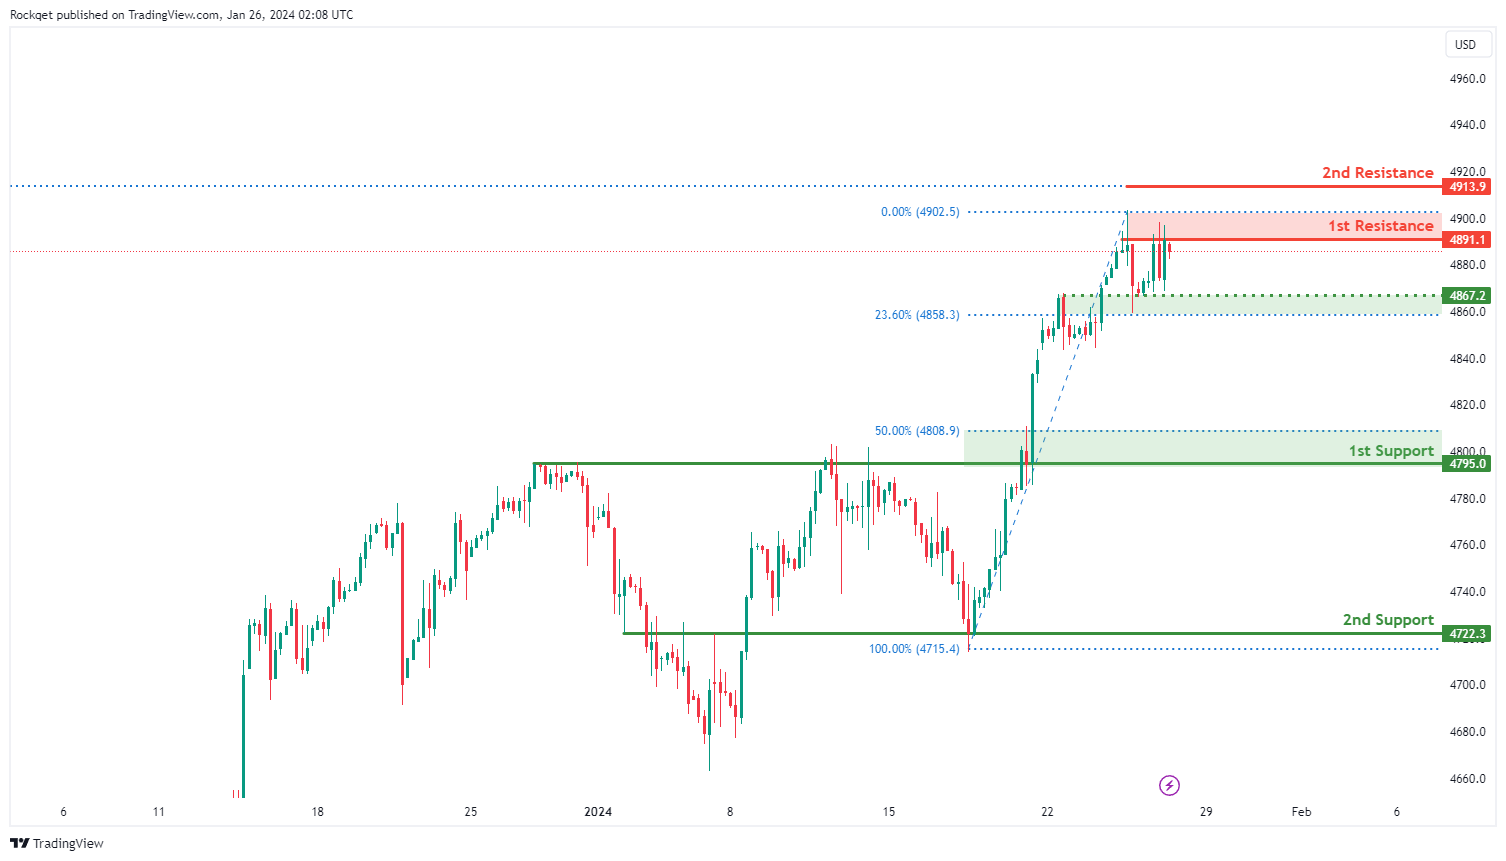
US500:
The US500 chart currently exhibits a bullish overall momentum, indicating a prevailing upward trend. Several factors contribute to this bullish momentum, suggesting potential upward movement in the price.
The 1st support at 4795.0 is considered favorable for several reasons. Firstly, it is identified as a pullback support, indicating a historical level where buying interest has previously emerged. Additionally, this support level aligns with the 50% Fibonacci Retracement, adding confluence to its significance.
The 2nd support at 4722.3 is recognized as an overlap support, providing additional strength to the potential support zone.
Intermediate support at 4867.2 is noteworthy for a couple of reasons. It is identified as an overlap support, indicating a level where buying interest has previously emerged. Furthermore, this support level aligns with the 23.60% Fibonacci Retracement, adding to its significance.
On the resistance side, the 1st resistance at 4891.1 is highlighted as a swing high resistance, indicating a historical level where selling interest may emerge.
Additionally, the 2nd resistance at 4913.9 is acknowledged as a level where the price might encounter resistance, given the 161.80% Fibonacci Extension.
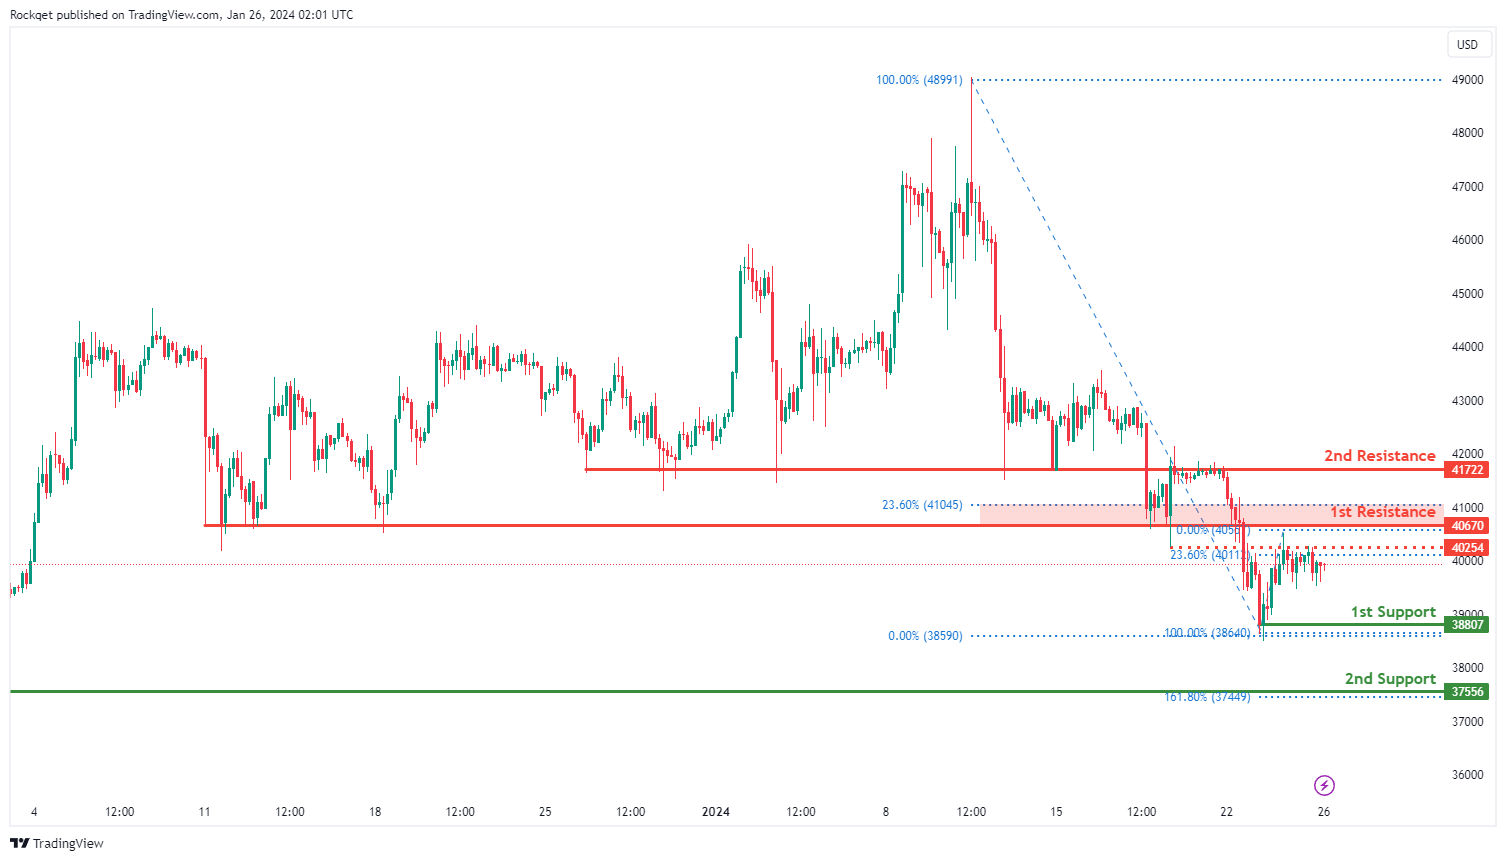
BTC/USD:
The BTC/USD chart currently shows a neutral overall momentum, suggesting a lack of a clear trend direction. The price could potentially make fluctuations between the 1st resistance and 1st support levels.
The 1st support at 38807 is considered favorable as it represents a swing low support, indicating a historical level where buying interest has previously emerged.
The 2nd support at 37556 is recognized as an overlap support and coincides with the 161.80% Fibonacci Extension, providing additional strength to the support zone.
On the resistance side, the 1st resistance at 40670 is noteworthy for being an overlap resistance and aligning with the 23.60% Fibonacci Retracement, adding significance to this potential resistance level. Additionally, the 2nd resistance at 41722 is identified as an overlap resistance.
Intermediate resistance at 40254 is also highlighted as an overlap resistance, further contributing to the potential resistance zone.
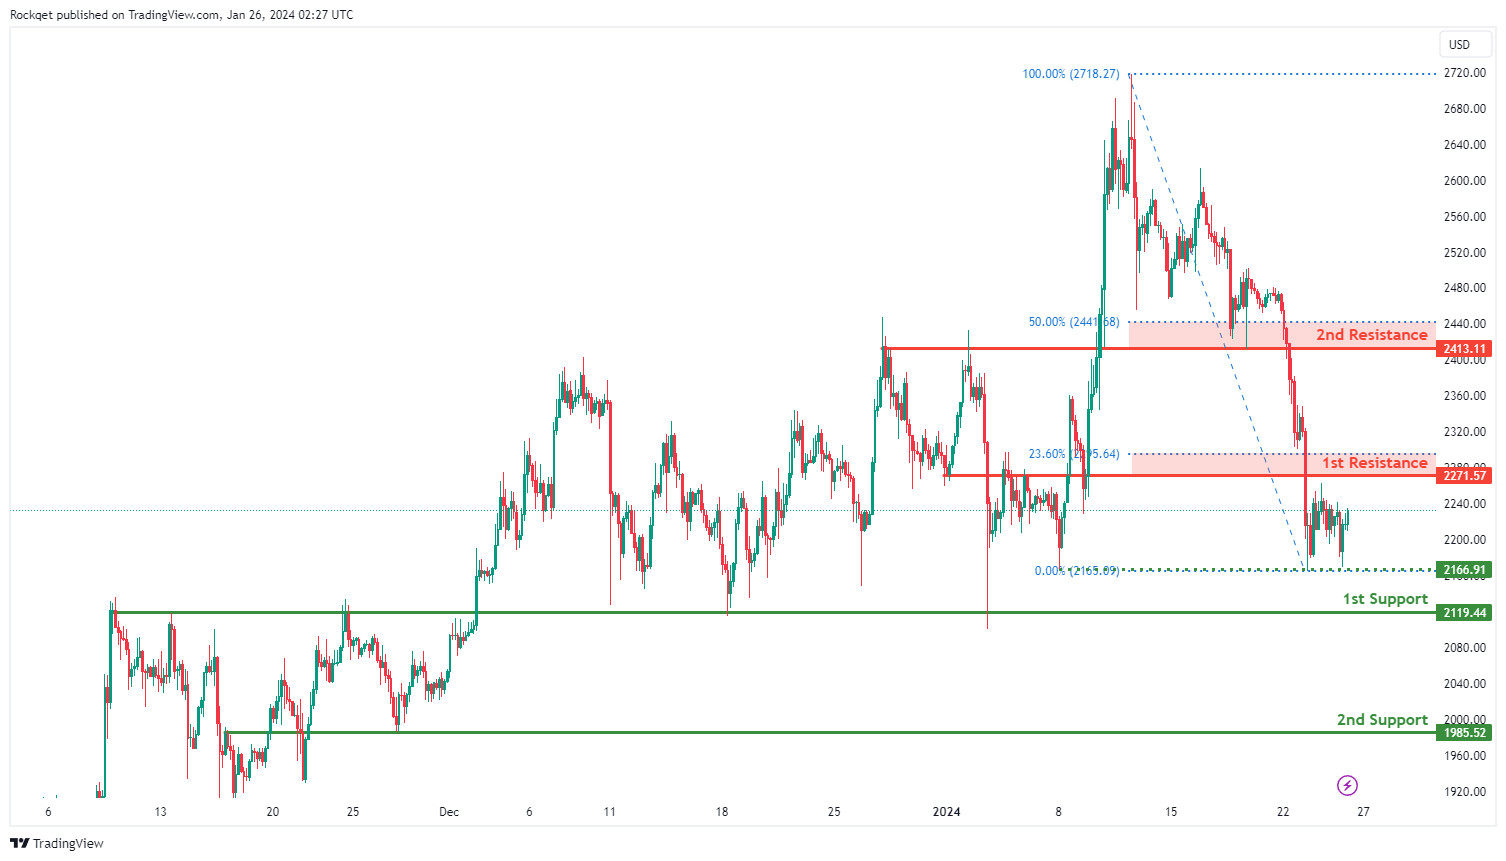
ETH/USD:
The ETH/USD chart currently exhibits a neutral overall momentum, indicating a lack of a clear trend direction. The price could potentially make fluctuations between the 1st resistance and 1st support levels.
The 1st support at 2119.44 is considered favorable as it is identified as an overlap support, signifying a historical level where buying interest has previously emerged.
Similarly, the 2nd support at 1985.52 is recognized as an overlap support, providing additional strength to the support zone.
Intermediate support at 2166.91 is highlighted as a swing low support, adding further depth to the potential support zone.
On the resistance side, the 1st resistance at 2271.57 is noteworthy for being an overlap resistance and aligning with the 23.60% Fibonacci Retracement, adding significance to this potential resistance level.
Additionally, the 2nd resistance at 2413.11 is identified as an overlap resistance and coincides with the 50% Fibonacci Retracement, contributing to the overall resistance zone.
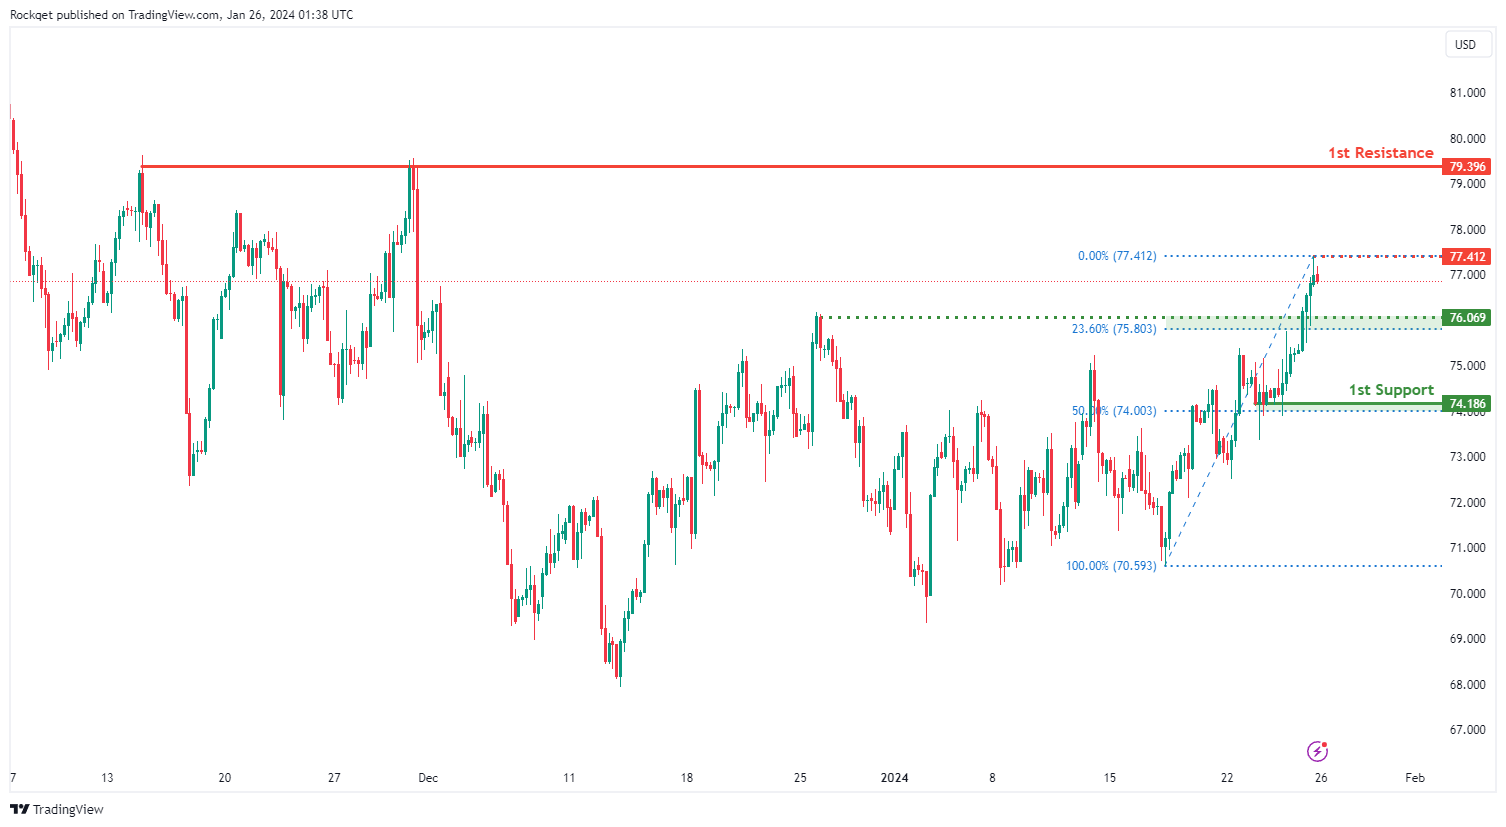
WTI/USD:
The WTI (West Texas Intermediate) chart currently exhibits an overall bullish momentum. In this context, there is a potential scenario for price to rise towards the 1st resistance should it break above the intermediate resistance..
The intermediate resistance level at 77.41 is identified as a pullback resistance. Higher up, the 1st resistance level at 79.39 is noted as a multi-swing-high resistance, suggesting a potential barrier for further upside movement.
To the downside, the intermediate support level at 76.06 is identified as a pullback support that aligns close to the 23.60% Fibonacci retracement level. Further below, the 1st support level at 74.18 is also marked as a pullback support that aligns close to the 50.00% Fibonacci retracement level, further reinforcing its importance as a key support level.
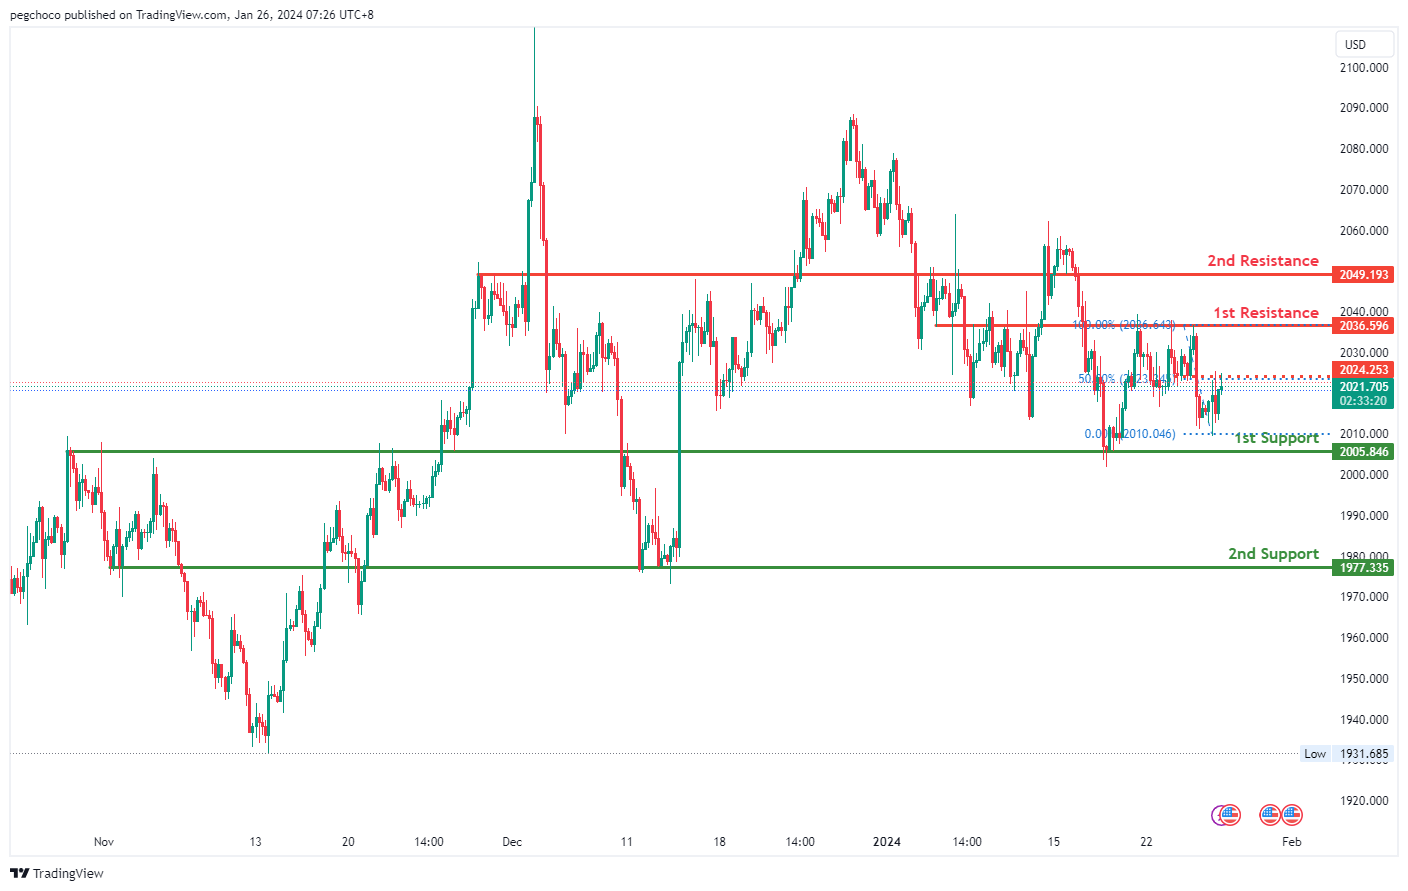
XAU/USD (GOLD):
The XAUUSD (Gold/US Dollar) chart is currently displaying a bearish overall momentum, indicating weakness in the price of gold. Your analysis suggests that there is potential for a bearish continuation in the price towards the 1st support level.
The 1st support level at 2005.84 is considered significant as it represents an overlap support, indicating that this price level has historically acted as both support and resistance. This suggests that it may serve as a strong area where price could potentially find support during a bearish move.
The 2nd support level at 1977.35 is identified as an overlap support, reinforcing its importance as a level where price has previously found both support and resistance.
On the resistance side, the 1st resistance level at 2036.59 is recognized as an overlap resistance, indicating that this price level has historically served as both support and resistance. This makes it a potential barrier where selling pressure could emerge.
The 2nd resistance level at 2049.19 is characterized as a pullback resistance, suggesting that it might act as a notable resistance point during price pullbacks.
Additionally, there is an intermediate resistance level at 2024.25, characterized as an overlap resistance, which coincides with the 50% Fibonacci Retracement level. This further supports the idea of potential resistance at this level.


