
Bullish Scenario: Consider buying above 2028.50 with TP1: 2033, TP2: 2036, and TP3: 3039 on extension. It is recommended to set a stop loss (S.L.) below 2024.5 or at least 1% of the account capital**.
Bearish Scenario: Look for sales below 2024 with TP1: 2000, TP2: 2016, and upon breakout TP3: 2013. It is advisable to place a stop loss above 2026 or at least 1% of the account capital**. A trailing stop can be used.
Fundamental Environment
Gold prices experienced a brief uptick due to escalating geopolitical tensions. Recent conflicts, such as the drone attack on US bases near Jordan, have increased demand for gold as a haven asset. Additionally, economic factors like the moderate increase in US Core Personal Consumption Expenditures (PCE) data have influenced inflation expectations, further supporting gold’s position. This week, gold market volatility could escalate with the Federal Reserve’s interest rate decision, expected to remain steady in the 5.25-5.50% range. However, investors will watch for any new guidance on interest rates, which could influence gold’s future direction. Additionally, the ISM Manufacturing PMI and Nonfarm Payrolls (NFP) report for December could also play a significant role in determining gold’s short-term trajectory.
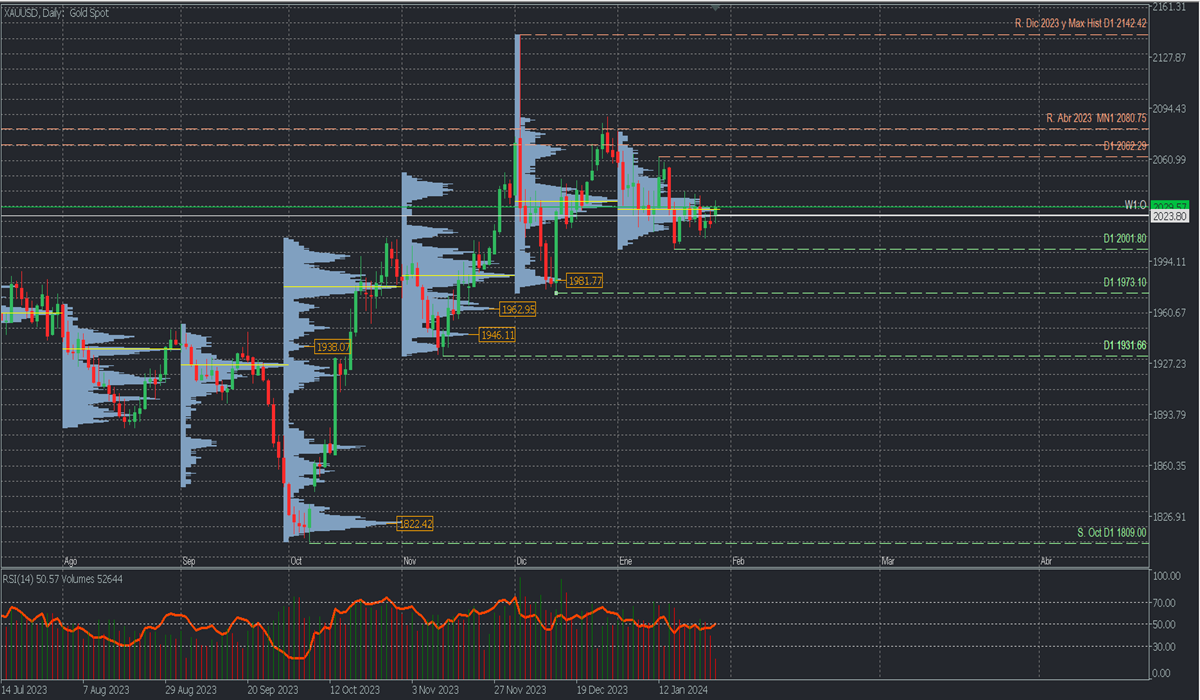
Daily Chart Analysis: Volume Profile and Structure
After a week of consolidation, a high-volume node formation around 2028 suggests a distribution process may be preparing for a new decline towards 2000 and 1980 in the short term, with a potential break below December support at 1973.10, implying a reversal of the current bullish trend. On the other hand, a decisive breakthrough of January’s volume concentration around 2028 leaves open the possibility of a recovery towards 2050 and 2060.
RSI below 50 and declining vertical volume after the last three days of ascent, suggest a bearish scenario in the short term. It’s always important to remember that any surprising event, altering geopolitics and market risk sentiment can change technical outlooks in just one day, depending on circumstances.
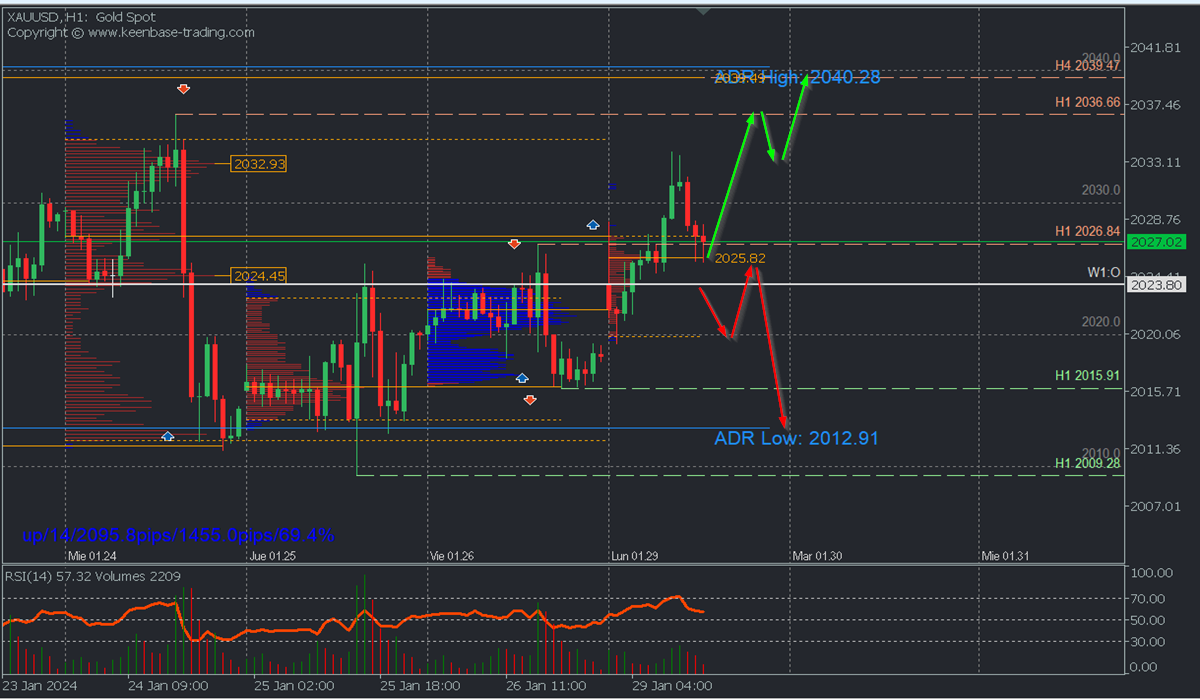
H1 Chart Scenario
The pair is still retracing upwards within the bearish expansion range from Wednesday, January 24, reacting to the high volume node around 2033 and respecting resistance at 2036.66. This rise extends after the Asian opening, leaving a point of control (POC) at 2025.82, a buy zone expected to be defended by bulls in the coming hours, with a rally towards resistances at 2036.66 and 2040 only if it manages to surpass today’s Asian/European peak at 2033.87.
On the other hand, a tepid bullish reaction and a strong breakout of the early sessions’ POC at 2025.82 will lead to a decline towards the week’s opening and the round level 2000, confirming the coverage of the opening gap and challenging the last relevant support at 2015.91, whose confirmed breakout with a second lower low will signal a bearish reversal for the yellow metal.
*Uncovered POC: POC = Point of Control: It is the level or zone where the highest volume concentration occurred. If there was previously a bearish move from it, it is considered a sell zone and forms a resistance area. On the contrary, if there was previously a bullish impulse, it is considered a buy zone, usually located at lows, thus forming support zones.
**Consider this risk management suggestion**Risk management should be based on capital and trading volume. A maximum risk of 1% of the capital is recommended. Risk management indicators like Easy Order are suggested.


 data have influenced inflation expectations, further supporting gold's position. This week, gold market volatility could escalate with the Federal Reserve's interest rate decision, expected to remain steady in the 5.25-5.50% range. However, investors will watch for any new guidance on interest rates, which could influence gold's future direction. Additionally, the ISM Manufacturing PMI and Nonfarm Payrolls (NFP) report for December could also play a significant role in determining gold's short-term trajectory.)