
Bullish Scenario: Buying above 160.00 (expecting a pullback to this zone) with TP1: 160.62 (uncovered POC*), TP2: 160.81, and TP3: 161.00 on an intraday basis. It is recommended to set a stop loss (S.L.) below 159.82 or at least 1% of the account capital**.
Bearish Scenario: Selling below 160.25 with TP1: 160.00, TP2: 159.82, and upon its breakout TP3: 159.63. It is recommended to place a stop loss above 160.42, at least 1% of the account capital**. A trailing stop can be used.
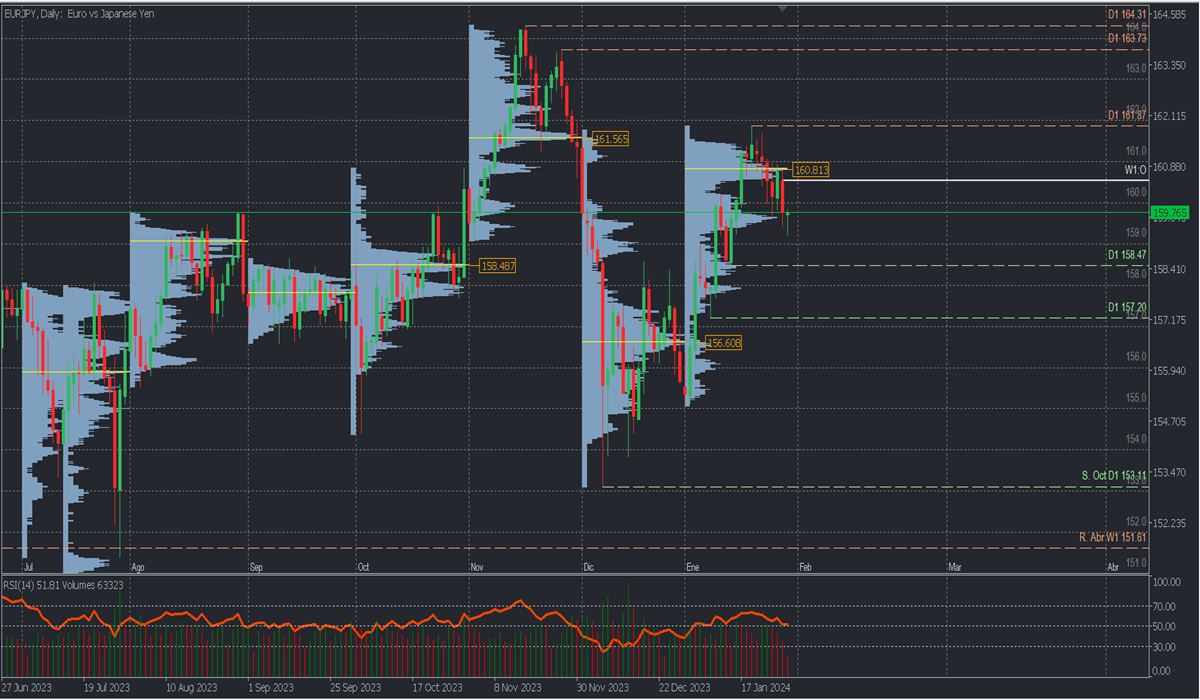
Analysis from a daily chart. Volume Profile and Structure.
EURJPY is one of the pairs that best reflects market risk sentiment, and we have seen the recovery throughout January, rising from the December buying zone between 155.00 and 156.60 to the November selling zone around 161.56.
Now, we observe that January is leaving an uncovered POC* at 160.81, which triggered the current downward movement to the next high-volume node at approximately 159.70. Thus, it can be expected that the next bullish retracement will return to the monthly POC, with two possible outcomes:
- The most likely scenario is a bullish breakout above 161, considering it would be the second time, following the rebound on Friday, January 26, indicating the possibility of prices renewing purchases, aiming to break January’s resistance at 161.87 and continue bullish towards 163.00. This scenario seems more likely as the RSI stays positive, and bounces from 50, indicating a possible rebound, and the vertical volume has decreased during the last descent.
- The second scenario will be activated after a new price rebound from January’s POC at 160.81 with a more extended correction to challenge the last significant support at 158.47, whose confirmed breakout will reverse the month’s bullish trend. The bullish trend will remain active as long as this support is not broken.
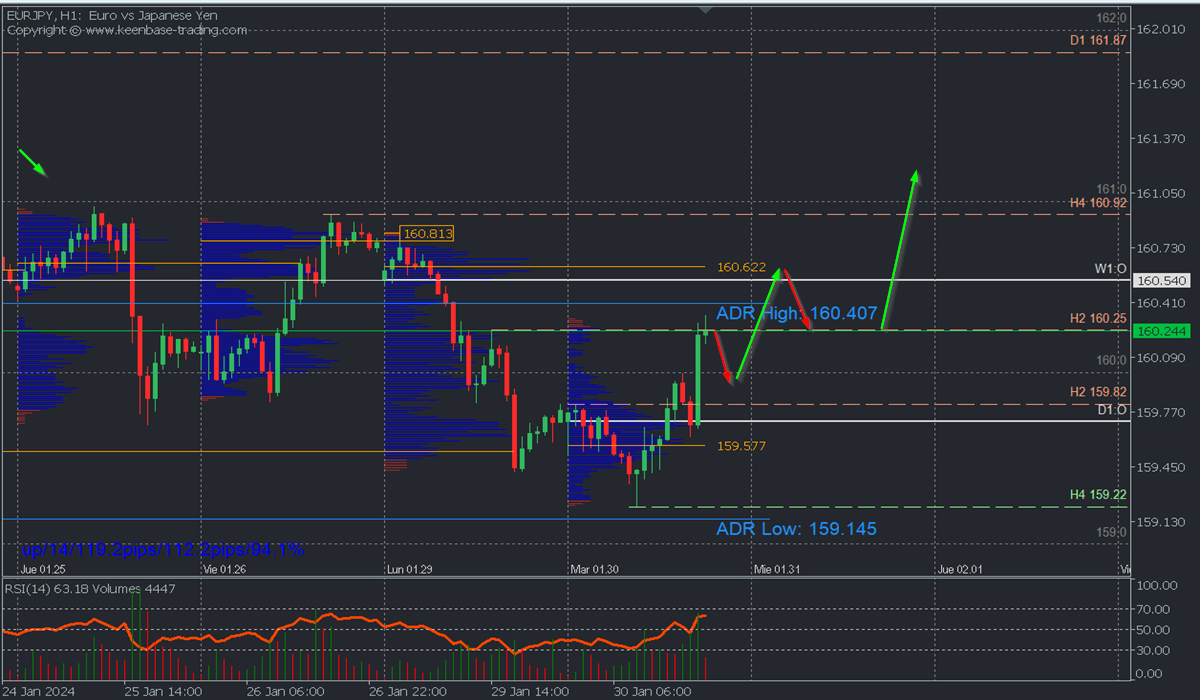
Scenario from an H1 chart:
Prices show a bullish reversal pattern for the day, leaving support at 159.22 and a confirmed breakout with a second bullish movement from resistance at 159.82. Intraday buying targets of this reversal have been reached. Still, further bullish continuation can be expected in the coming days after the retracement towards 160.00 and 159.82, with a new surge towards the next selling zone at the uncovered POC* 160.62. Its breakout on a second touch brings us closer to January’s macro POC at the macro selling zone of January, with the possibility of being broken and extending the advance above 161.00, confirming the bullish scenario proposed in the daily chart.
This bullish perspective will remain valid as long as the retracement does not break the buying zone that originated the intraday bullish reversal around 159.57, very close to the last significant support at 159.63. In that case, selling will be resumed.
*Uncovered POC: POC = Point of Control: It is the level or zone where the highest volume concentration occurred. If there was a downward movement from it previously, it is considered a selling zone and forms a resistance zone. Conversely, if there was a bullish impulse previously, it is considered a buying zone, usually located at lows, forming support zones.
**Consider this risk management suggestion
**It is very important that risk management is based on capital and traded volume. Therefore, a maximum risk of 1% of the capital is recommended. It is suggested to use risk management indicators like the Easy Order.


