
A note on lower timeframe confirming price action…
Waiting for lower timeframe confirmation is our main tool to confirm strength within higher timeframe zones, and has really been the key to our trading success. It takes a little time to understand the subtle nuances, however, as each trade is never the same, but once you master the rhythm so to speak, you will be saved from countless unnecessary losing trades. The following is a list of what we look for:
- A break/retest of supply or demand dependent on which way you’re trading.
- A trendline break/retest.
- Buying/selling tails … essentially we look for a cluster of very obvious spikes off of lower timeframe support and resistance levels within the higher timeframe zone.
- Candlestick patterns. We tend to only stick with pin bars and engulfing bars as these have proven to be the most effective.
EUR/USD
Weekly gain/loss: + 68 pips
Weekly closing price: 1.0730
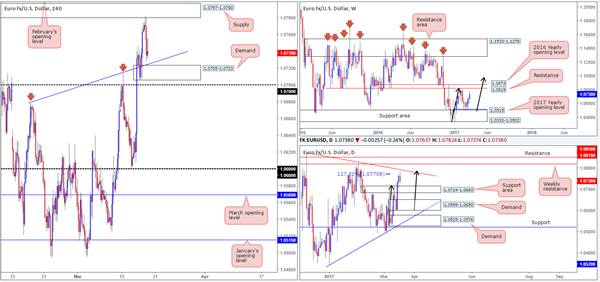
The EUR/USD enjoyed another relatively successful week, increasing its value by a further 70 pips and printing its third consecutive weekly bullish candle into the close. Despite this, there could be trouble ahead. Plotted in our field of vision right now is a nearby weekly resistance level pegged at 1.0819, shadowed closely by the 2016 yearly opening base line drawn from 1.0873. What’s also notable from a technical perspective is the potential weekly AB=CD bearish pattern (see black arrows) that terminates above the aforementioned weekly resistances at 1.0980.
Turning our attention to the daily candles, nevertheless, we can see that price came into contact with a bearish daily AB=CD (black arrows) 127.2% Fib ext. at 1.0770 on Friday. Leaving the daily trend resistance extended from the high 1.0873 unchallenged, price sold off and erased the majority of Thursday’s gains. As you can probably see though, there’s not much room left for the bears to stretch their legs here owing to the daily support area positioned just below at 1.0714-1.0683.
A quick recap of Friday’s sessions on the H4 chart shows that price hit the brakes and reversed from the H4 supply zone marked at 1.0797-1.0780. The US prelim UoM consumer sentiment survey, a notable market-moving event, was largely ignored. This, as far as we can see, helped the major close the week forming two back-to-back H4 selling wicks just ahead of a H4 demand area at 1.0705-1.0723. Also of particular interest here is the H4 demand is actually located around the top edge of the aforementioned daily support area, which also sits a few pips above the 1.07 handle and happens to merge nicely with a H4 trendline support taken form the high 1.0679.
Our suggestions: Based on the above points, our prime focus today will be on the current H4 demand area. Due to its surrounding confluence, additional support coming in from the daily picture and room seen to advance north on the weekly chart, there’s a healthy chance of a bounce being seen from the H4 base.
Whether or not this zone requires additional price confirmation before entry is obviously down to the individual trader. For us personally, we have decided to wait for a reasonably sized H4 bullish rotation candle to take shape before a long trade is executed for the simple reason that we do not favor getting stopped out on a fakeout down to 1.07!
Data points to consider: German Buba President Weidmann speaks at 4.45pm. FOMC member Evans speaks at 5.10pm and President Trump takes the stage at 11.30pm GMT.
Levels to watch/live orders:
- Buys: 1.0705-1.0723 ([waiting for a reasonably sized H4 bull candle to form is advised before pulling the trigger] stop loss: ideally beyond the confirming candle).
- Sells: Flat (stop loss: N/A).
GBP/USD:
Weekly gain/loss: + 227 pips
Weekly closing price: 1.2390
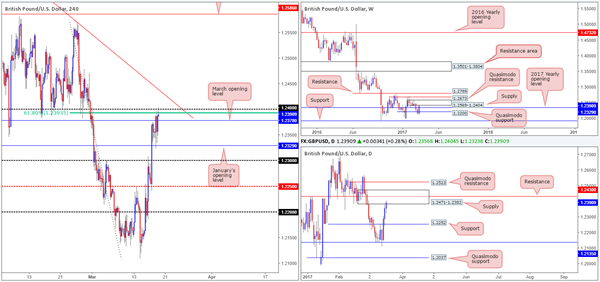
Following a two-week slide, renewed buying interest came in from a low of 1.2109 last week. Not only did this momentum form a sizeable weekly bullish engulfing candle, it also lifted the pair above the 2017 yearly opening level at 1.2390. While this is considered bullish, it might be worth noting that weekly price also clipped the underside of a weekly supply area at 1.2569-1.2404.
In conjunction with the weekly timeframe, daily action shows that price shook hands with a daily supply zone at 1.2471-1.2382 going into the week’s end. Considering that this barrier holds a daily resistance line penciled in at 1.2430 and is planted within the boundaries of the above said weekly supply, the bulls may find it a challenge to break through here this week.
Swinging across to the H4 timeframe, we can see that cable settled for the week around the 1.24 handle which boasts additional resistance from the H4 61.8% Fib resistance at 1.2393 taken from the high 1.2569. Also noteworthy here is the closing candle: a H4 bearish selling wick. This – coupled with the aforementioned higher-timeframe structures currently in play could be enough to send the unit lower today/this week.
Our suggestions: While our team is firmly bearish this market right now, selling into March’s opening level at 1.2378 is not something we’d feel comfortable with. Should a H4 bearish close print beyond this monthly level, we would then be relatively content on shorting any retest seen to the underside of the 1.24/1.2378 region, targeting January’s opening line at 1.2390, followed closely by the 1.23 handle.
Data points to consider: FOMC member Evans speaks at 5.10pm and President Trump takes the stage at 11.30pm GMT.
Levels to watch/live orders:
- Buys: Flat (stop loss: N/A).
- Sells: Watch for price to engulf 1.2378 and then look to trade any retest seen thereafter (stop loss: ideally beyond 1.24).
AUD/USD
Weekly gain/loss: + 168 pips
Weekly closing price: 0.7702
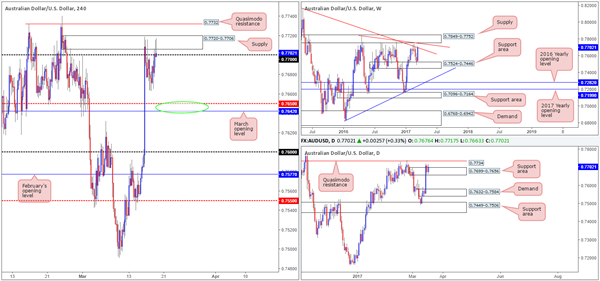
Recent trading on the weekly chart shows that price aggressively extended the prior week’s (minor) bounce from the weekly support area seen at 0.7524-0.7446. Consequent to this, the weekly candle reconnected with a weekly trendline resistance stretched from the high 0.8163 and closed the week in strong fashion. In the event that this weekly line is violated, the next upside area to have an eyeball on this week can be seen at 0.7849-0.7752: a weekly supply zone that fuses nicely with another, albeit smaller, weekly trendline resistance taken from the high 0.7835.
Over on the daily chart, the daily supply zone at 0.7699-0.7656 was consumed during Wednesday’s advance and is, as you can see, now being used as a support area. Should the bulls continue to defend this neighborhood; traders’ crosshairs will likely be fixed on the daily Quasimodo resistance coming in at 0.7734.
During the course of Friday’s segment on the H4 chart, the commodity-linked currency retested the H4 supply zone visible at 0.7720-0.7706. Although the H4 supply remained defensive, the H4 candles managed to hold above the 0.77 handle into the week’s end. While there’s still a possibility of a bounce being seen from the nearby 0.7642/0.7650 area (green circle – March opening line and H4 mid-way support), we have a keen interest in the H4 Quasimodo resistance seen beyond the current H4 supply at 0.7732.
Our suggestions: 0.7732 converges closely with a daily Quasimodo resistance line at 0.7734, and is also positioned nearby the weekly supply at 0.7849-0.7752 mentioned above. As highlighted in Friday’s report, we would, dependent on the time of day, likely look to enter aggressively here at 0.7732 and place stops above the H4 (Quasimodo apex) high at 0.7740 (0.7742).
Data points to consider: FOMC member Evans speaks at 5.10pm and President Trump takes the stage at 11.30pm GMT.
Levels to watch/live orders:
- Buys: Flat (stop loss: N/A).
- Sells: 0.7732 (Stop loss: 0.7742).
USD/JPY
Weekly gain/loss: – 209 pips
Weekly closing price: 112.68
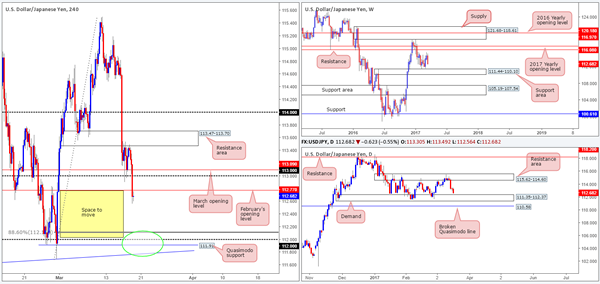
A healthy bout of selling was seen in the market last week, erasing the prior week’s gains and breaking a two-week bullish phase. Providing that the bears can continue to stamp in their authority here, we see no reason why the weekly support area at 111.44-110.10 will not come into play.
Since mid-January, the daily candles have been consolidating between a daily resistance area coming in at 115.62-114.60 and a daily demand formed at 111.35-112.37 (positioned around the upper edge of the aforementioned weekly support area). A sustained move beyond the top edge of this range could lead to a rally north up to the daily resistance registered at 118.20. Conversely, a push below the lower edge of the daily consolidation may force the unit to challenge the nearby daily broken Quasimodo line at 110.58.
In the early hours of Friday’s London morning segment, the US dollar resumed its decline against the Japanese yen. After chomping through March’s opening base at 113.09, the 113.00 handle and eventually February’s opening line at 112.77, the pair concluded trade forming a H4 indecision candle at 112.68. Despite space being seen for the H4 candles to continue selling off down to around the 112.00 vicinity, we have to remain cognizant of the current daily demand pictured at 111.35-112.37.
Our suggestions: With the top edge of the daily demand coming in at 112.37, shorting from the underside of Feb’s opening line at 112.77 is not impossible, but difficult in regards to space. One has 40 pips of room to play with here. As such, we feel the better route to take today/this week is instead of looking to grab 30 or so pips from a short here, look to wait and see if the H4 candles can test 112 (green circle) for longs. There are a number of technical aspects that support a buy from this angle:
The H4 88.6 retracement value seen at 112.11.
The H4 Quasimodo support at 111.91.
A H4 trendline support taken from the low 111.59.
All of the above is positioned within the current daily demand, which, as we also mentioned above, is located around the top edge of a weekly support area.
Given the above points, a long from 112 is far more appealing to us. Seeing as how the H4 buy zone (111.75/112.11) is rather large, nevertheless, a reasonably sized H4 bullish candle is required to be seen before we pull the trigger.
Data points to consider: FOMC member Evans speaks at 5.10pm and President Trump takes the stage at 11.30pm GMT.
Levels to watch/live orders:
- Buys: 111.75/112.11 ([waiting for a reasonably sized H4 bull candle to form is advised before pulling the trigger] stop loss: ideally beyond the confirming candle).
- Sells: Flat (stop loss: N/A).


