
DXY:
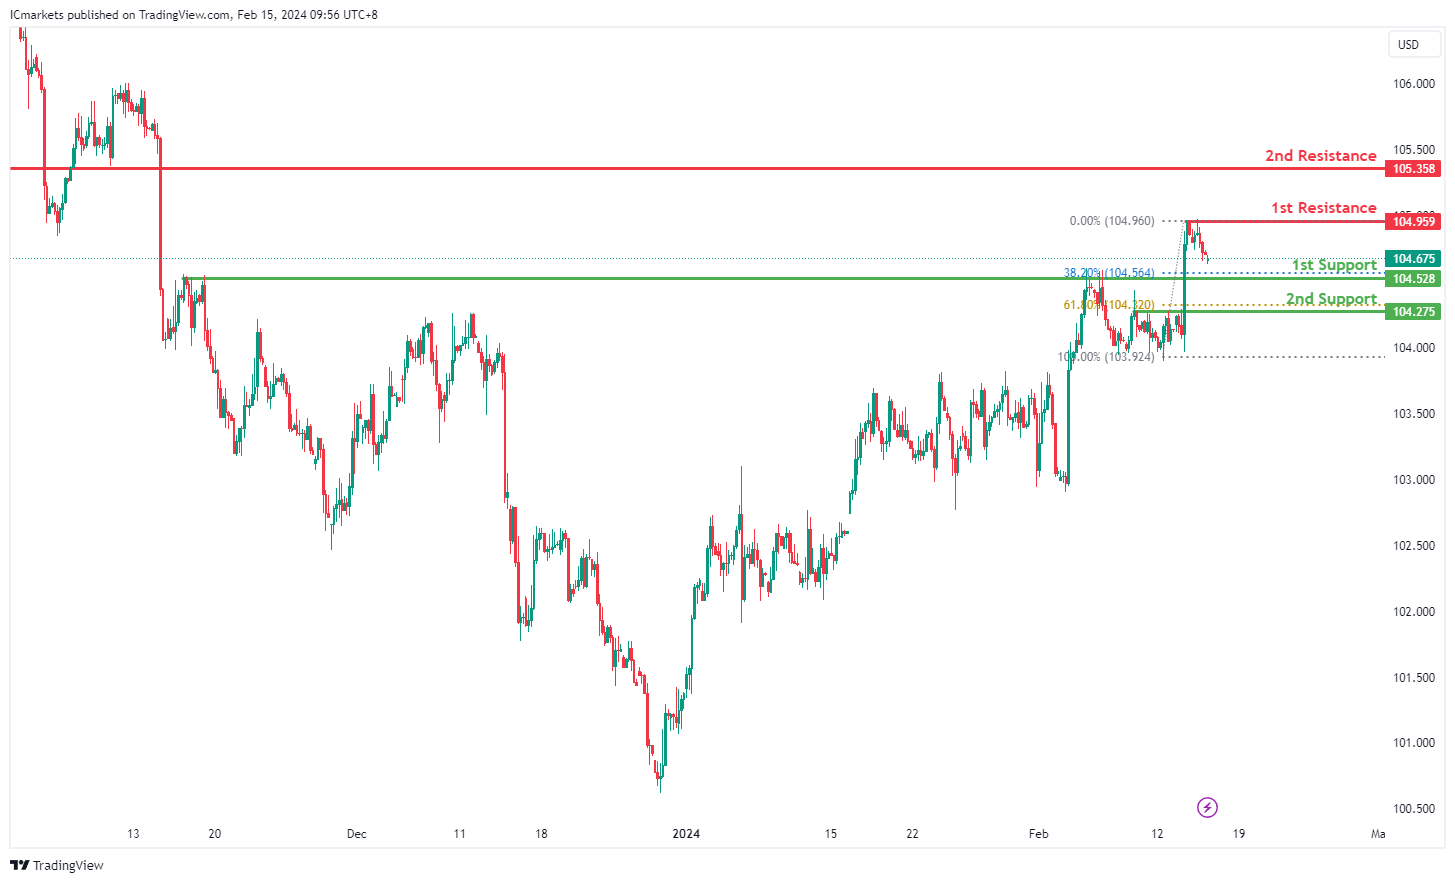
The DXY chart currently indicates a bearish momentum, suggesting a potential continuation of the downward trend.
The 1st support level is situated at 104.52, identified as a pullback support. This level corresponds to the 38.20% Fibonacci Retracement, adding to its significance as a potential area where buying interest could emerge.
Additionally, the 2nd support at 104.27 is noted as another pullback support, coinciding with the 61.80% Fibonacci Retracement, further reinforcing its potential as a support zone.
On the resistance side, the 1st resistance level is positioned at 104.95, characterized as a multi-swing high resistance. This level may act as a barrier to upward movement, potentially triggering a reversal or a temporary halt in the downtrend.
Similarly, the 2nd resistance at 105.38 is identified as a pullback resistance, indicating another potential area where selling pressure may intensify.
EUR/USD:
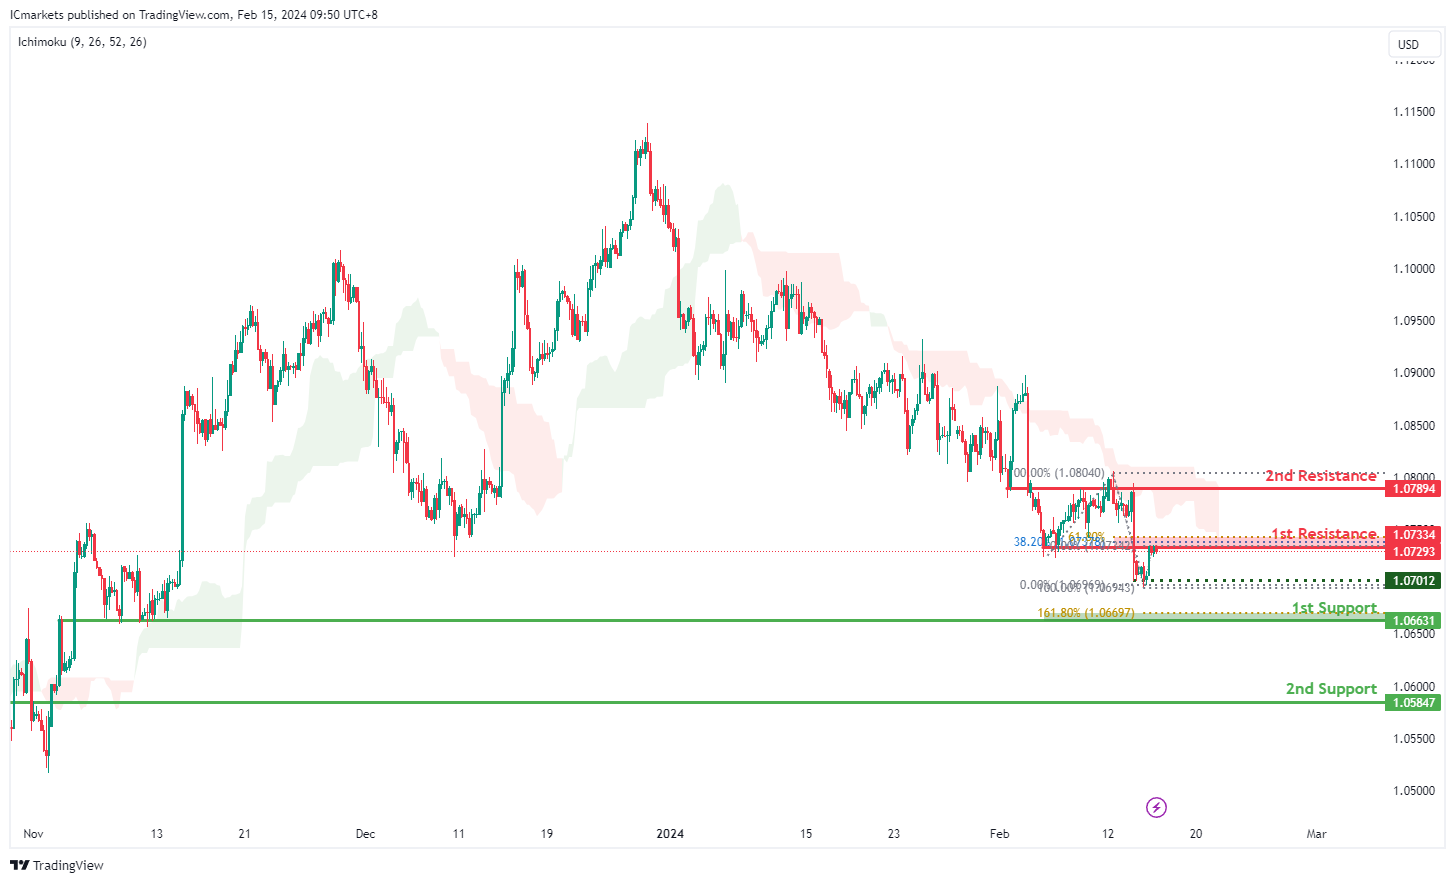
The EUR/USD chart currently exhibits a bearish momentum, with one of the contributing factors being that the price is below the bearish Ichimoku cloud.
Given this scenario, the price could potentially continue its bearish movement towards the 1st support level at 1.0663. This level is identified as an overlap support and coincides with the 161.80% Fibonacci Extension, enhancing its significance as a potential area of buying interest.
In addition, the 2nd support at 1.0584 is noted as a pullback support, suggesting another level where buyers might step in to support the price.
On the resistance side, the 1st resistance level at 1.0733 is characterized as an overlap resistance. This level is reinforced by the presence of the 61.80% Fibonacci Projection and the 38.20% Fibonacci Retracement, indicating Fibonacci confluence and suggesting a potential area of selling interest.
Furthermore, the 2nd resistance at 1.0789 is identified as another overlap resistance, adding to its significance as a potential barrier for further upside movement.
EUR/JPY:
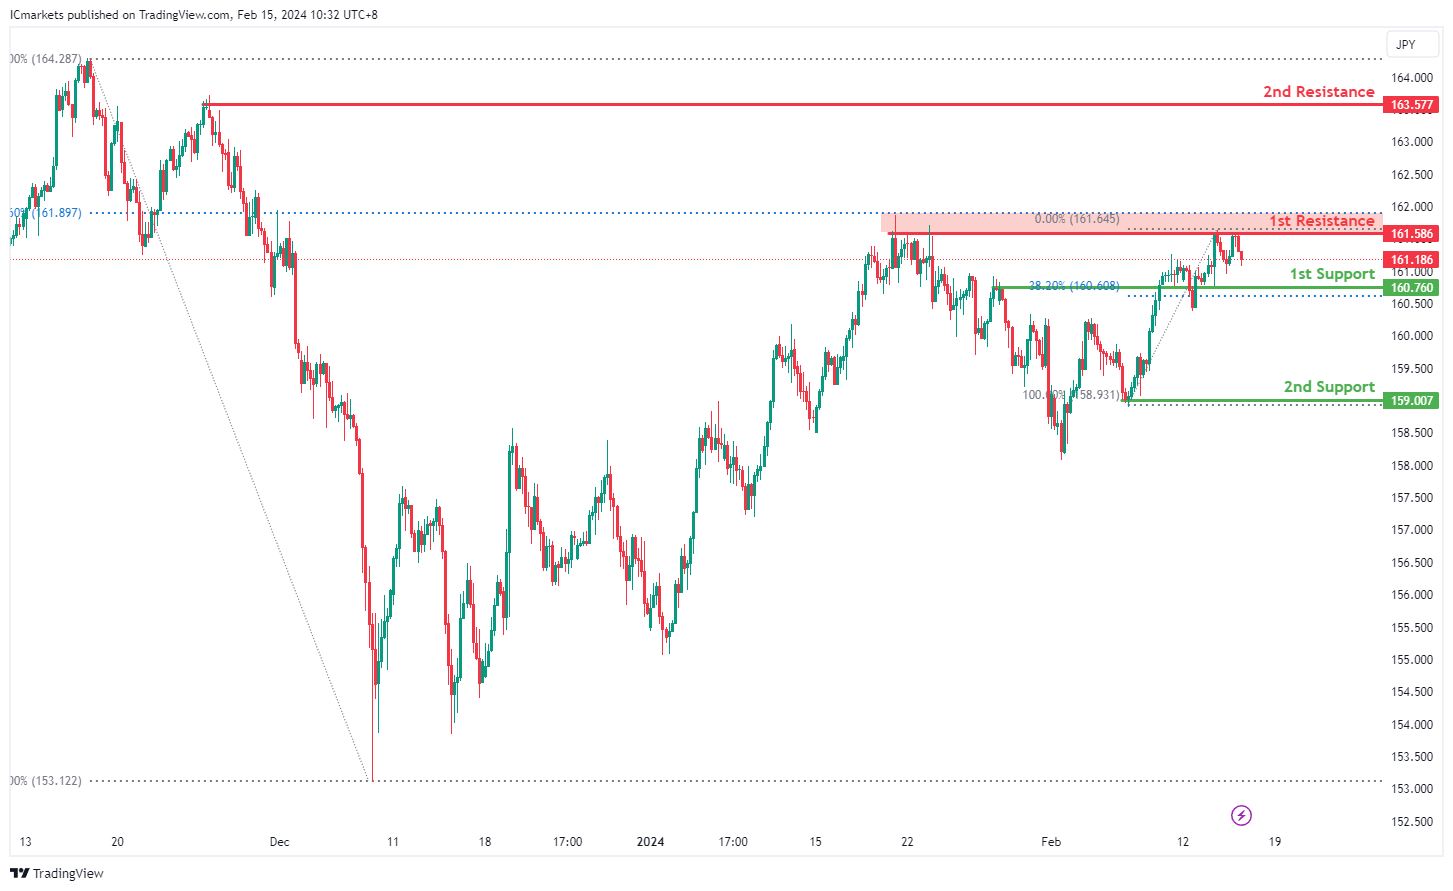
The EUR/JPY chart currently demonstrates a bearish overall momentum, indicating a prevalent downward trend. Several factors contribute to this bearish sentiment, reinforcing the potential for a continued decline in price.
The 1st support level at 160.760 is significant as it aligns with both a pullback support and the 38.20% Fibonacci Retracement level. This convergence of support factors suggests a strong level where buying interest has historically emerged, potentially acting as a temporary floor for the price.
Additionally, the 2nd support level at 150.007 corresponds to a swing low support, further emphasizing its importance as a potential area where buyers may intervene to support the price.
On the resistance side, the 1st resistance level at 161.586 is identified as a swing high resistance and coincides with the 78.60% Fibonacci Retracement level. This level indicates a historical point where selling pressure has been significant, potentially acting as a barrier to further upward movement.
Further up, the 2nd resistance level at 163.705 also aligns with a swing high resistance, reinforcing its significance as a potential barrier to price appreciation.
EUR/GBP:
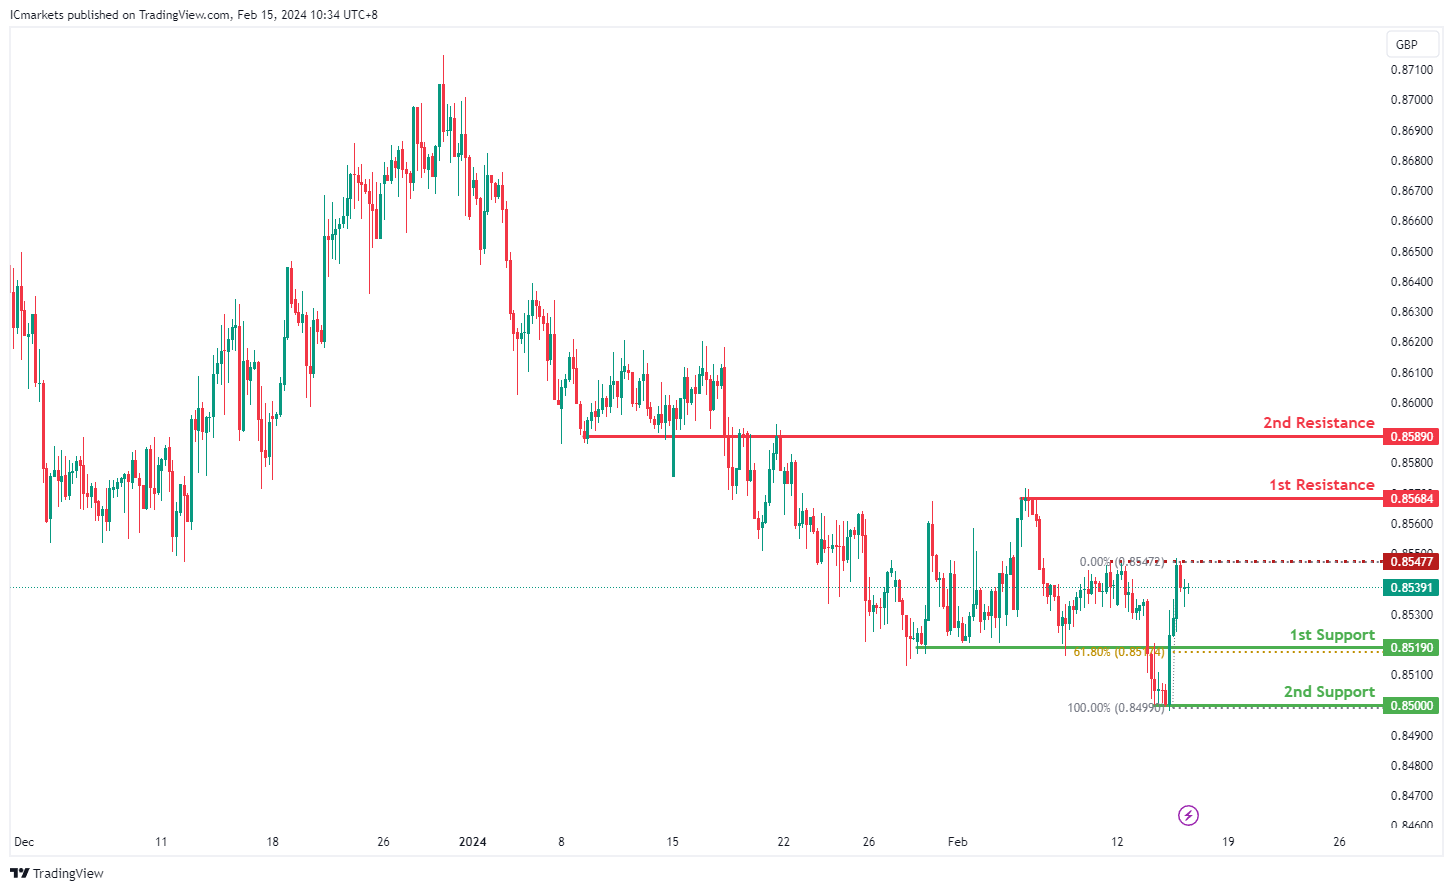
The EUR/GBP chart currently maintains a neutral overall momentum, indicating a lack of clear directionality in the market. This indecisiveness suggests that price could potentially oscillate between key support and resistance levels in the near term.
The 1st support level at 0.85190 is notable as it coincides with a pullback support and the 61.80% Fibonacci Retracement level. This convergence suggests a robust level where buying interest may emerge, potentially providing a foundation for price stability.
Furthermore, the 2nd support level at 0.85000 aligns with a swing low support, reinforcing its significance as a historical level where buyers have previously intervened to support the price.
On the flip side, the 1st resistance level at 0.85684 represents a swing high resistance, indicating a historical point where selling pressure has been prevalent. This level may act as a barrier to further upward movement.
Similarly, the 2nd resistance level at 0.85890 is identified as an overlap resistance, suggesting another level where selling interest may intensify.
An intermediate resistance level at 0.85477 is also identified, corresponding to a pullback resistance. This level may add to the complexity of price movements, potentially influencing short-term fluctuations.
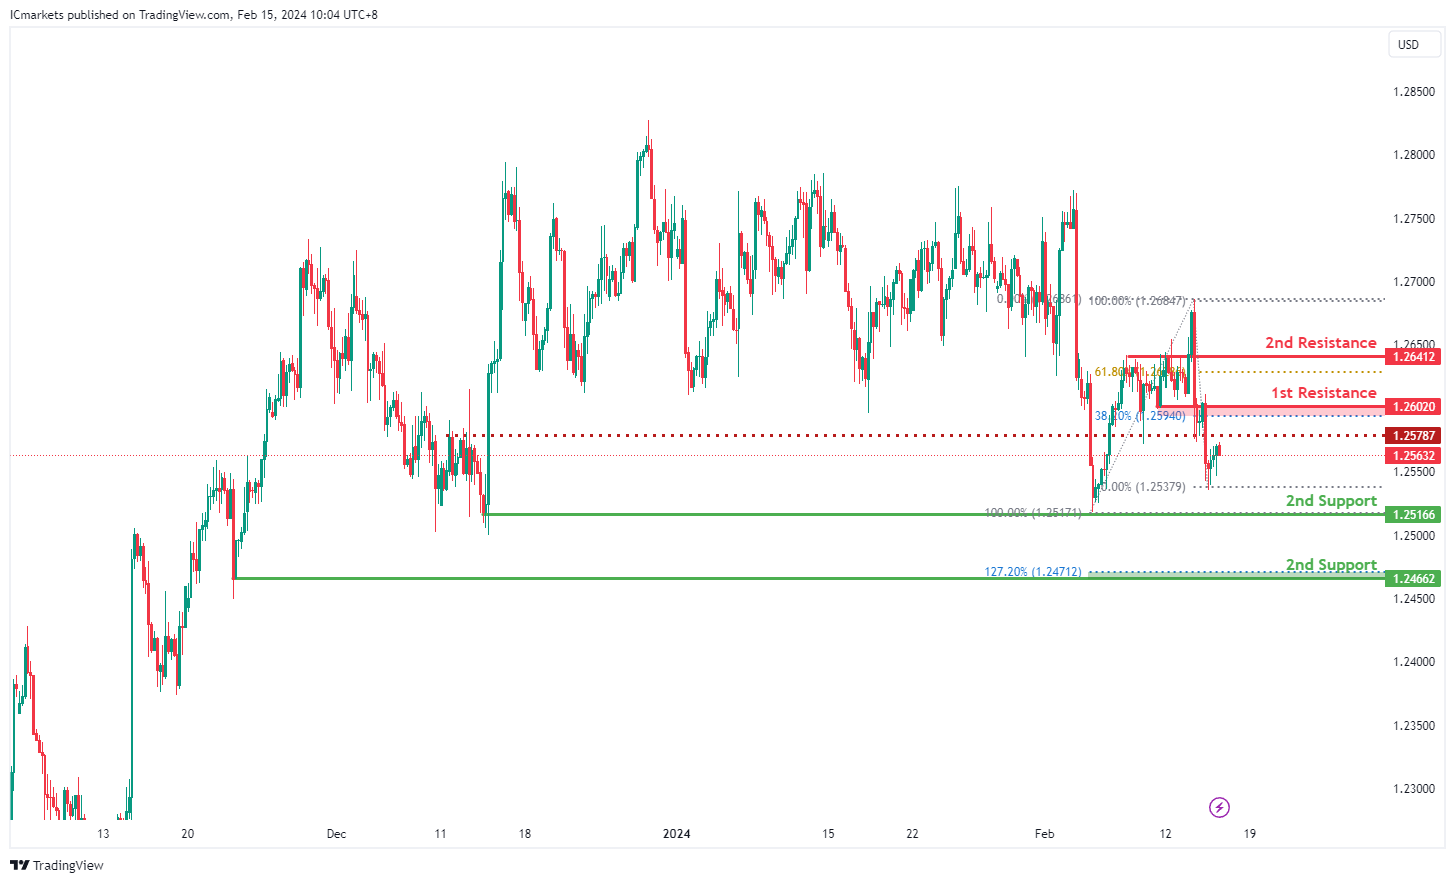
GBP/USD:
The GBP/USD chart currently demonstrates a bearish momentum.
There is a potential scenario where the price reacts bearishly upon reaching the 1st resistance level and subsequently declines towards the 1st support.
The 1st support level at 1.2516 is identified as a multi-swing low support, indicating its historical significance as a level where buying interest has emerged in the past.
Additionally, the 2nd support level at 1.2466 is characterized as a swing low support, further reinforced by the presence of the 127.20% Fibonacci Extension, enhancing its importance as a potential area of buying interest.
On the resistance side, the 1st resistance level at 1.2602 is categorized as an overlap resistance. This level coincides with the 38.20% Fibonacci Retracement, indicating its historical significance as a point of potential resistance.
Furthermore, the 2nd resistance at 1.2641 is identified as a pullback resistance, with the presence of the 61.80% Fibonacci Retracement, adding to its significance as a potential barrier for further upside movement.
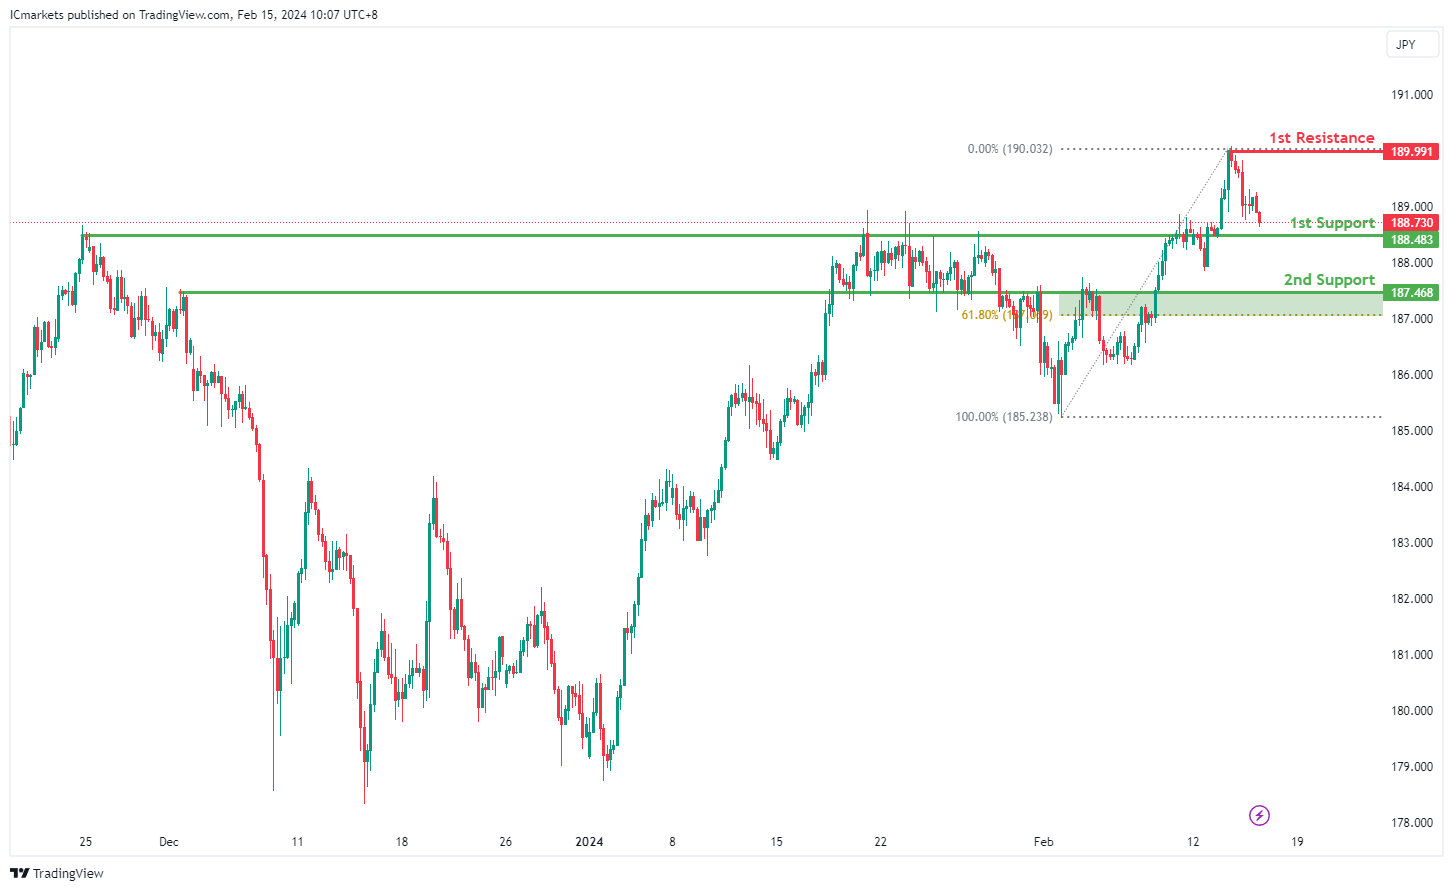
GBP/JPY:
The GBP/JPY chart currently exhibits a bearish overall momentum, suggesting a prevailing downward trend. Several factors contribute to this bearish sentiment, indicating the potential for a continued decline in price.
The 1st support level at 188.483 is identified as a significant level, characterized by pullback support. This suggests a historical area where buying interest has emerged following a pullback, potentially indicating a level where traders might look to enter long positions.
Furthermore, the 2nd support level at 187.478 aligns with an overlap support and the 61.80% Fibonacci Retracement level. This confluence strengthens its significance as a potential support zone, indicating a historical level where buyers have previously stepped in to support the price.
On the resistance side, the 1st resistance level at 189.991 represents a swing high resistance. This level may act as a barrier to further upward movement, as it denotes a historical point where selling pressure has been prevalent.
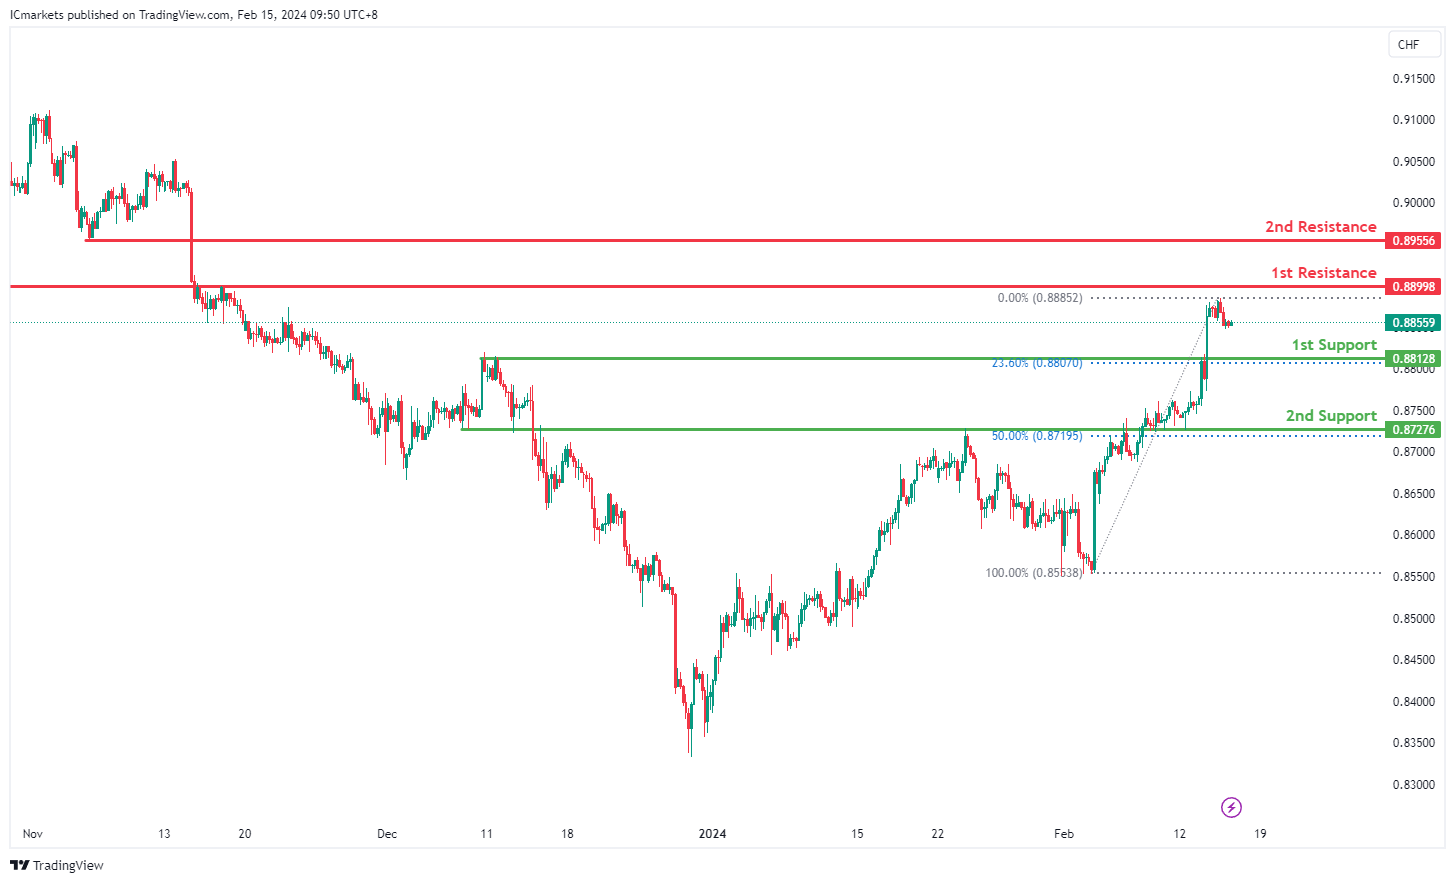
USD/CHF:
The USD/CHF chart currently indicates a bullish momentum.
There’s a potential scenario where the price may experience a short-term drop towards the 1st support before bouncing from there and moving towards the 1st resistance.
The 1st support level at 0.8812 is identified as a pullback support, coinciding with the 23.60% Fibonacci Retracement. This suggests historical significance as a level where buying interest has previously emerged.
Moreover, the 2nd support level at 0.727.0000 is characterized as an overlap support, coinciding with the 50% Fibonacci Retracement, further reinforcing its significance as a potential area of buying interest.
On the resistance side, the 1st resistance level at 0.8899 is categorized as an overlap resistance, indicating its historical significance as a point of potential resistance.
Additionally, the 2nd resistance at 0.8955 is identified as a pullback resistance, which could act as a barrier for further upside movement.
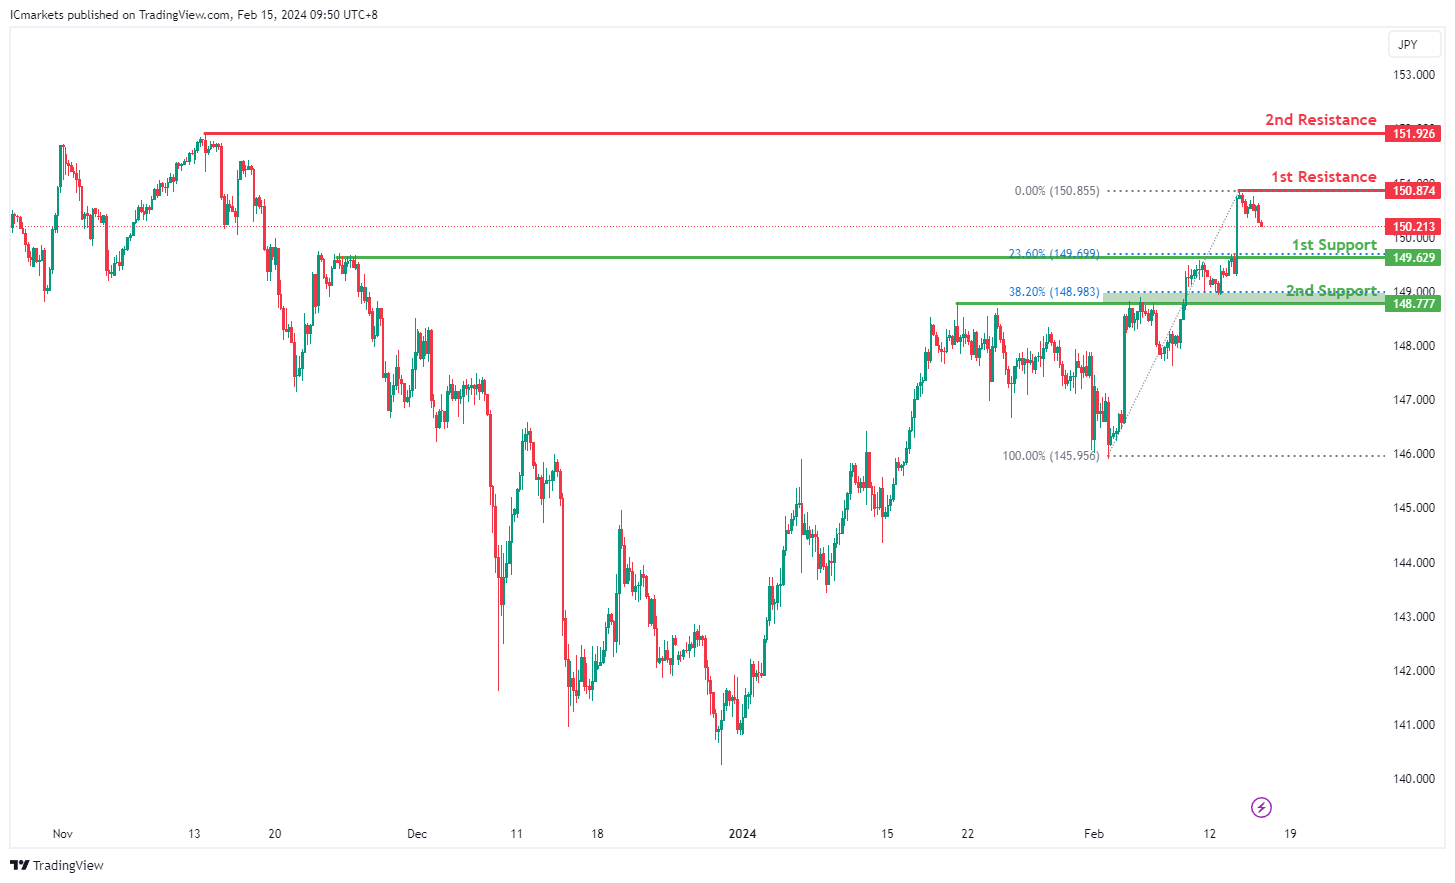
USD/JPY:
The USD/JPY chart currently demonstrates bullish momentum.
There’s a potential scenario where the price may experience a short-term drop towards the 1st support before bouncing from there and rising to the 1st resistance.
The 1st support level at 149.62 is identified as a pullback support, coinciding with the 23.60% Fibonacci Retracement. This suggests historical significance as a level where buying interest has previously emerged.
Furthermore, the 2nd support level at 148.77 is characterized as a pullback support, coinciding with the 38.20% Fibonacci Retracement, further reinforcing its significance as a potential area of buying interest.
On the resistance side, the 1st resistance level at 150.87 is categorized as a swing high resistance, indicating its historical significance as a point of potential resistance.
Additionally, the 2nd resistance at 151.92 is identified as another swing high resistance, which could act as a barrier for further upside movement.
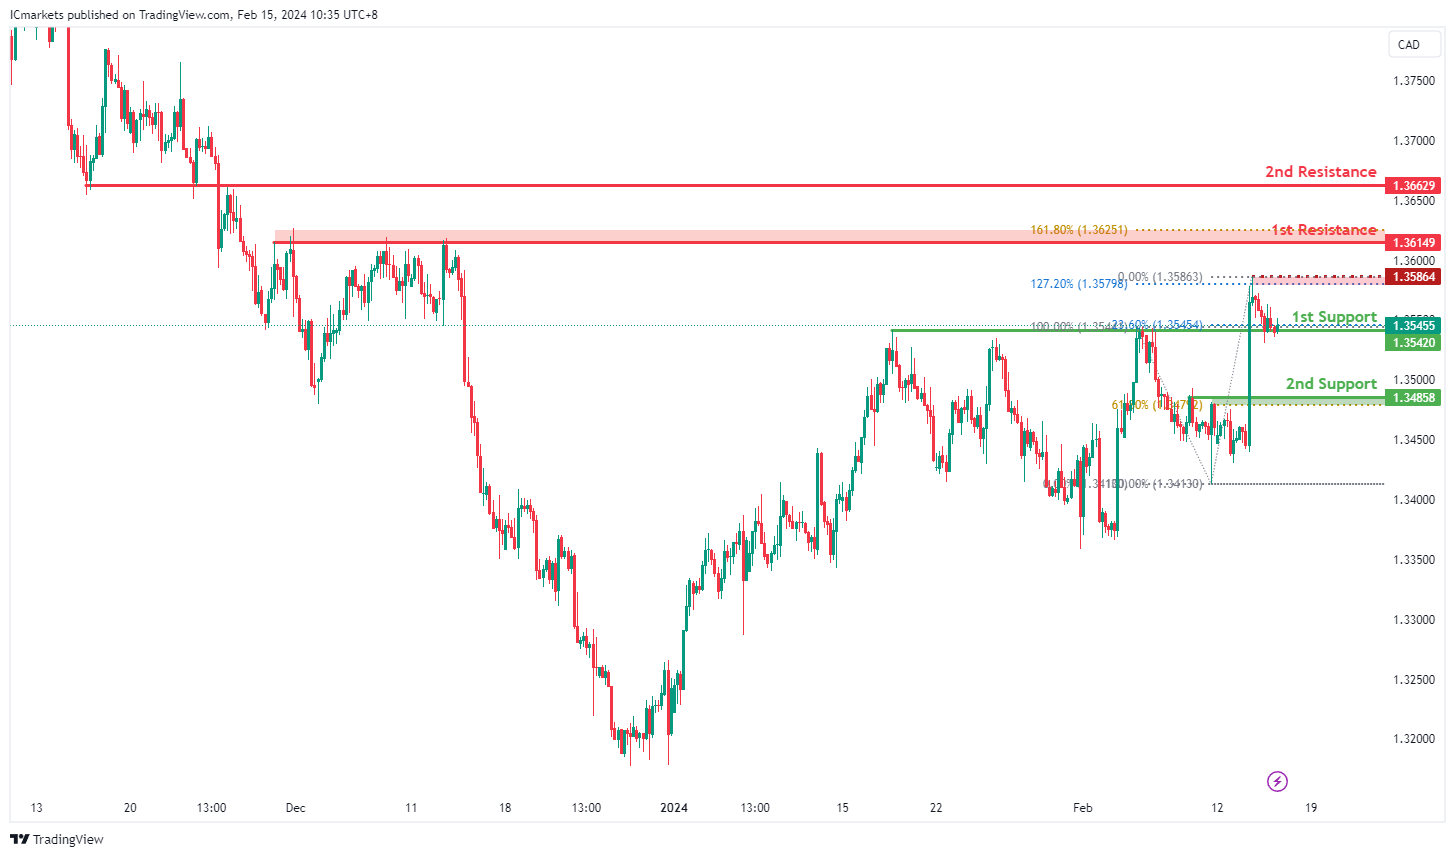
USD/CAD:
The USD/CAD chart currently exhibits a weak bullish momentum. In this context, there is a potential scenario for price to make a bullish bounce off the 1st support and rise towards the intermediate resistance.
The 1st support level at 1.3542 is identified as a pullback support that aligns with the 23.60% Fibonacci Retracement level. Further below, the 2nd support level at 1.3485 is also marked as a pullback support that aligns close to the 61.80% Fibonacci Retracement level, further emphasizing its importance as a potential support zone.
To the upside, the intermediate resistance level at 1.3586 is identified as a pullback resistance that aligns close to the 127.20% Fibonacci Extension level while the 1st resistance level at 1.3614 is also marked as a pullback resistance that aligns close to the 161.80% Fibonacci Extension level. Higher up, the 2nd resistance level at 1.3662 is noted as an overlap resistance, further highlighting its importance as a potential resistance point.
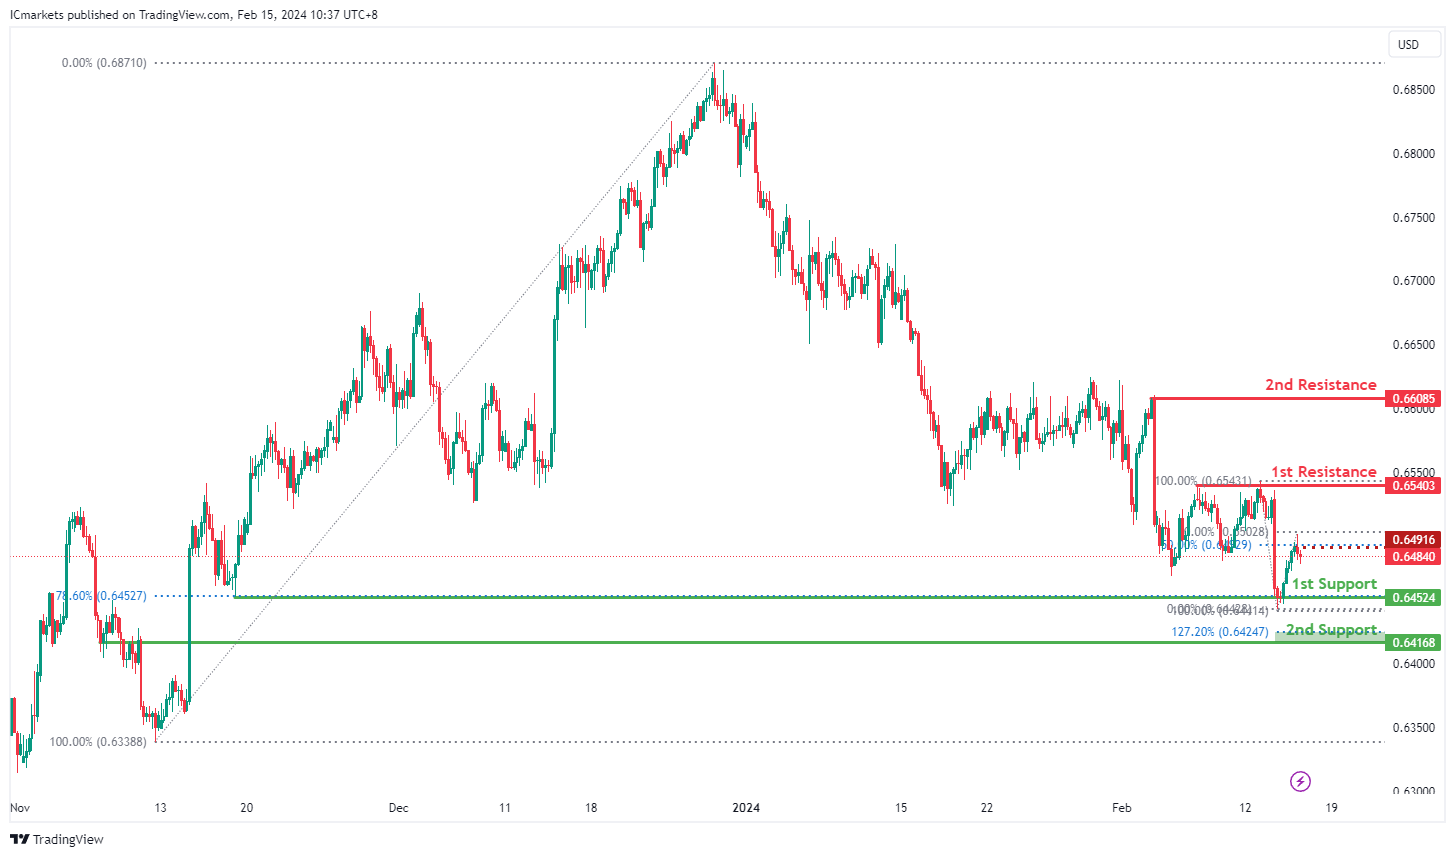
AUD/USD:
The AUD/USD chart currently exhibits a weak bullish momentum. In this context, there is a potential scenario for price to rise towards the 1st resistance should it break above the intermediate resistance.
The intermediate resistance level at 0.6491 is identified as a pullback resistance that aligns with the 50.00% Fibonacci Retracement level while the 1st resistance level at 0.6540 is also noted as a pullback resistance. Higher up, the 2nd resistance level at 0.6608 is also marked as a pullback resistance, further highlighting its importance as a potential resistance point.
To the downside, the 1st support level at 0.6452 is identified as pullback support that aligns with the 78.60% Fibonacci Retracement level. Further below, the 2nd support level at 0.6416 is noted as an overlap support that aligns close to the 127.20% Fibonacci Extension level, further emphasizing its importance as a potential support zone.
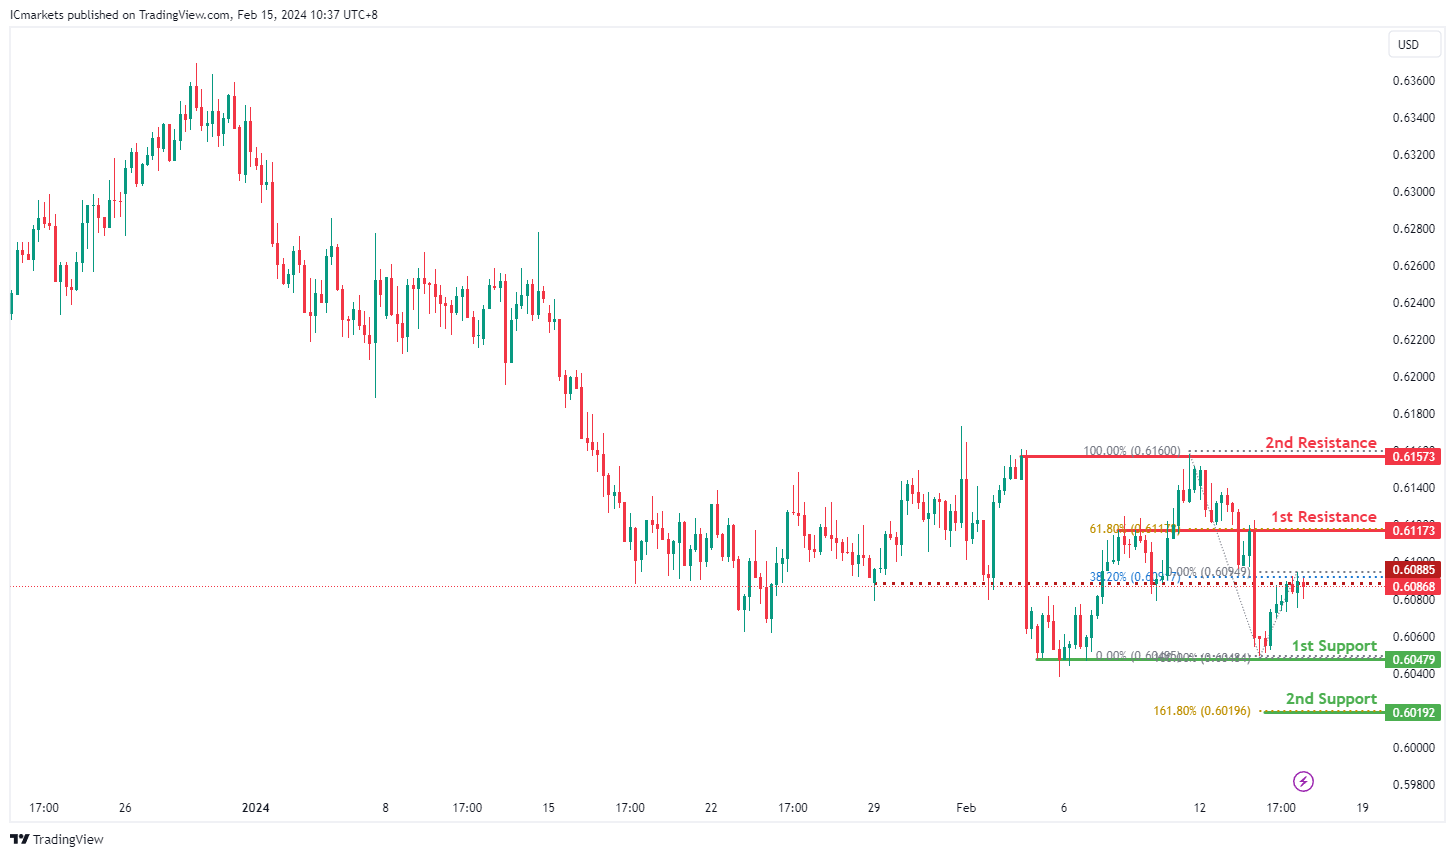
NZD/USD
The NZD/USD chart currently exhibits a weak bullish momentum. In this context, there is a potential scenario for price to rise towards the 1st resistance should it break above the intermediate resistance.
The intermediate resistance level at 0.6089 is identified as a pullback resistance that aligns close to the 38.20% Fibonacci Retracement level while the 1st resistance level at 0.6117 is noted as an overlap resistance that aligns with the 61.80% Fibonacci Retracement level. Higher up, the 2nd resistance level at 0.6157 is marked as a pullback resistance, further highlighting its importance as a potential resistance point.
To the downside, the 1st support level at 0.6047 is identified as a pullback support. Further below, the 2nd support level at 0.6019 is also noted as a pullback support that aligns with the 161.80% Fibonacci Extension level, further emphasizing its importance as a potential support zone.
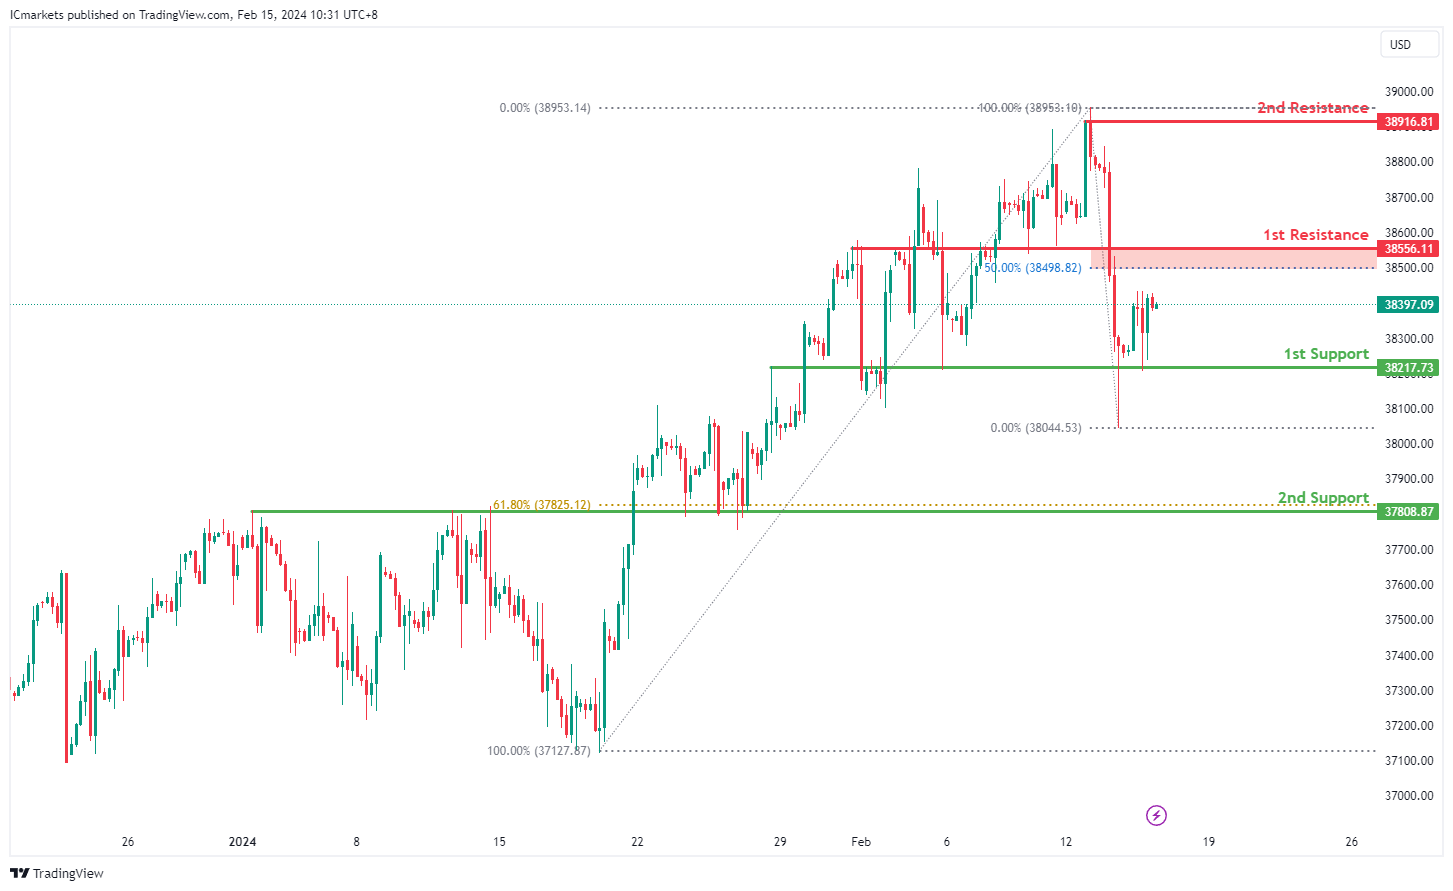
DJ30:
The DJ30 chart currently demonstrates a bullish overall momentum, indicating a prevalent upward trend. Several factors contribute to this bullish sentiment, suggesting the potential for a continued upward movement in price.
The 1st support level at 38217.73 is identified as significant due to its alignment with an overlap support. This suggests a historical level where buying interest has previously emerged, potentially indicating a strong level of support.
Additionally, the 2nd support level at 37808.87 corresponds to both an overlap support and the 61.80% Fibonacci Retracement level. This confluence of support factors further reinforces its significance as a potential support zone, indicating a level where buyers may be inclined to enter the market.
On the resistance side, the 1st resistance level at 38556.11 is identified as a point where selling pressure may increase, as it aligns with both an overlap resistance and the 50% Fibonacci Retracement level. This suggests a historical point where selling interest has been strong and could act as a barrier to further upward movement.
Further up, the 2nd resistance level at 38916.81 corresponds to a swing high resistance, indicating another potential barrier to upward movement.
GER40:
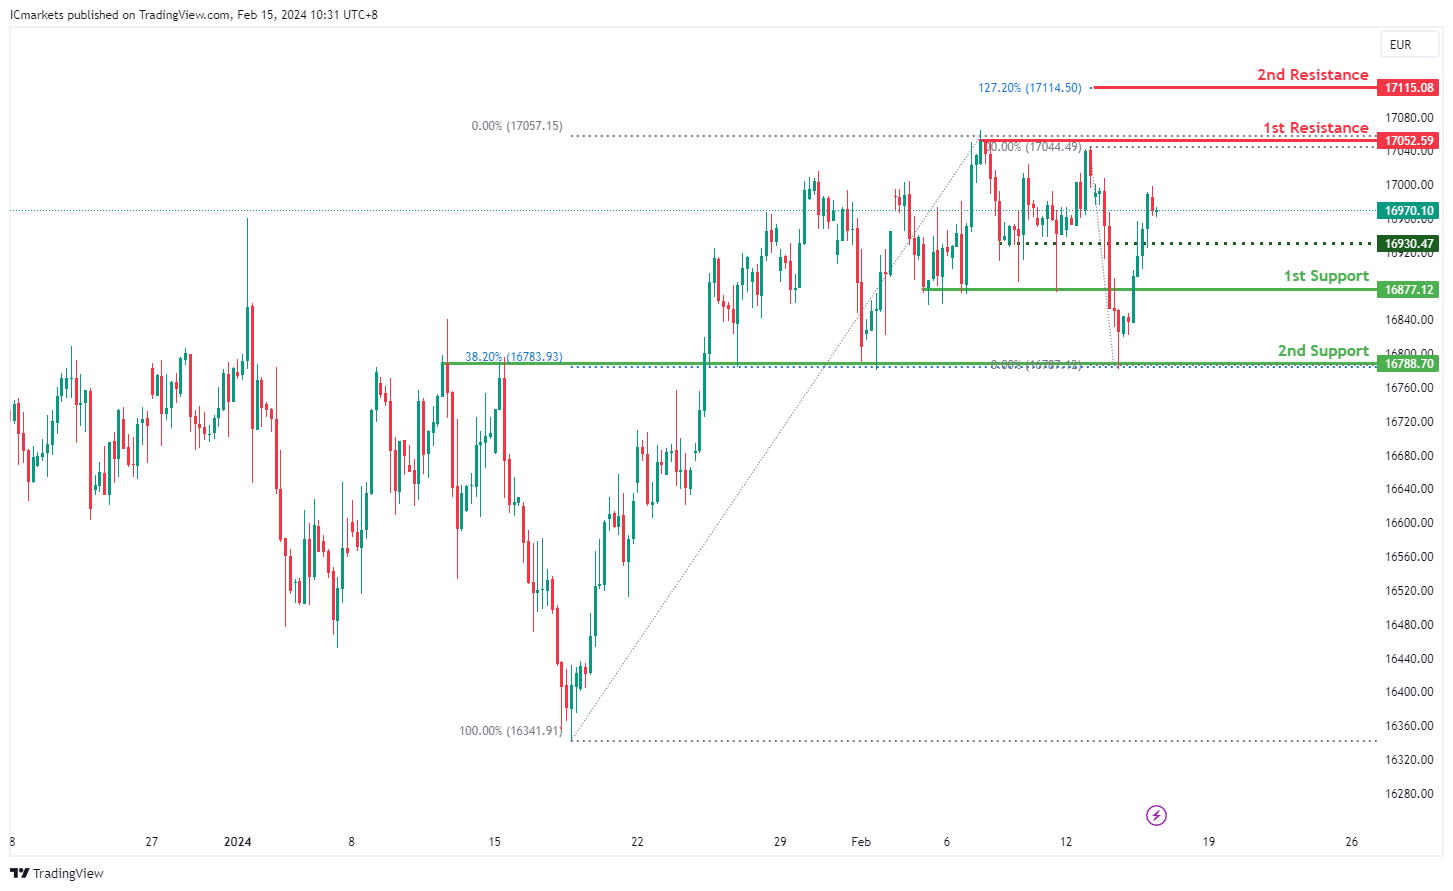
The GER40 chart currently maintains a bearish overall momentum, indicating a prevalent downward trend. Several factors contribute to this bearish sentiment, suggesting the potential for a continued downward movement in price.
The 1st support level at 16877.1 is identified as significant, representing a pullback support. This suggests a historical level where buying interest has previously emerged, potentially offering a level of support for the price.
Furthermore, the 2nd support level at 16788.7 corresponds to both an overlap support and the 38.20% Fibonacci Retracement level. This confluence of support factors strengthens its significance as a potential support zone, indicating a level where buyers may intervene.An intermediate support level at 16930.5 is also identified, which corresponds to a pullback support, providing additional reinforcement to the support structure.
On the resistance side, the 1st resistance level at 17052.6 is noted as a point where selling pressure may intensify, as it represents a pullback resistance. This indicates a historical point where selling interest has been strong and could act as a barrier to further upward movement.
Additionally, the 2nd resistance level at 17115.1 aligns with the 127.20% Fibonacci Extension, adding to its significance as a potential barrier to upward movement.
US500:
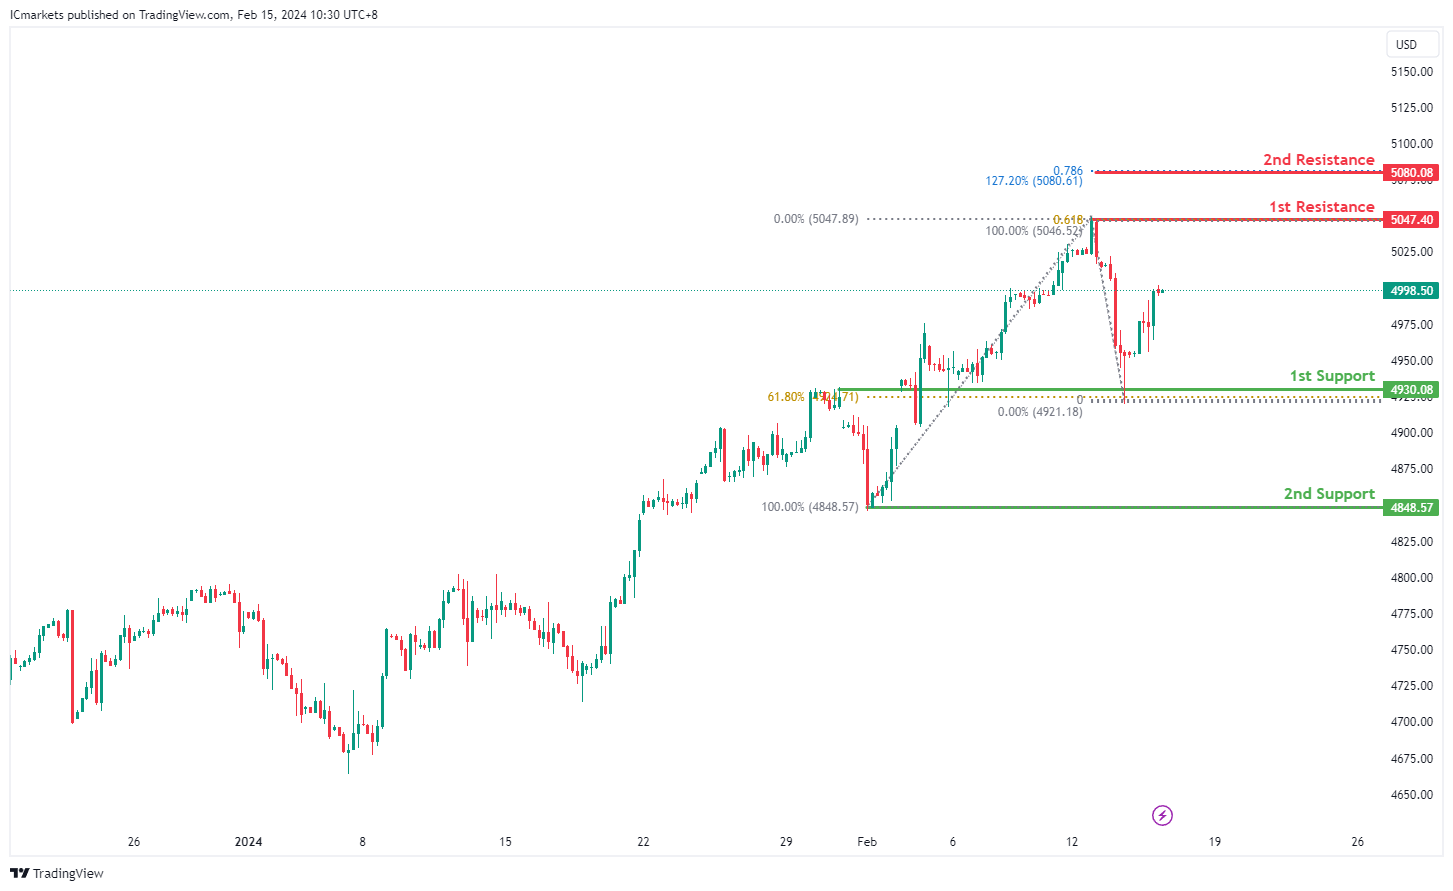
The US500 chart currently demonstrates a bullish overall momentum, indicating a prevalent upward trend. Several factors contribute to this bullish sentiment, suggesting the potential for a continued upward movement in price.
The 1st support level at 4930.1 is deemed significant as it aligns with both an overlap support and the 61.80% Fibonacci Retracement level. This convergence of support factors suggests a robust level where buying interest has historically emerged, potentially providing a solid foundation for further upward movement.
Additionally, the 2nd support level at 4848.6 corresponds to a swing low support, further reinforcing its importance as a potential support zone. This level indicates a significant historical level where buyers have previously intervened to support the price.
On the resistance side, the 1st resistance level at 5047.4 is identified as a point where selling pressure may increase, as it represents a swing high resistance and aligns with the 61.80% Fibonacci Projection. This suggests a historical point where selling interest has been strong and could act as a barrier to further upward movement.
Further up, the 2nd resistance level at 5080.1 aligns with both the 127.20% and 78.60% Fibonacci Extensions, adding to its significance as a potential barrier to upward movement.
BTC/USD:
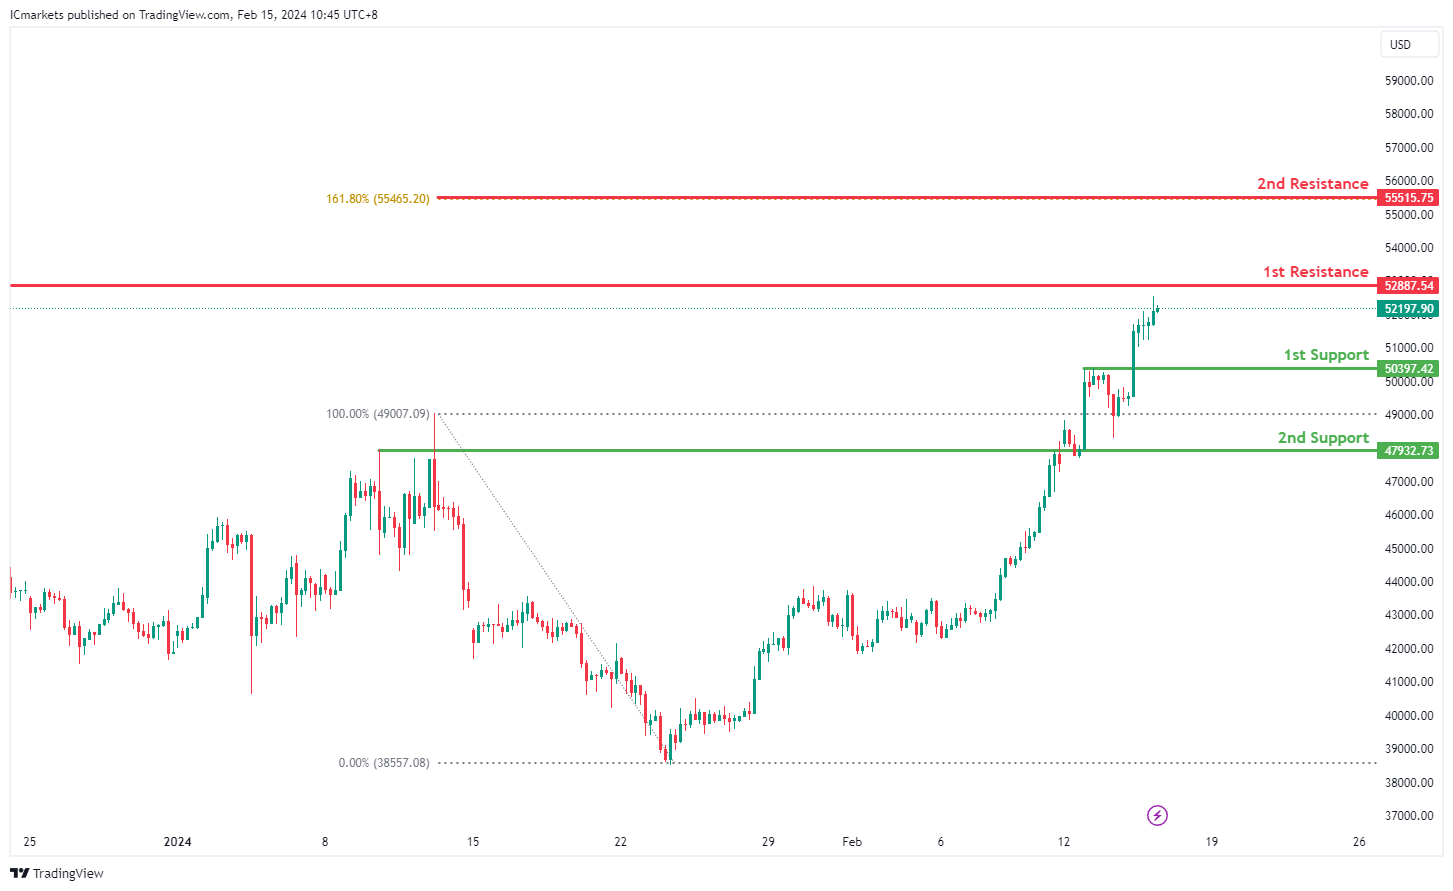
The BTC/USD chart currently exhibits a bullish overall momentum, indicating a prevailing upward trend. Several factors contribute to this bullish sentiment, suggesting the potential for further upward movement in price.
The 1st support level at 50397.42 is significant as it represents a pullback support. This level indicates a historical point where buying interest has previously emerged, potentially acting as a foundation for continued upward movement.
Additionally, the 2nd support level at 47932.73 aligns with an overlap support, further reinforcing its importance as a potential support zone. This level suggests a historical area where buyers have shown significant interest in supporting the price, adding credibility to its role as a support level.
On the resistance side, the 1st resistance level at 52887.54 aligns with a multi-swing high resistance. This level represents a historical point where selling pressure has been strong, potentially acting as a barrier to further upward movement.
Further up, the 2nd resistance level at 55515.75 corresponds to the 161.80% Fibonacci Extension, adding to its significance as a resistance level. Fibonacci extensions are commonly used to identify potential price targets, suggesting that this level could present a significant hurdle for further price appreciation.
ETH/USD:
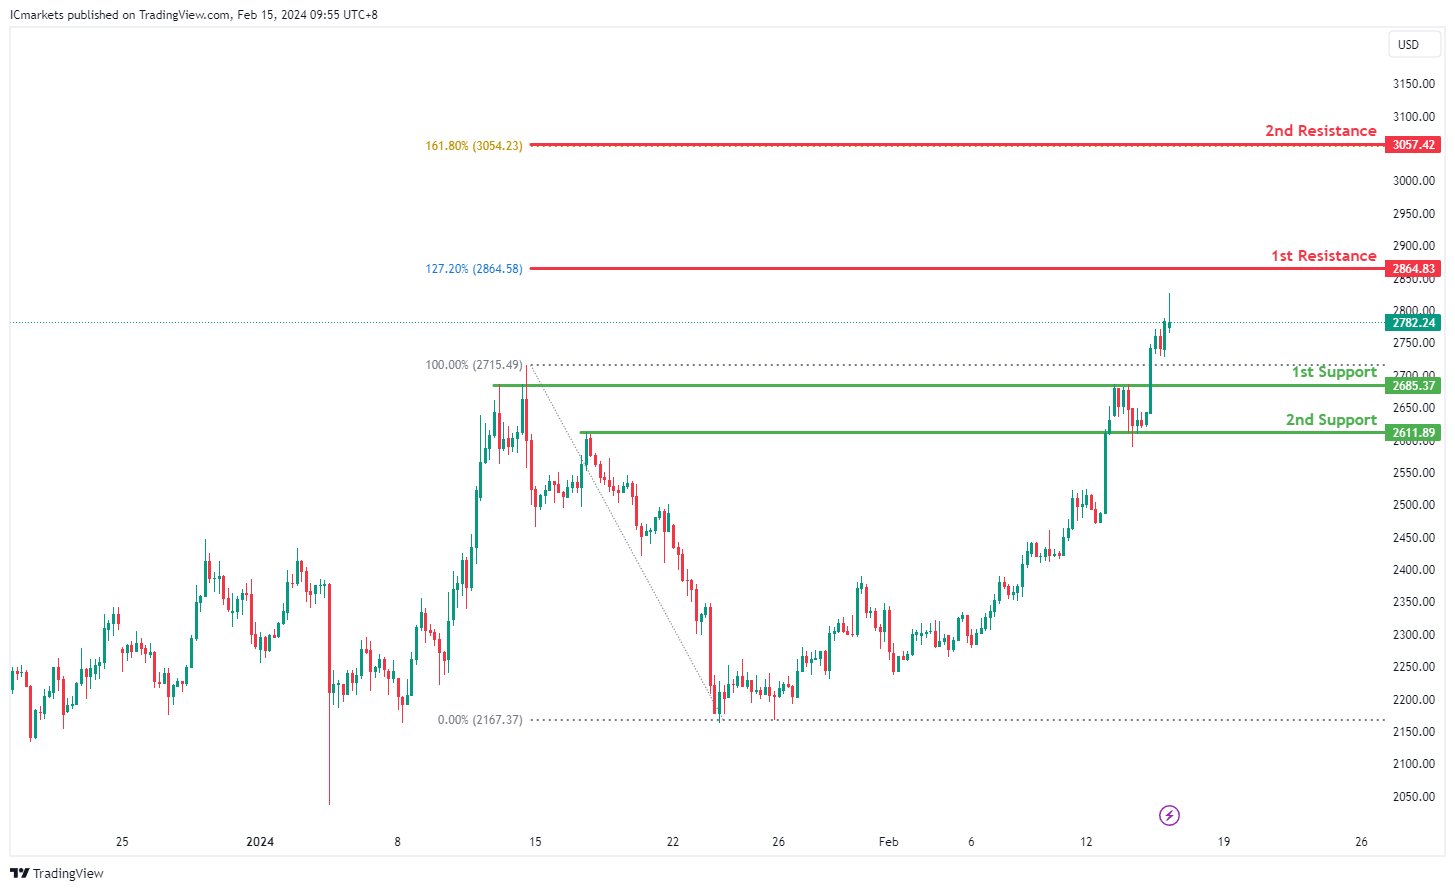
The ETH/USD chart currently indicates a bullish overall momentum, suggesting a predominant upward trend. Several factors contribute to this bullish sentiment, indicating the potential for further upward movement in price.
The 1st support level at 2685.37 is significant as it represents a pullback support, indicating a historical level where buying interest has previously emerged. This level could serve as a foundation for further upward movement, with buyers potentially entering the market at this point.
Additionally, the 2nd support level at 2611.89 aligns with an overlap support, further reinforcing its importance as a potential support zone. This level indicates a historical area where buyers have shown significant interest in supporting the price, adding credibility to its role as a support level.
On the resistance side, the 1st resistance level at 2864.83 aligns with the 127.20% Fibonacci Extension, which adds significance to this resistance level. Fibonacci extensions are commonly used by traders to identify potential price targets, suggesting that this level could present a significant hurdle for further upward movement.
Furthermore, the 2nd resistance level at 3057.42 corresponds to the 161.80% Fibonacci Extension, further emphasizing its importance as a resistance level. This level indicates a potential price target derived from Fibonacci analysis and could act as a strong barrier to further price appreciation.
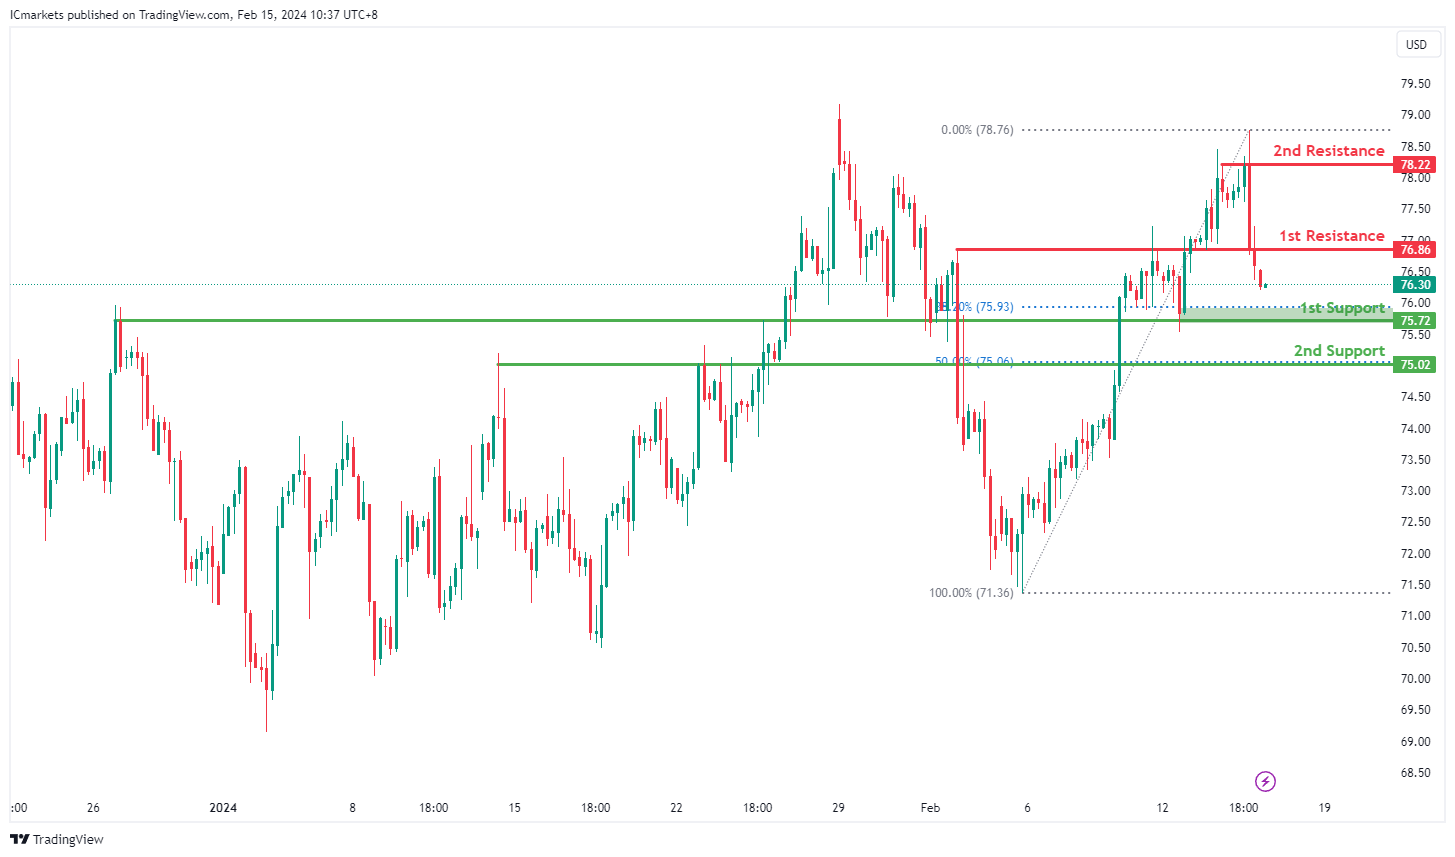
WTI/USD:
The WTI (West Texas Intermediate) chart currently exhibits an overall bearish momentum. In this context, there is a potential scenario for price to drop towards the 1st support.
The 1st support level at 75.72 is identified as an overlap support that aligns close to the 38.20% Fibonacci Retracement level. Further below, the 2nd support level at 75.02 is also noted as an overlap support that aligns with the 50.00% Fibonacci Retracement level, reinforcing its significance as a key support level.
To the upside, the 1st resistance level at 76.86 is identified as an overlap resistance. Higher up, the 2nd resistance level at 78.22 is marked as a pullback resistance, further highlighting its importance as a potential resistance zone.
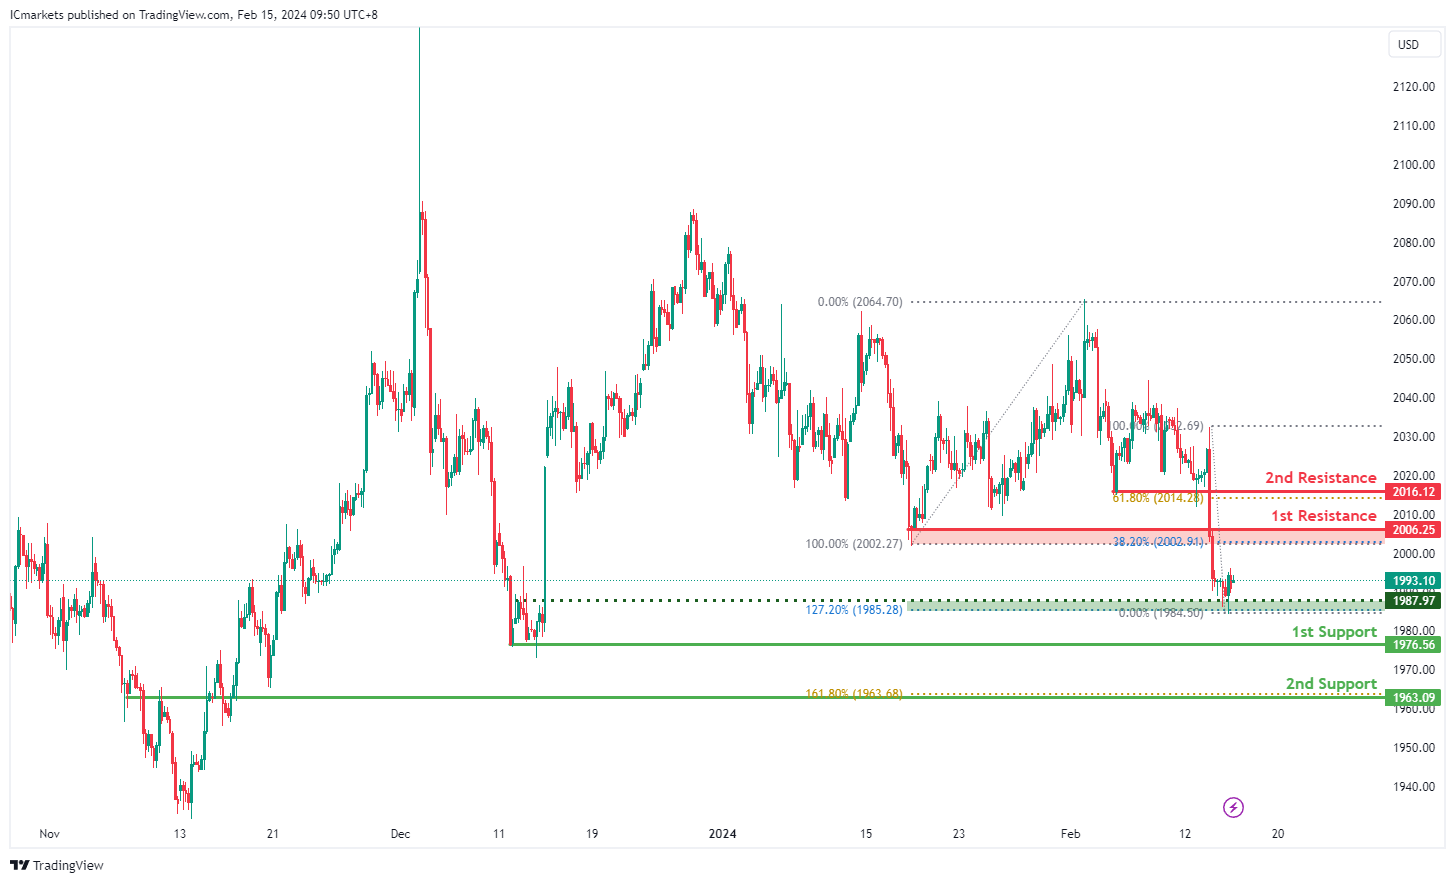
XAU/USD (GOLD):
The XAUUSD chart currently exhibits a bearish overall momentum, indicating a downward trend.
There’s a potential scenario where the price may rise towards the 1st resistance in the short term before reversing off it and dropping towards the 1st support.
The 1st support level at 1976.56 is identified as a multi-swing low support, suggesting historical significance as a strong support level where buying interest may emerge.
Additionally, the 2nd support level at 1963.09 is characterized as an overlap support, coinciding with the 161.80% Fibonacci Extension, further emphasizing its importance as a potential support zone.
On the resistance side, the 1st resistance level at 2006.25 is categorized as a pullback resistance, coinciding with the 38.20% Fibonacci Retracement, indicating its historical significance as a point of potential resistance.
Moreover, there is a 2nd resistance level at 2016.12, identified as another pullback resistance, coinciding with the 61.80% Fibonacci Retracement, which further adds to its significance as a potential barrier for further upside movement.


