
- Nikkei 225 has continued its bullish momentum despite a technical recession in the Japanese economy.
- Current price action is just 0.9% away from its 38,957 all-time high printed in December 1989.
- Medium-term momentum is overbought but no clear signs of bullish trend exhaustion.
- Watch the 38,260 key short-term support.
Since our last analysis, the Nikkei 225 has staged a rally of +13% to print a current intraday high of 38,865 at this time of the writing, a whisker away from its all-time high of 38,957 printed around 34 years ago in December 1989.
Outperformance of Nikkei 225 over Nasdaq 100
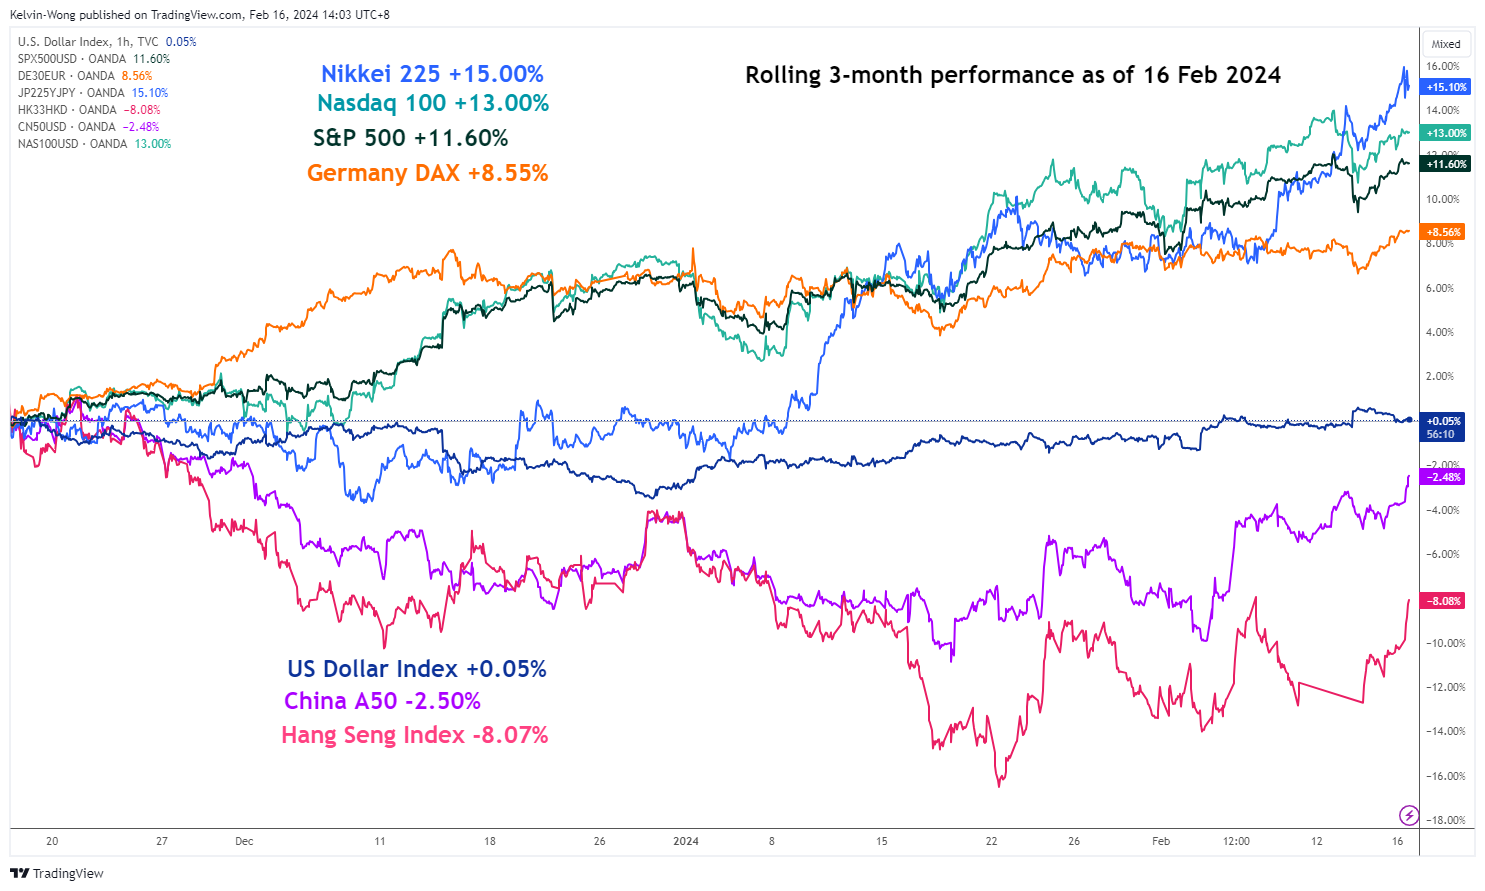
Fig 1: 3-month rolling performance of Nikkei 225 & other major stock indices as of 16 Feb 2024 (Source: TradingView, click to enlarge chart)
Also, on a three-month rolling performance measurement basis as of 16 February 2024, the Nikkei 225 has outperformed the heavily concentrated technology and artificial intelligence-focused Nasdaq 100 marginally (15% vs. 13%) (see Fig 1).
The impulsive upmove sequence remains intact
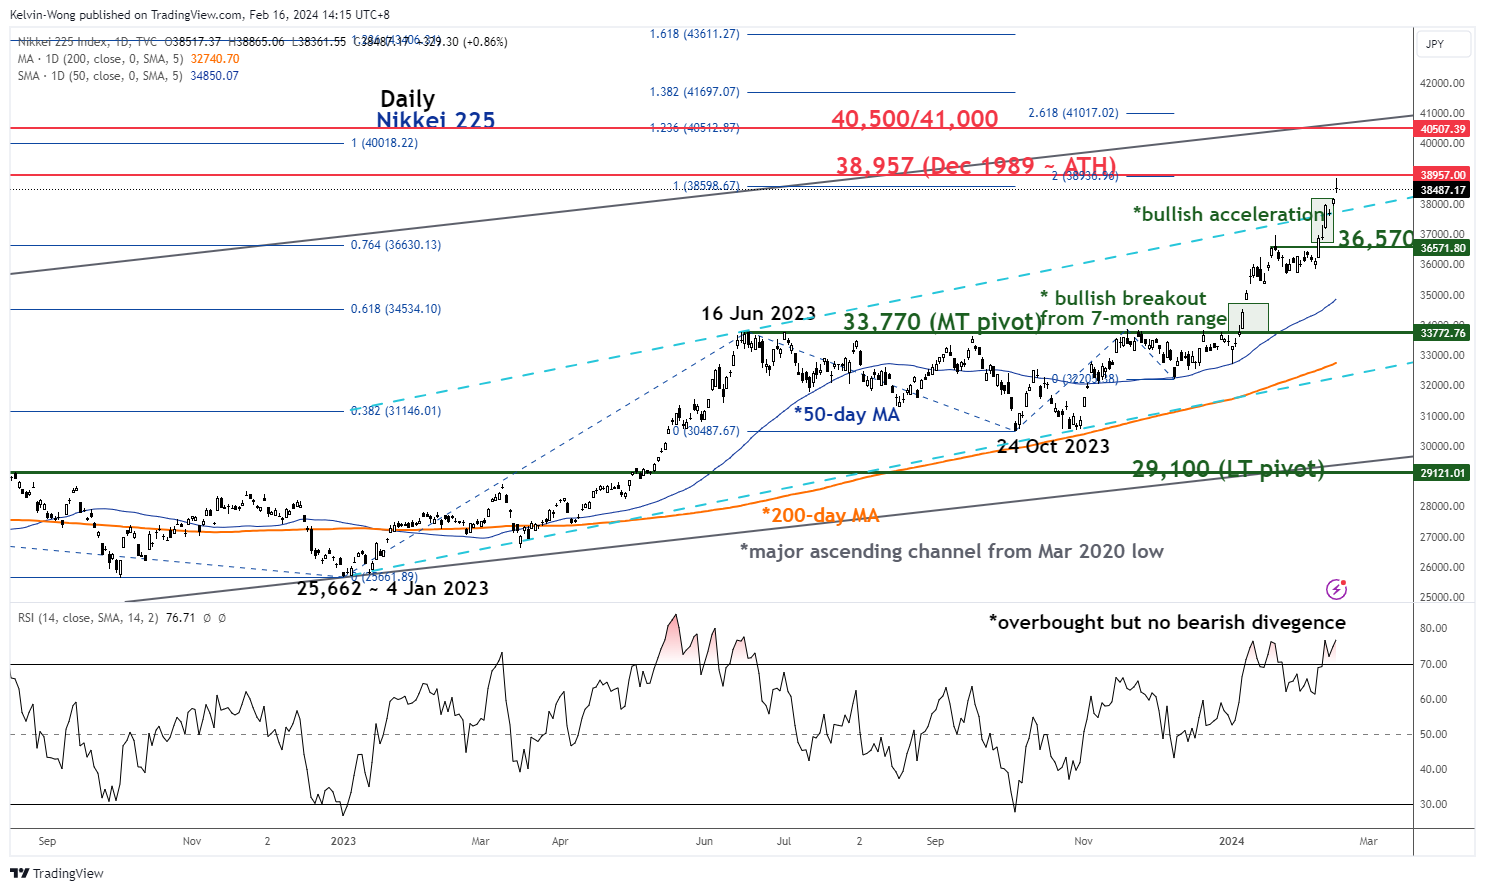
Fig 2: Nikkei 225 major & medium-term trends as of 16 Feb 2024 (Source: TradingView, click to enlarge chart)
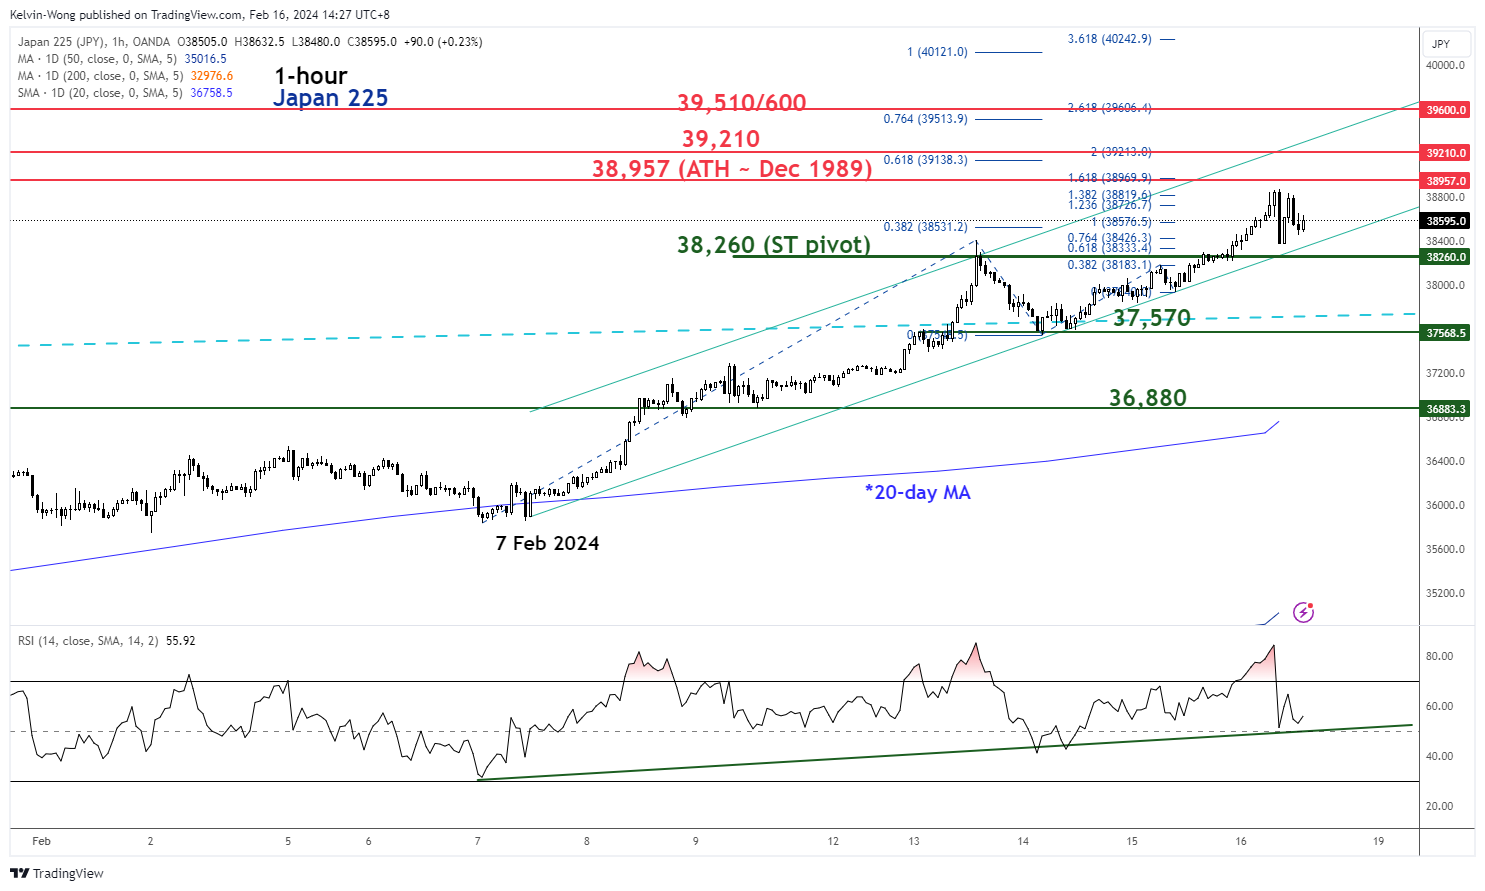
Fig 3: Japan 225 short-term trend as of 16 Feb 2024 (Source: TradingView, click to enlarge chart)
In the lens of technical analysis, the major uptrend phase of the Nikkei 225 remains intact as its price actions staged a bullish acceleration on this Tuesday, 13 February via the clearance above its former upper boundary of its ascending channel projected from the start of January 2023.
The recent upward acceleration has led to a current overbought reading level of 77 in the daily RSI momentum indicator. However, no bearish divergence condition has been flashed out yet and it is still below its prior significant peak of 84 printed on 23 May 2023.
These observations suggest that medium-term upside momentum is likely to be intact. A clearance above the current all-time high level of 38,957 is likely to see the next medium-term resistance coming in at 40,500/41,000 (the upper boundary of a major ascending channel projected from March 2020 low & a Fibonacci extension cluster level).
In a shorter time horizon, as inferred from the hourly chart of the Japan 225 Index (a proxy of the Nikkei 225 futures), the hourly RSI momentum indicator has remained above a key parallel ascending support after a slide from its overbought condition seen in today’s Asian session.
In addition, the hourly RSI has also managed to shape a “higher low” above the 50 level which suggests that the current minor short-term impulsive upmove sequence of the ongoing minor uptrend phase in place since the 7 February 2024 low remains intact.
Watch the 38,260 short-term pivotal support with the next intermediate resistances coming in at 39,120 and 39,510/600 (the upper boundary of the minor ascending channel & a Fibonacci extension cluster level).
However, failure to hold at 38,260 negates the bullish tone for a minor corrective decline to expose the next intermediate support at 37,570 (the pull-back of the former ascending channel resistance projected from the 3 January 2023 low), and below it sees the risk of a further slide towards the next support at 36,880 (also the upward sloping 20-day moving average).


