Hello fellow traders. In this technical article we’re going to take a look at the Elliott Wave charts charts of NASDAQ Futures published in members area of the website. As our members know NASDAQ has recently made pull back that has unfolded as Elliott Wave Zig Zag pattern. It made clear 3 waves down from the February 12th peak and completed correction right at the Equal Legs zone ( Blue Box Area) . In further text we’re going to explain the Elliott Wave pattern and trading setup.
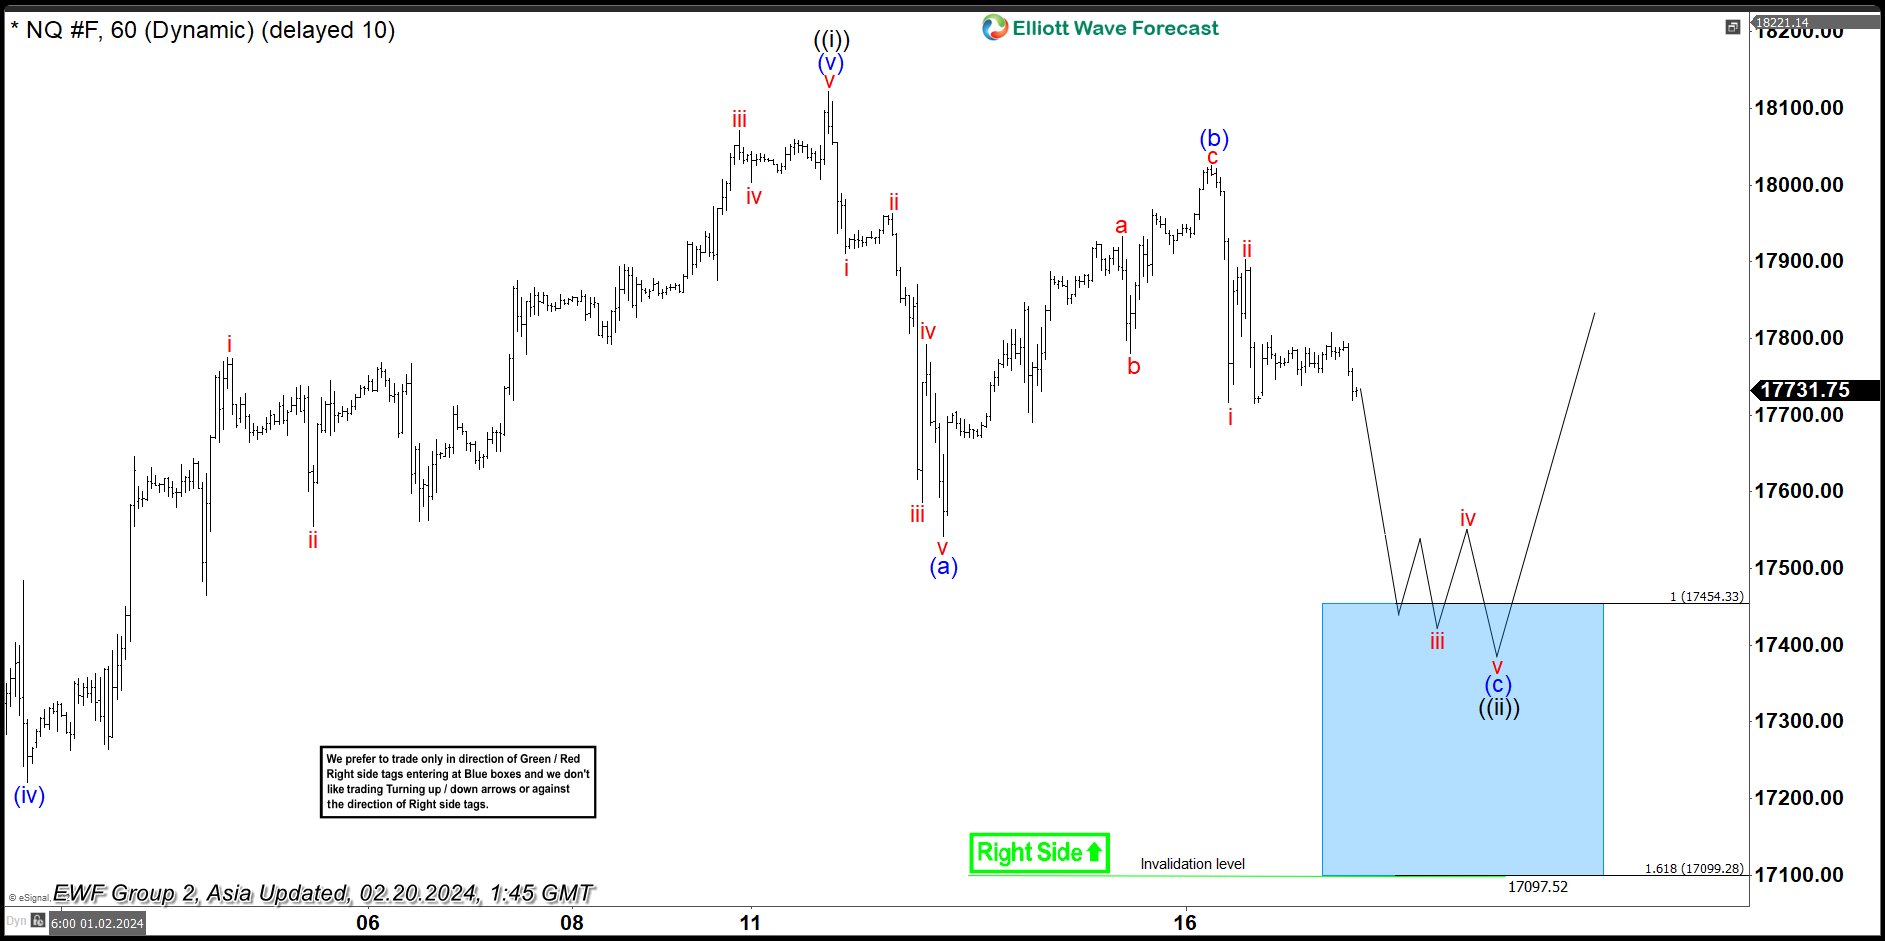
NASDAQ Elliott Wave 1 Hour Chart 02.20.2024
NASDAQ has made 5 waves down from the peak, suggesting we have potentially ended only first leg of the correction that is unfolding as a Elliott Wave Zig Zag pattern. Correction has (a)(b)(c) labeling. The price structure is incomplete at the moment, calling for a more downside in near term toward : 17454.3-17099.2. We don’t recommend selling NASDAQ and prefer the long side from the marked Blue Box ( buying zone). Once NQ_F reaches our buying area, it should ideally make either rally toward new highs or in 3 waves bounce alternatively. Once bounce reaches 50 Fibs against the (b) blue high, we will make long position risk free ( put SL at BE) and take partial profits.
Official trading strategy on How to trade 3, 7, or 11 swing and equal leg is explained in details in Educational Video, available for members viewing inside the membership area.
Quick reminder on how to trade our charts :
Red bearish stamp+ blue box = Selling Setup
Green bullish stamp+ blue box = Buying Setup
Charts with Black stamps are not tradable. 🚫
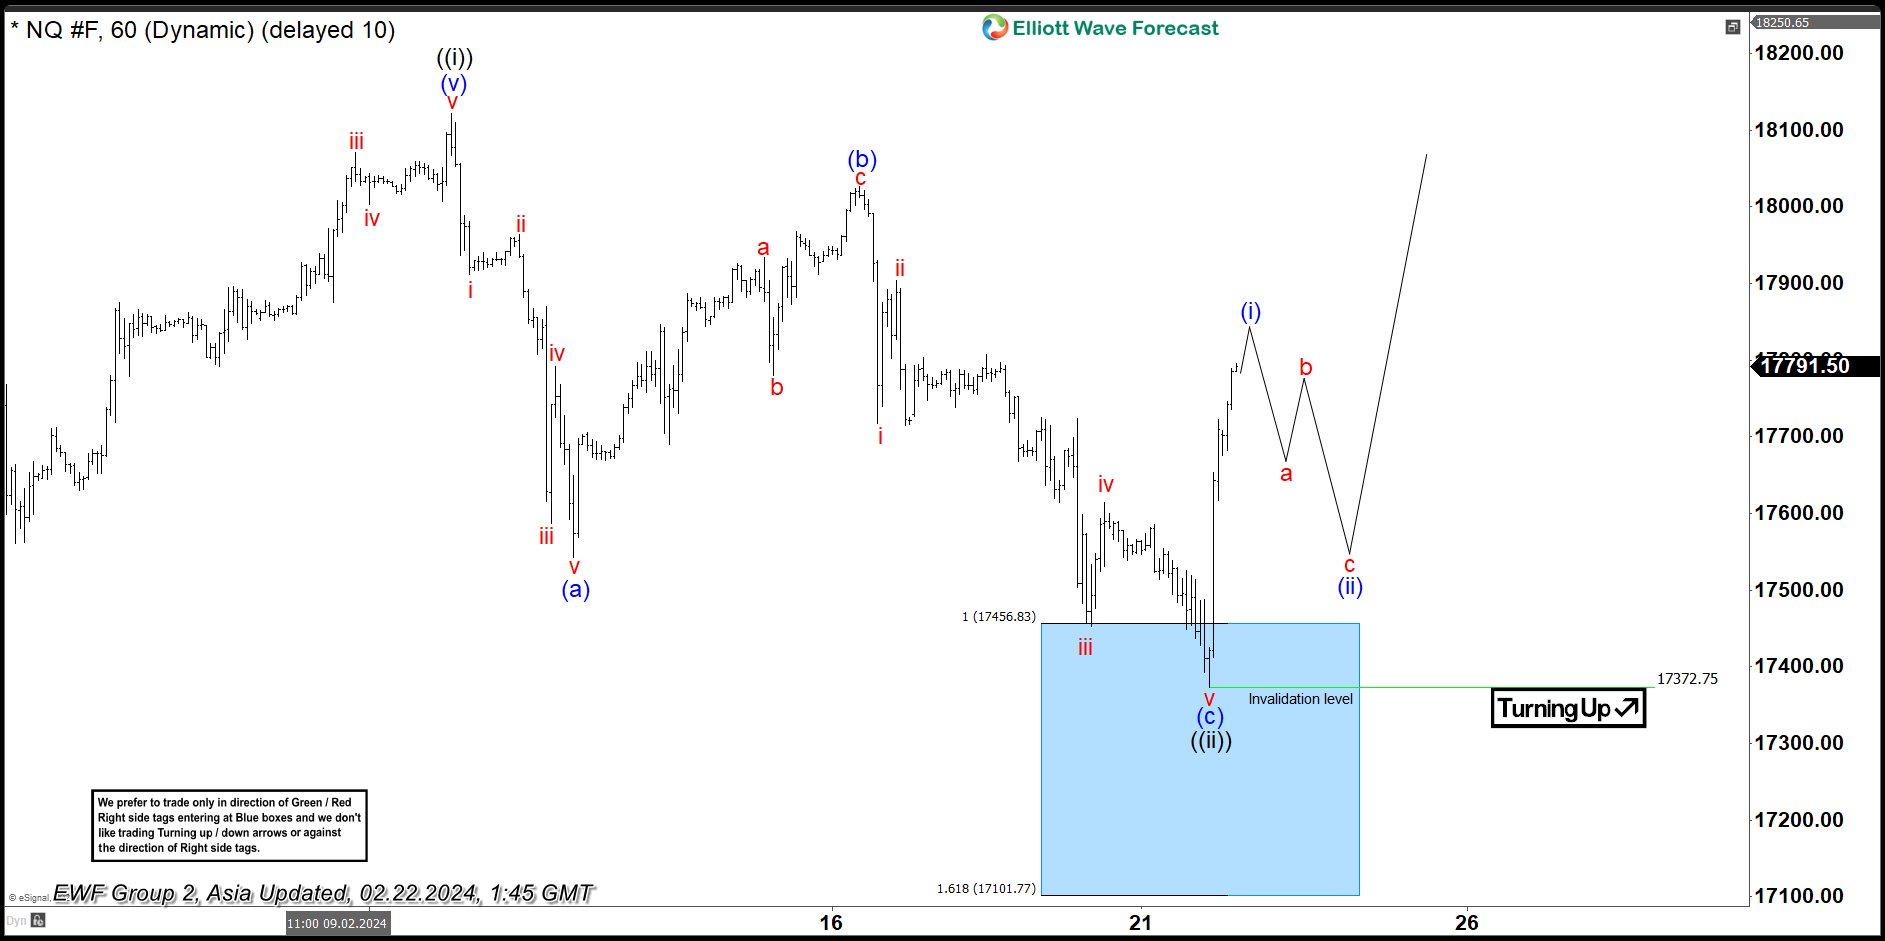
NASDAQ Elliott Wave 1 Hour Chart 02.22.2024
NASDAQ made extension toward our buying zone at : 17454.3-17099.2 as we expected. NQ futures found buyers at the blue box and we are getting very good reaction from there. Bounce already reached 50 fibs against the (b) blue connector which confirms cycle from the peak is done. Consequently, any long positions from the equal legs area should be risk free by now. As far as the price stays above 17372.7 low, we can see further strength in NASDAQ targeting 18306 area ideally.