
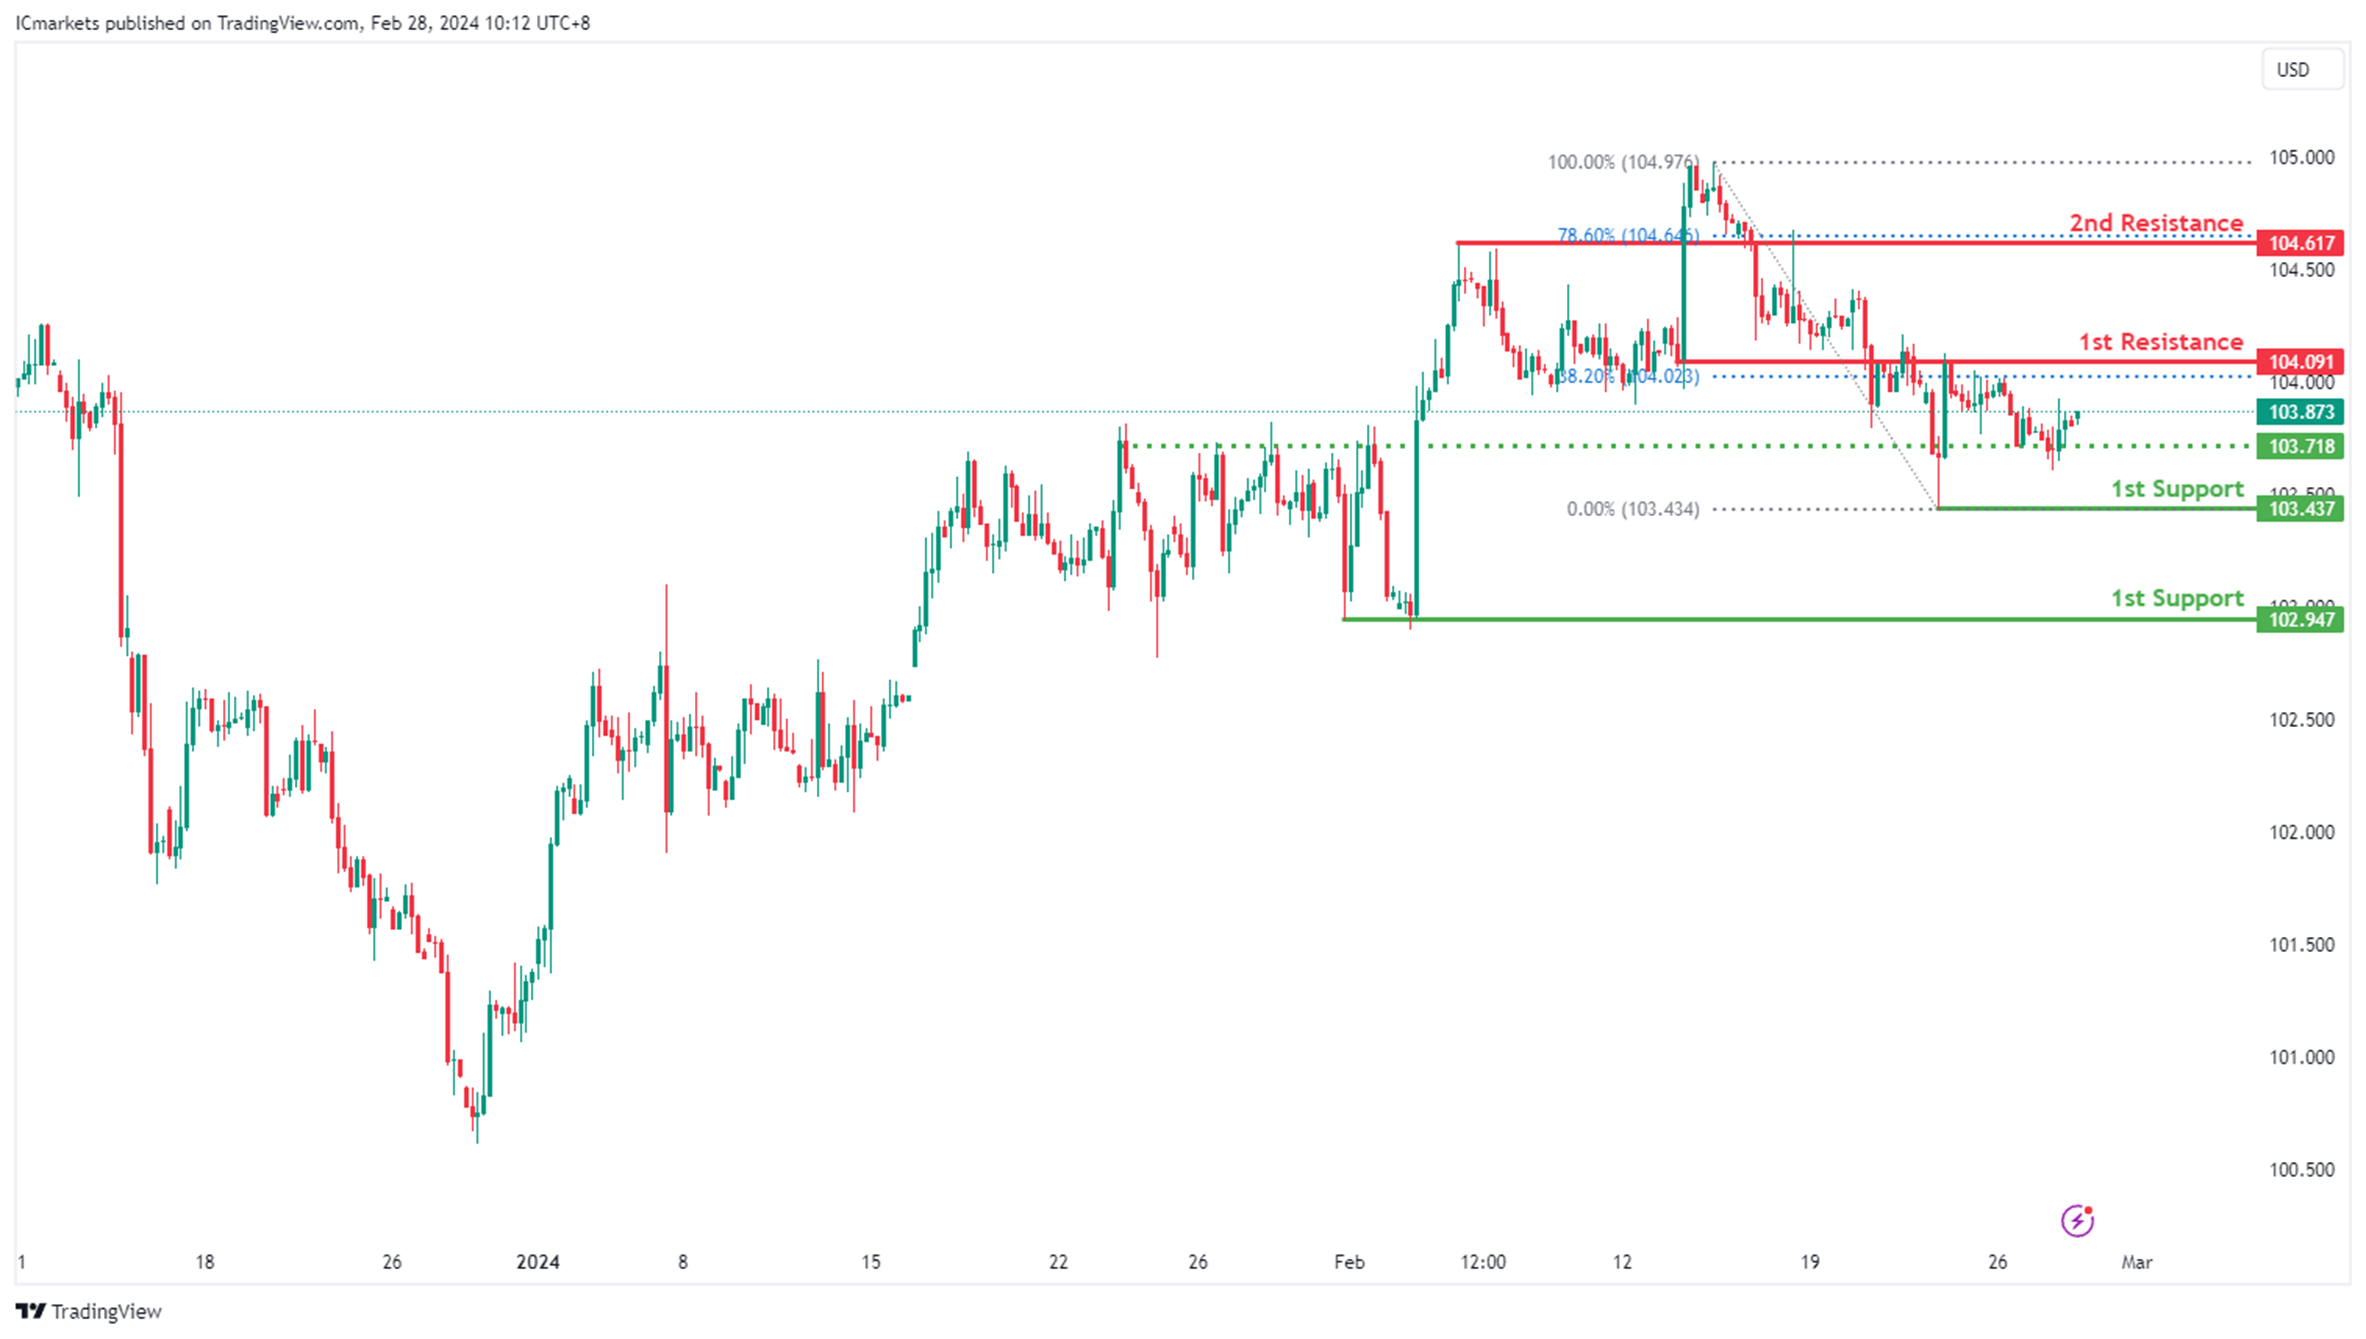
DXY:
The DXY chart currently exhibits a bearish momentum. However, price could rise towards the 1st resistance before resuming a potential bearish continuation towards the 1st support.
The 1st resistance level at 104.09 is identified as an overlap resistance that aligns close to the 38.20% Fibonacci Retracement level. Higher up, the 2nd resistance level at 104.61 is marked as a pullback resistance that aligns with the 78.60% Fibonacci Retracement level, further highlighting its importance as a potential resistance zone.
To the downside, the intermediate support level at 103.71 is identified as an overlap support while the 1st support level at 103.43 is noted as a pullback. Further below, the 2nd support level at 102.94 is also marked as a pullback support, reinforcing its significance as a key support level.
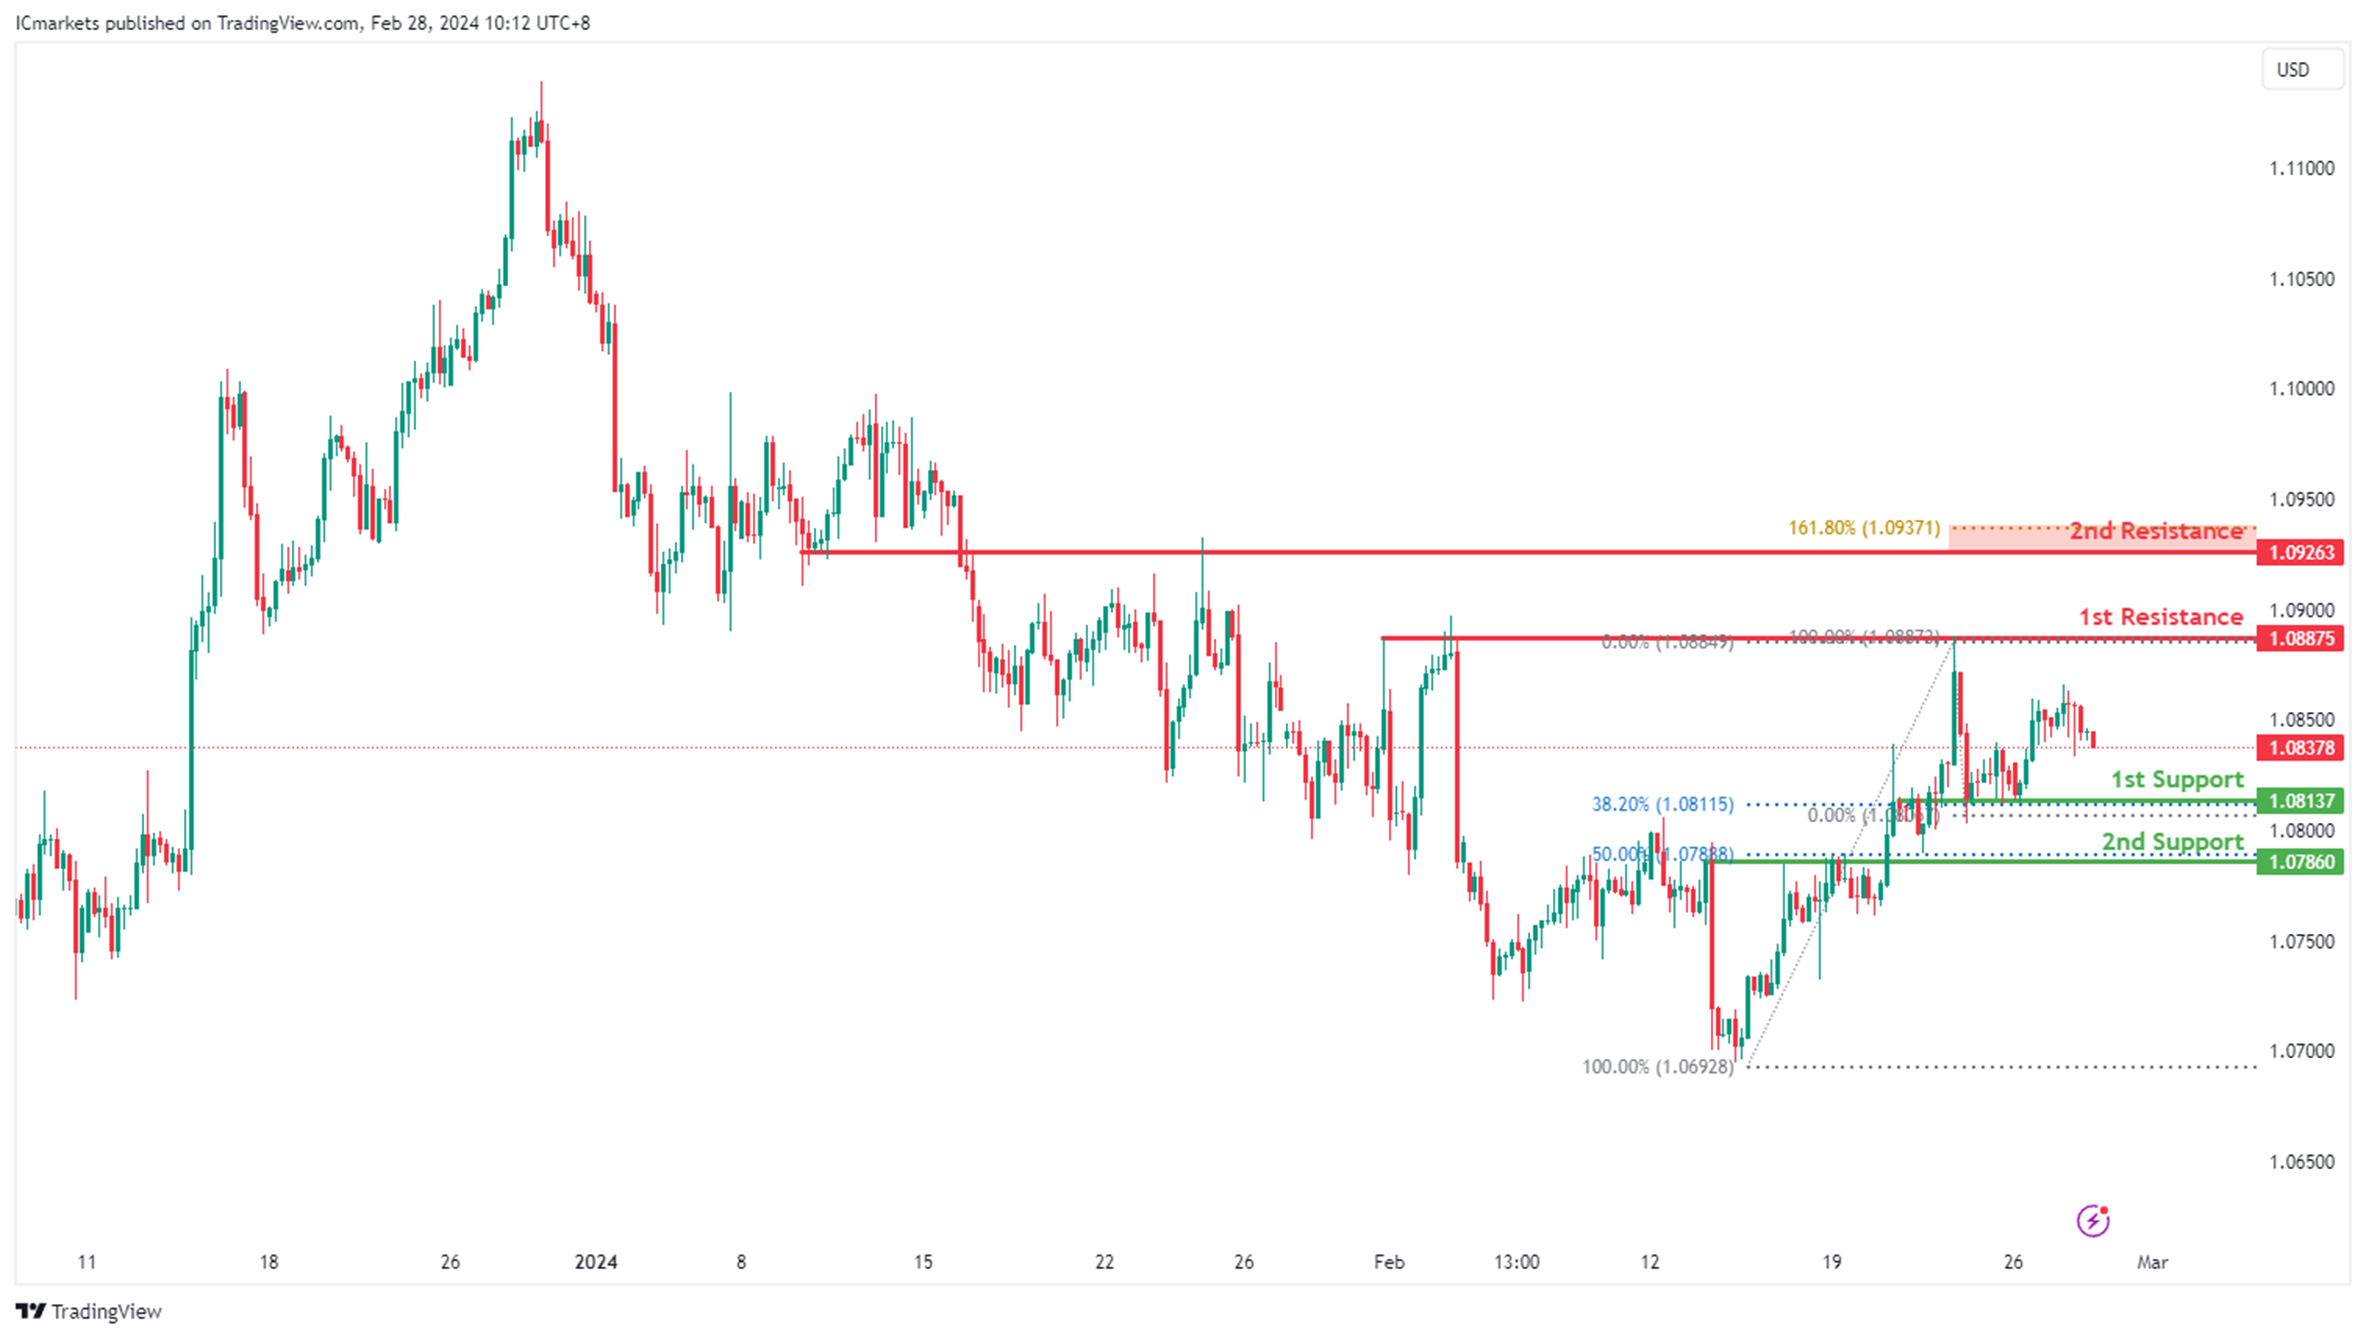
EUR/USD:
The EUR/USD chart currently exhibits an overall bullish momentum. However, there is a potential scenario for price to fall towards the 1st support before resuming the uptrend.
The 1st support level at 1.0813 is identified as an overlap support that aligns with the 38.20% Fibonacci Retracement level. Further below, the 2nd support level at 1.0786 is marked as a pullback support that aligns with the 50.00% Fibonacci Retracement level, further emphasizing its importance as a potential support zone.
To the upside, the 1st resistance level at 1.0887 is identified as a pullback resistance. Higher up, the 2nd resistance level at 1.0926 is noted as an overlap resistance that aligns close to the 161.80% Fibonacci Extension level, further highlighting its importance as a potential resistance point.
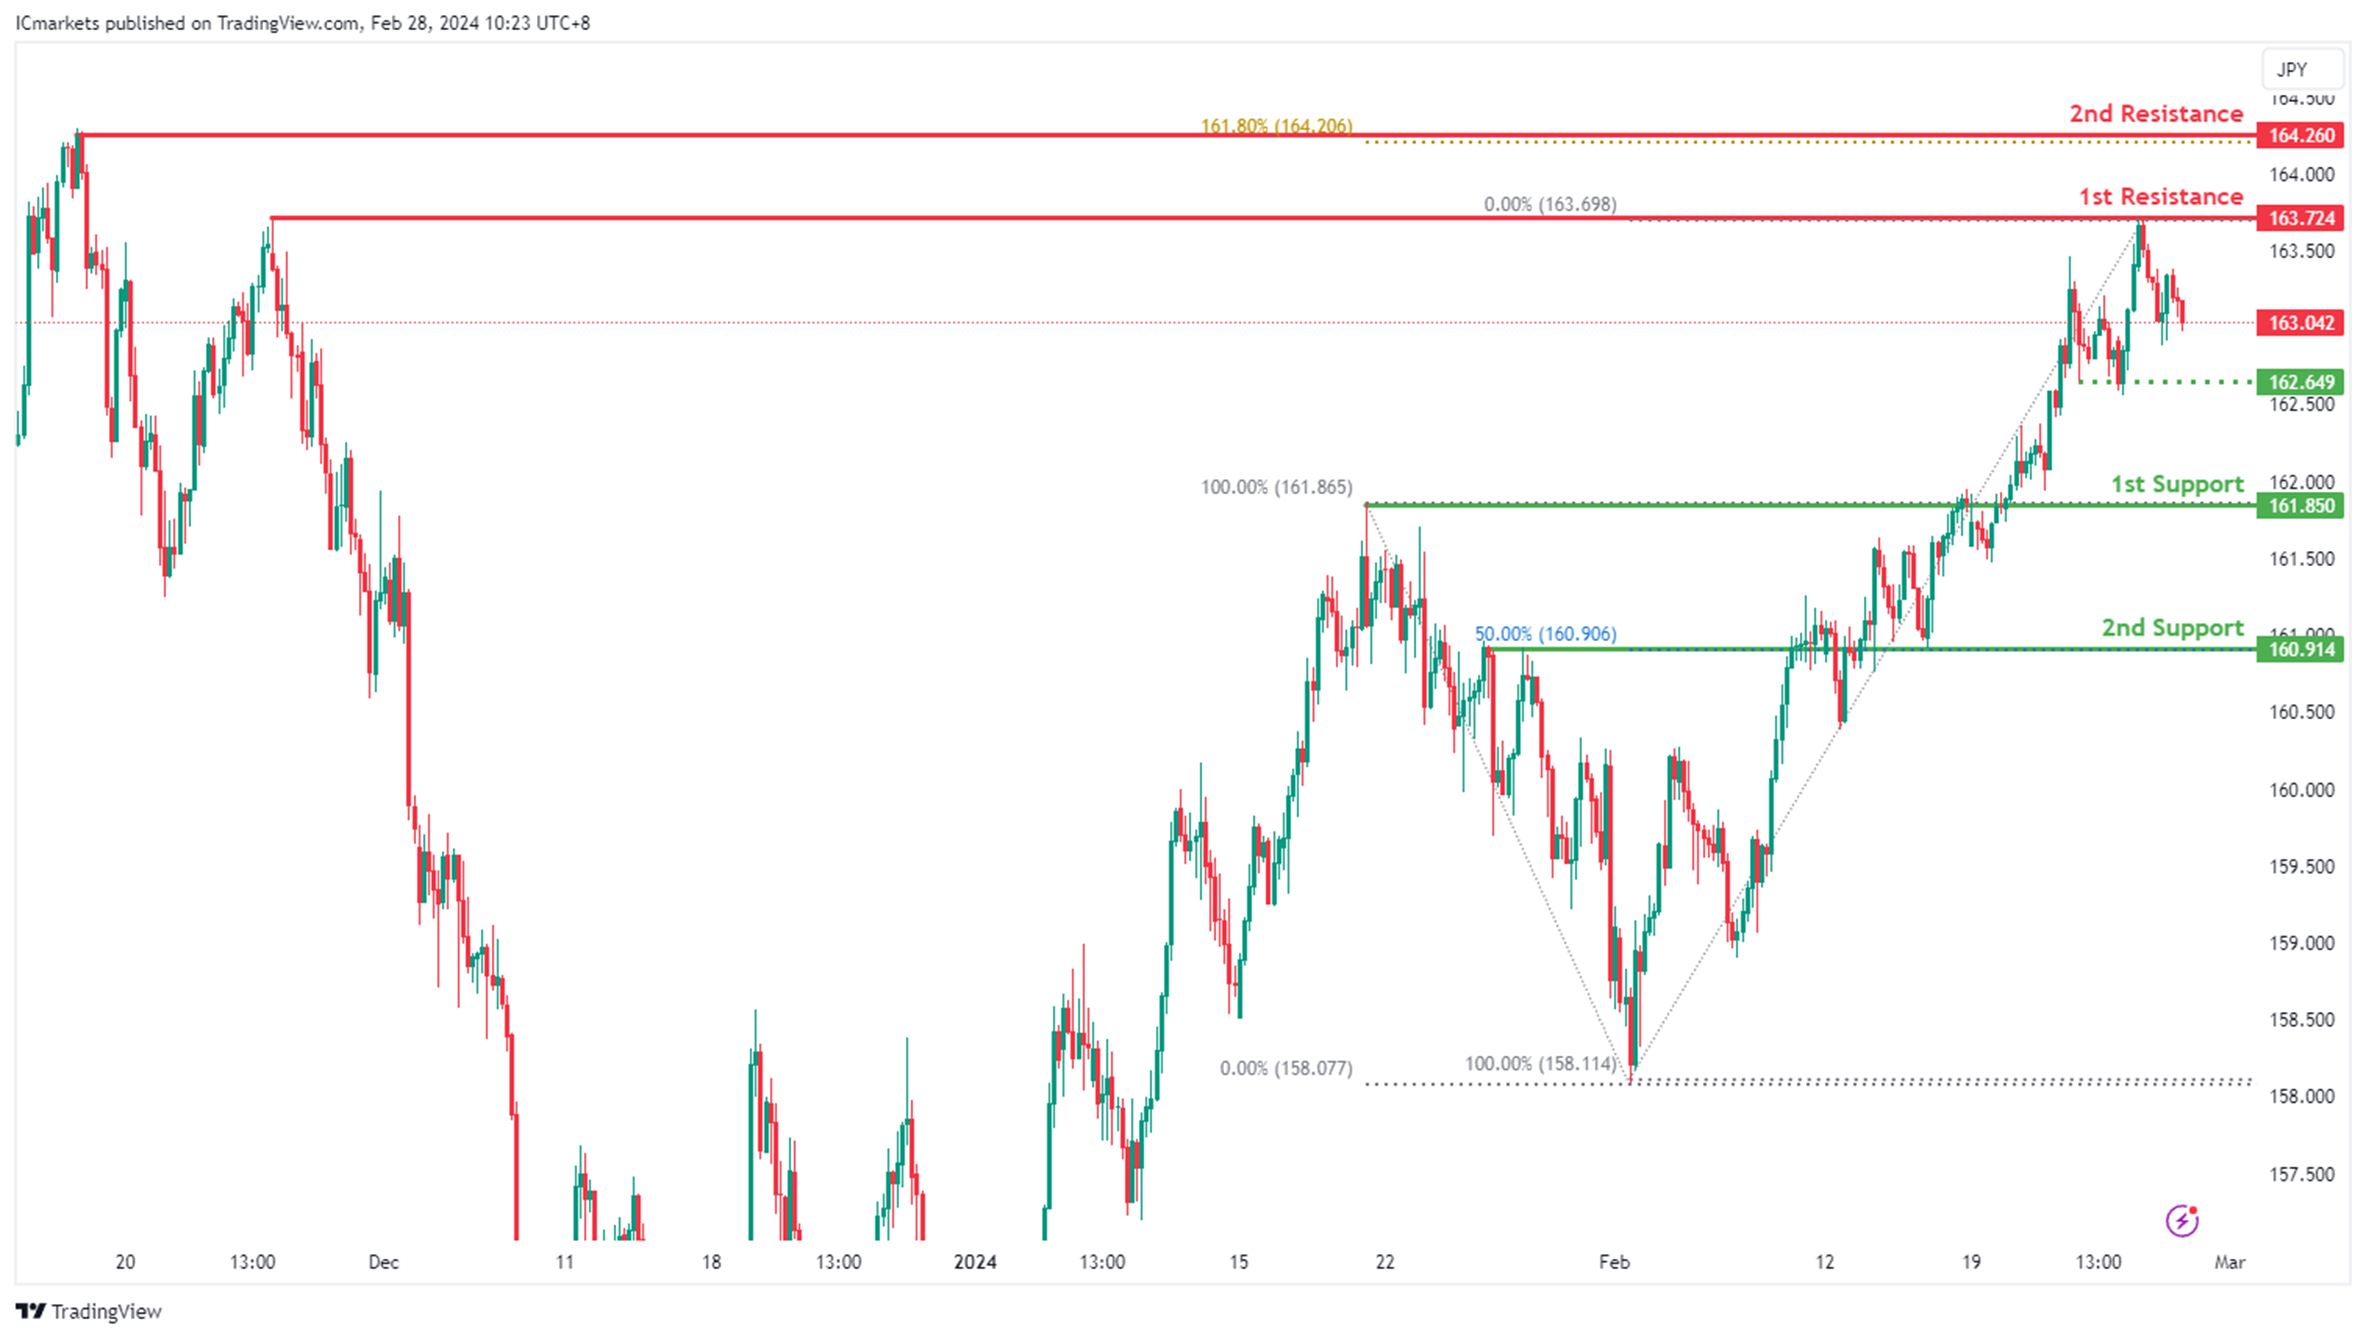
EUR/JPY:
The EUR/JPY chart currently exhibits an overall bullish momentum. However, there is a potential scenario for price to fall towards the intermediate support before resuming the uptrend.
The intermediate support level at 162.64 is identified as a pullback support while the 1st support level at 161.85 is also noted as a pullback support. Further below, the 2nd support level at 160.91 is marked as an overlap support that aligns with the 50.00% Fibonacci Retracement level, further emphasizing its importance as a potential support zone.
To the upside, the 1st resistance level at 163.72 is identified as a swing-high resistance. Higher up, the 2nd resistance level at 164.26 is also noted as a swing-high resistance that aligns with the 161.80% Fibonacci Extension level, further highlighting its importance as a potential resistance point.
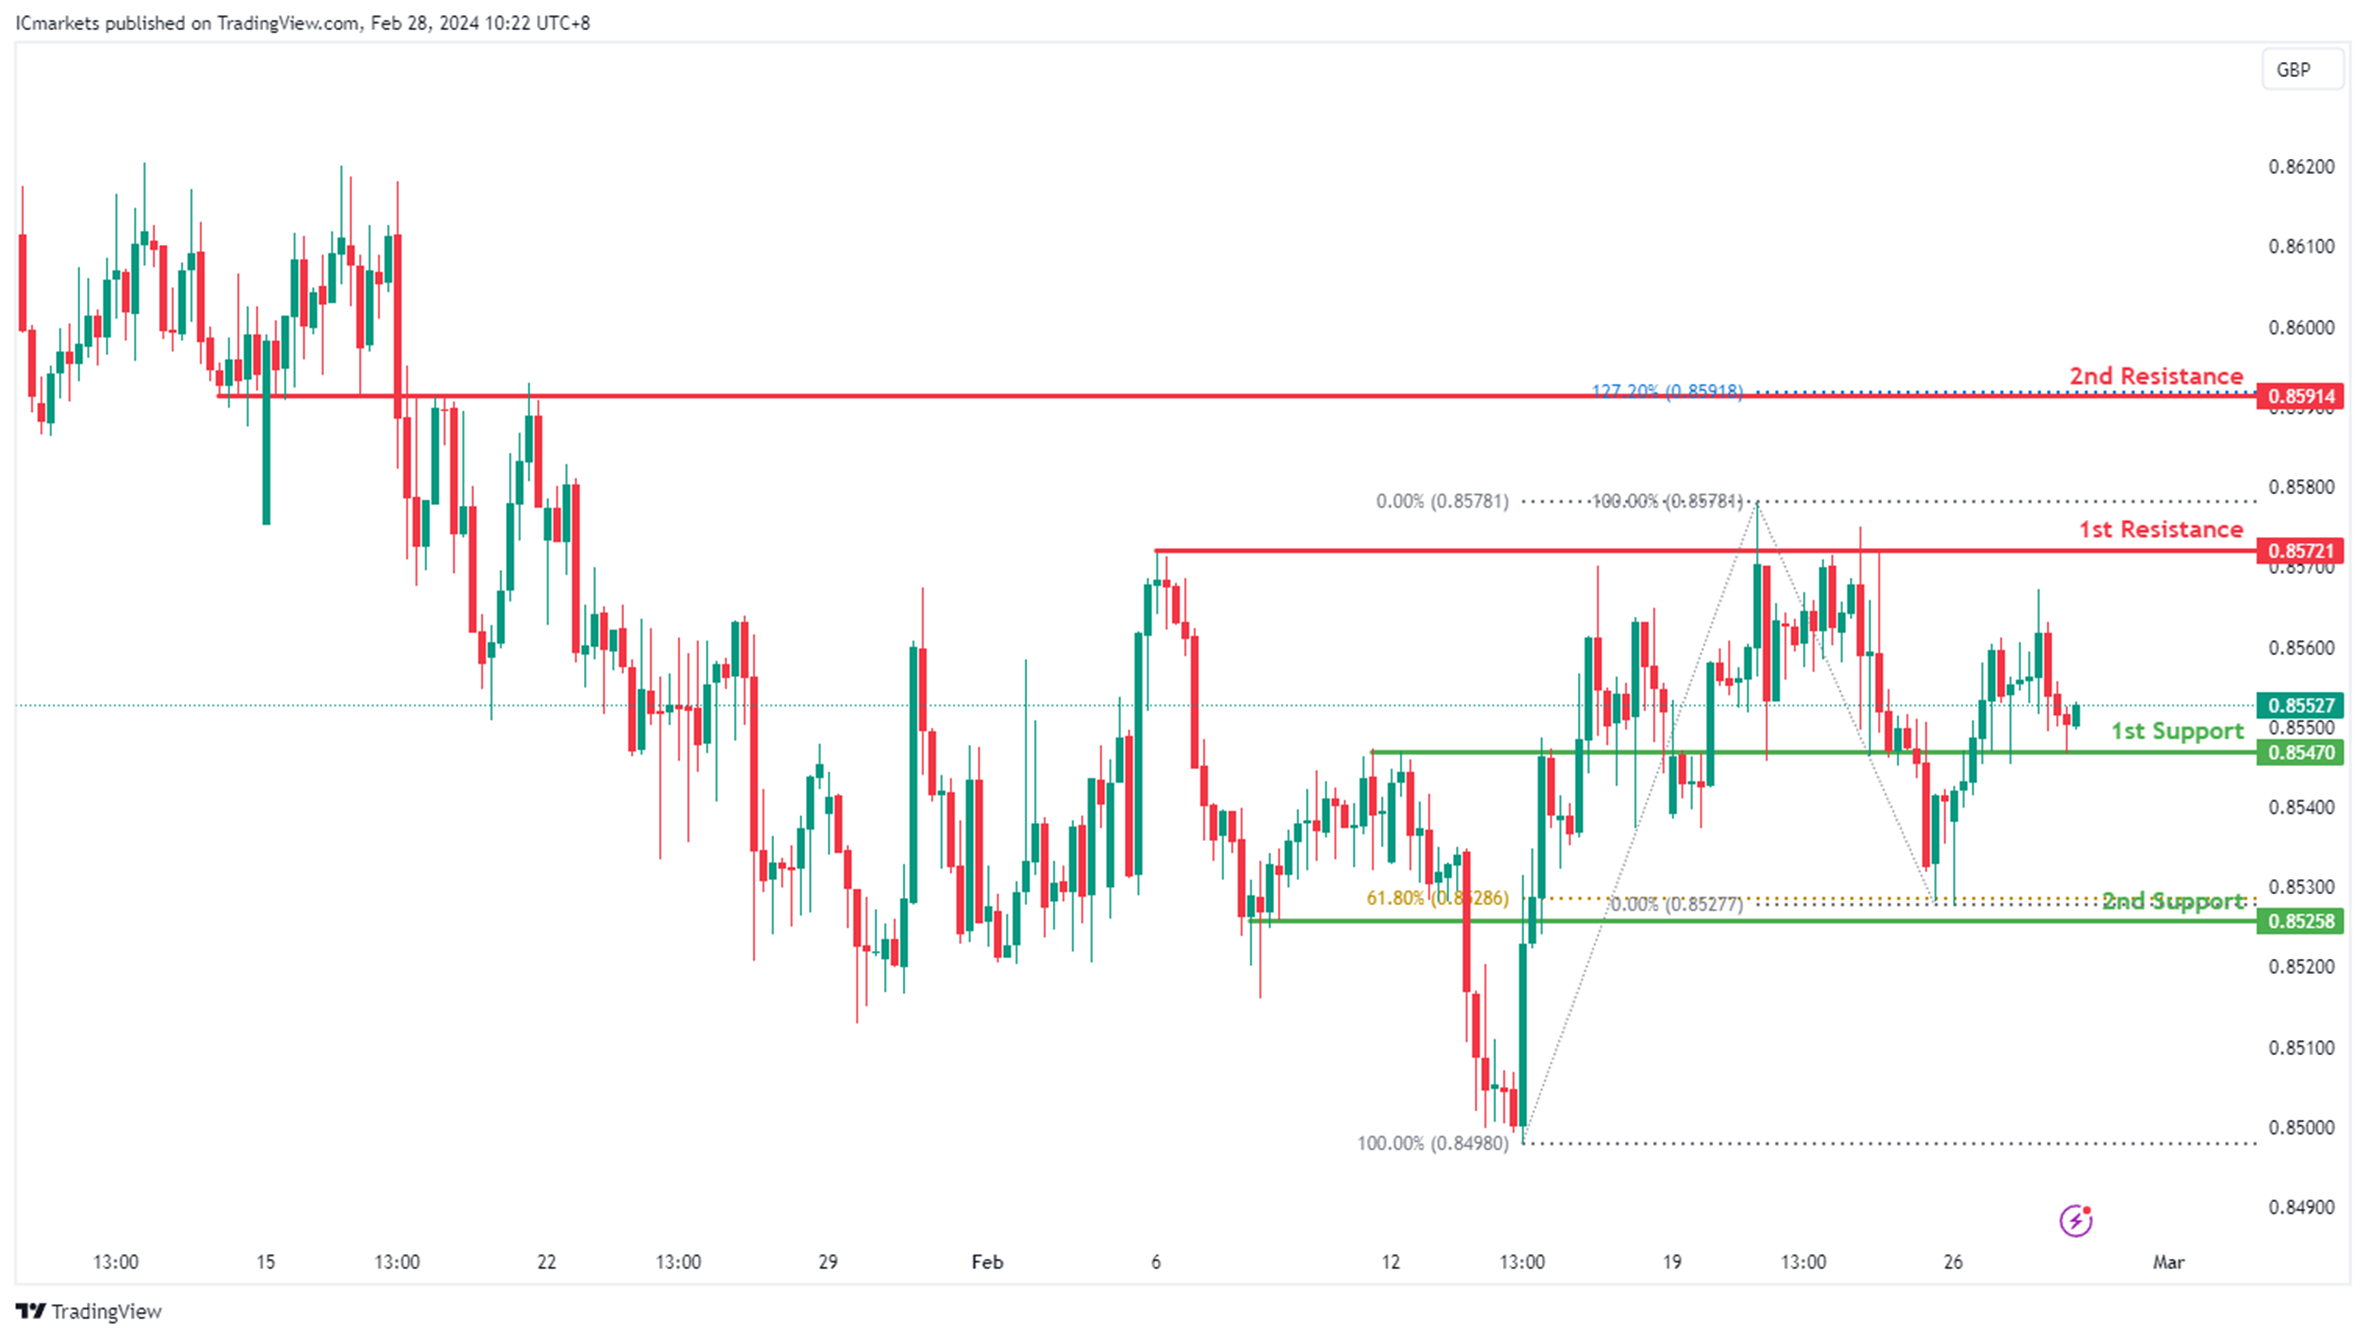
EUR/GBP:
The EUR/GBP chart currently exhibits a neutral bias. In this context, there is a potential scenario for price to fluctuate between the 1st support and the 1st resistance.
The 1st support level at 0.8547 is identified as an overlap support. Further below, the 2nd support level at 0.8525 is marked as a pullback support that aligns with the 61.80% Fibonacci Retracement level, further emphasizing its importance as a potential support zone.
To the upside, the 1st resistance level at 0.8572 is identified as a pullback resistance. Higher up, the 2nd resistance level at 0.8591 is noted as an overlap resistance that aligns with the 127.20% Fibonacci Extension level, further highlighting its importance as a potential resistance point.
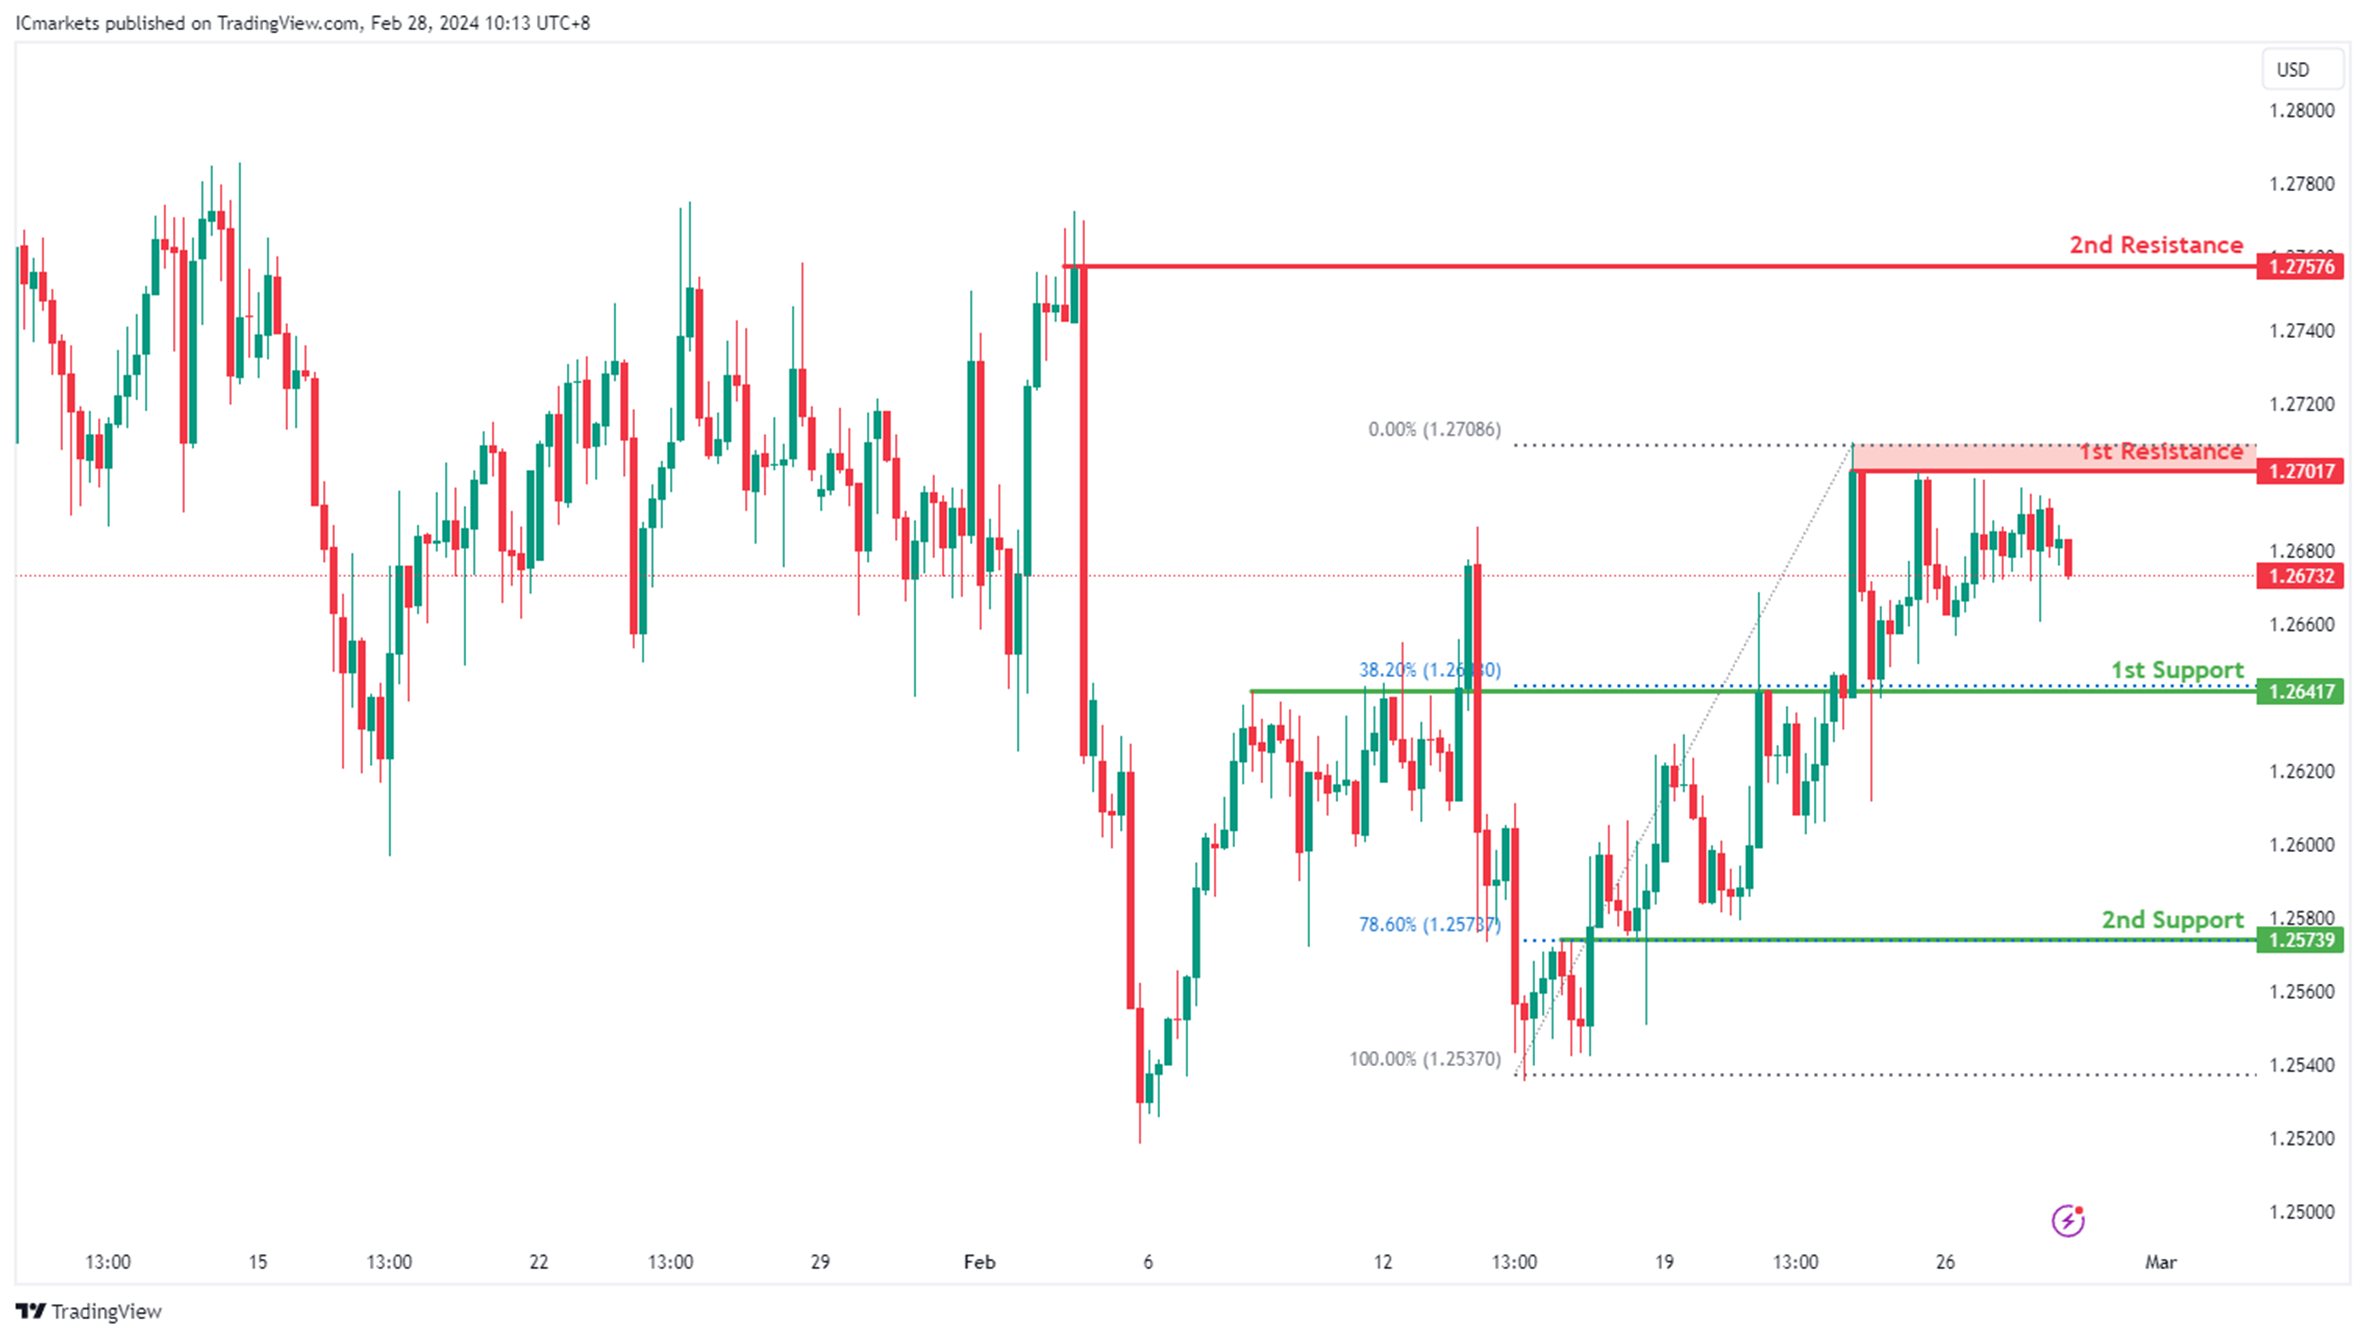
GBP/USD:
The GBP/USD chart currently exhibits an overall bullish momentum. However, there is a potential scenario for price to fall towards the 1st support before resuming the uptrend.
The 1st support level at 1.2641 is identified as an overlap support that aligns with the 38.20% Fibonacci Retracement level. Further below, the 2nd support level at 1.2573 is also marked as an overlap support that aligns with the 78.60% Fibonacci Retracement level, further emphasizing its importance as a potential support zone.
To the upside, the 1st resistance level at 1.2701 is identified as a pullback resistance. Higher up, the 2nd resistance level at 1.2757 is also noted as a pullback resistance, further highlighting its importance as a potential resistance point.
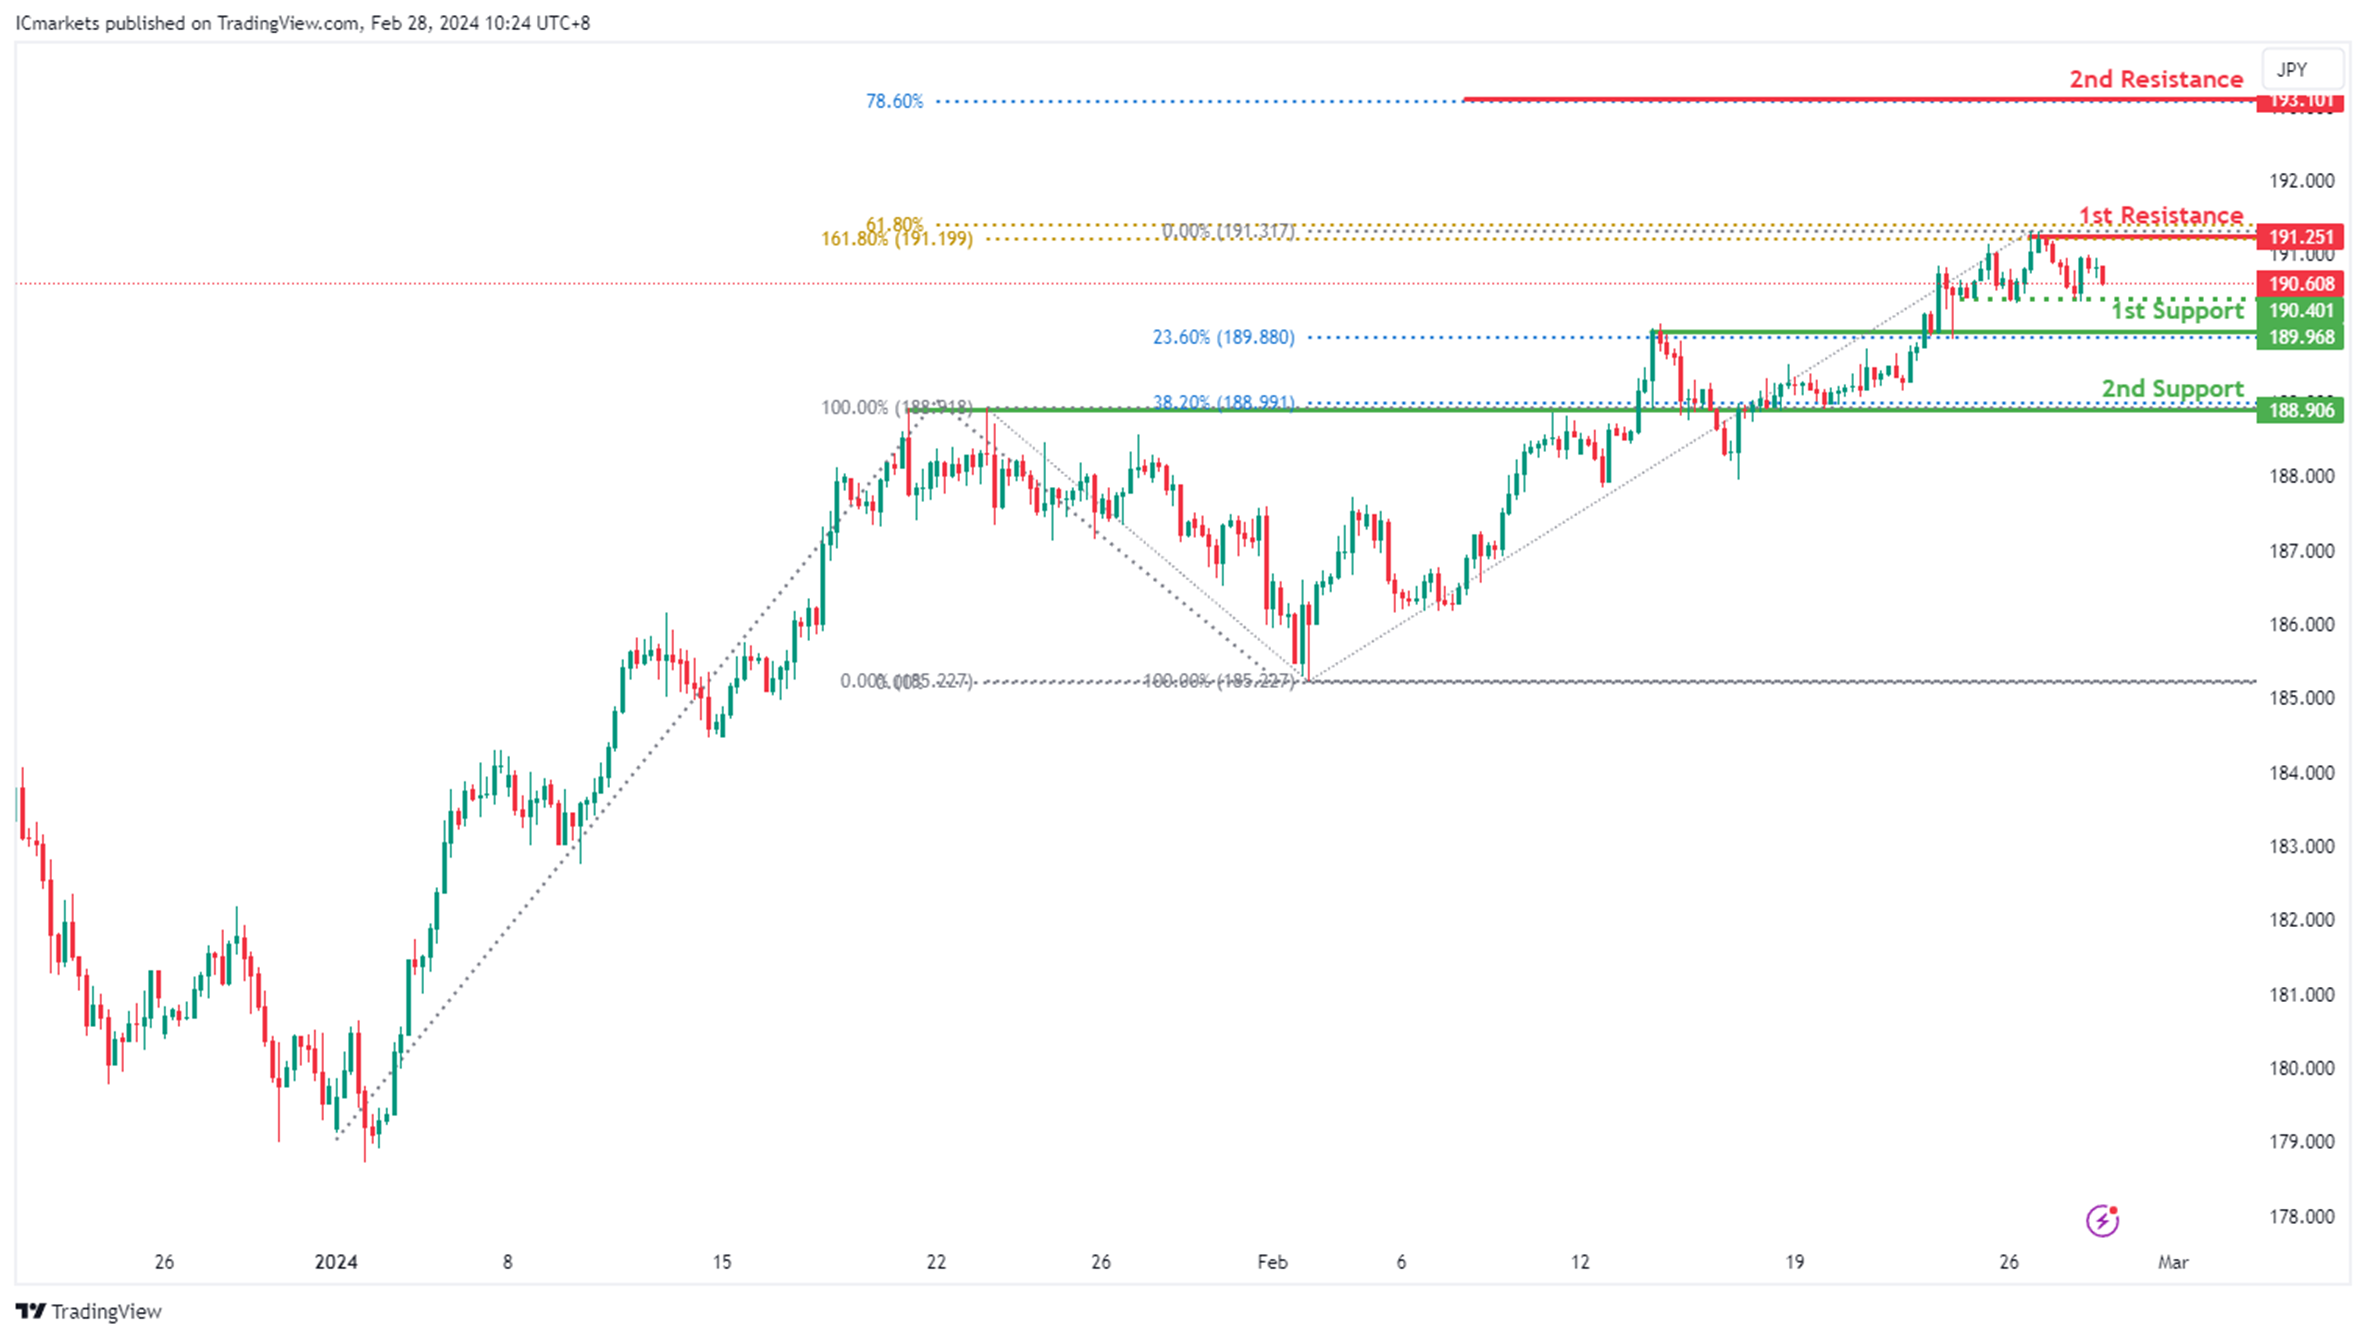
GBP/JPY:
The GBP/JPY chart currently exhibits an overall bullish momentum. However, there is a potential scenario for price to fall towards the intermediate support before resuming the uptrend.
The intermediate support level at 190.40 is identified as a pullback support while the 1st support level at 189.96 is noted as an overlap support that aligns with the 23.60% Fibonacci Retracement level. Further below, the 2nd support level at 188.90 is also marked as an overlap support that aligns with the 38.20% Fibonacci Retracement level, further emphasizing its importance as a potential support zone.
To the upside, the 1st resistance level at 191.25 is identified as a pullback resistance that aligns with a confluence of Fibonacci levels i.e. the 61.80% Projection and the 161.80% Extension. Higher up, the 2nd resistance level at 193.10 is noted as a resistance that aligns with the 78.60% Fibonacci Projection, further highlighting its importance as a potential resistance point.
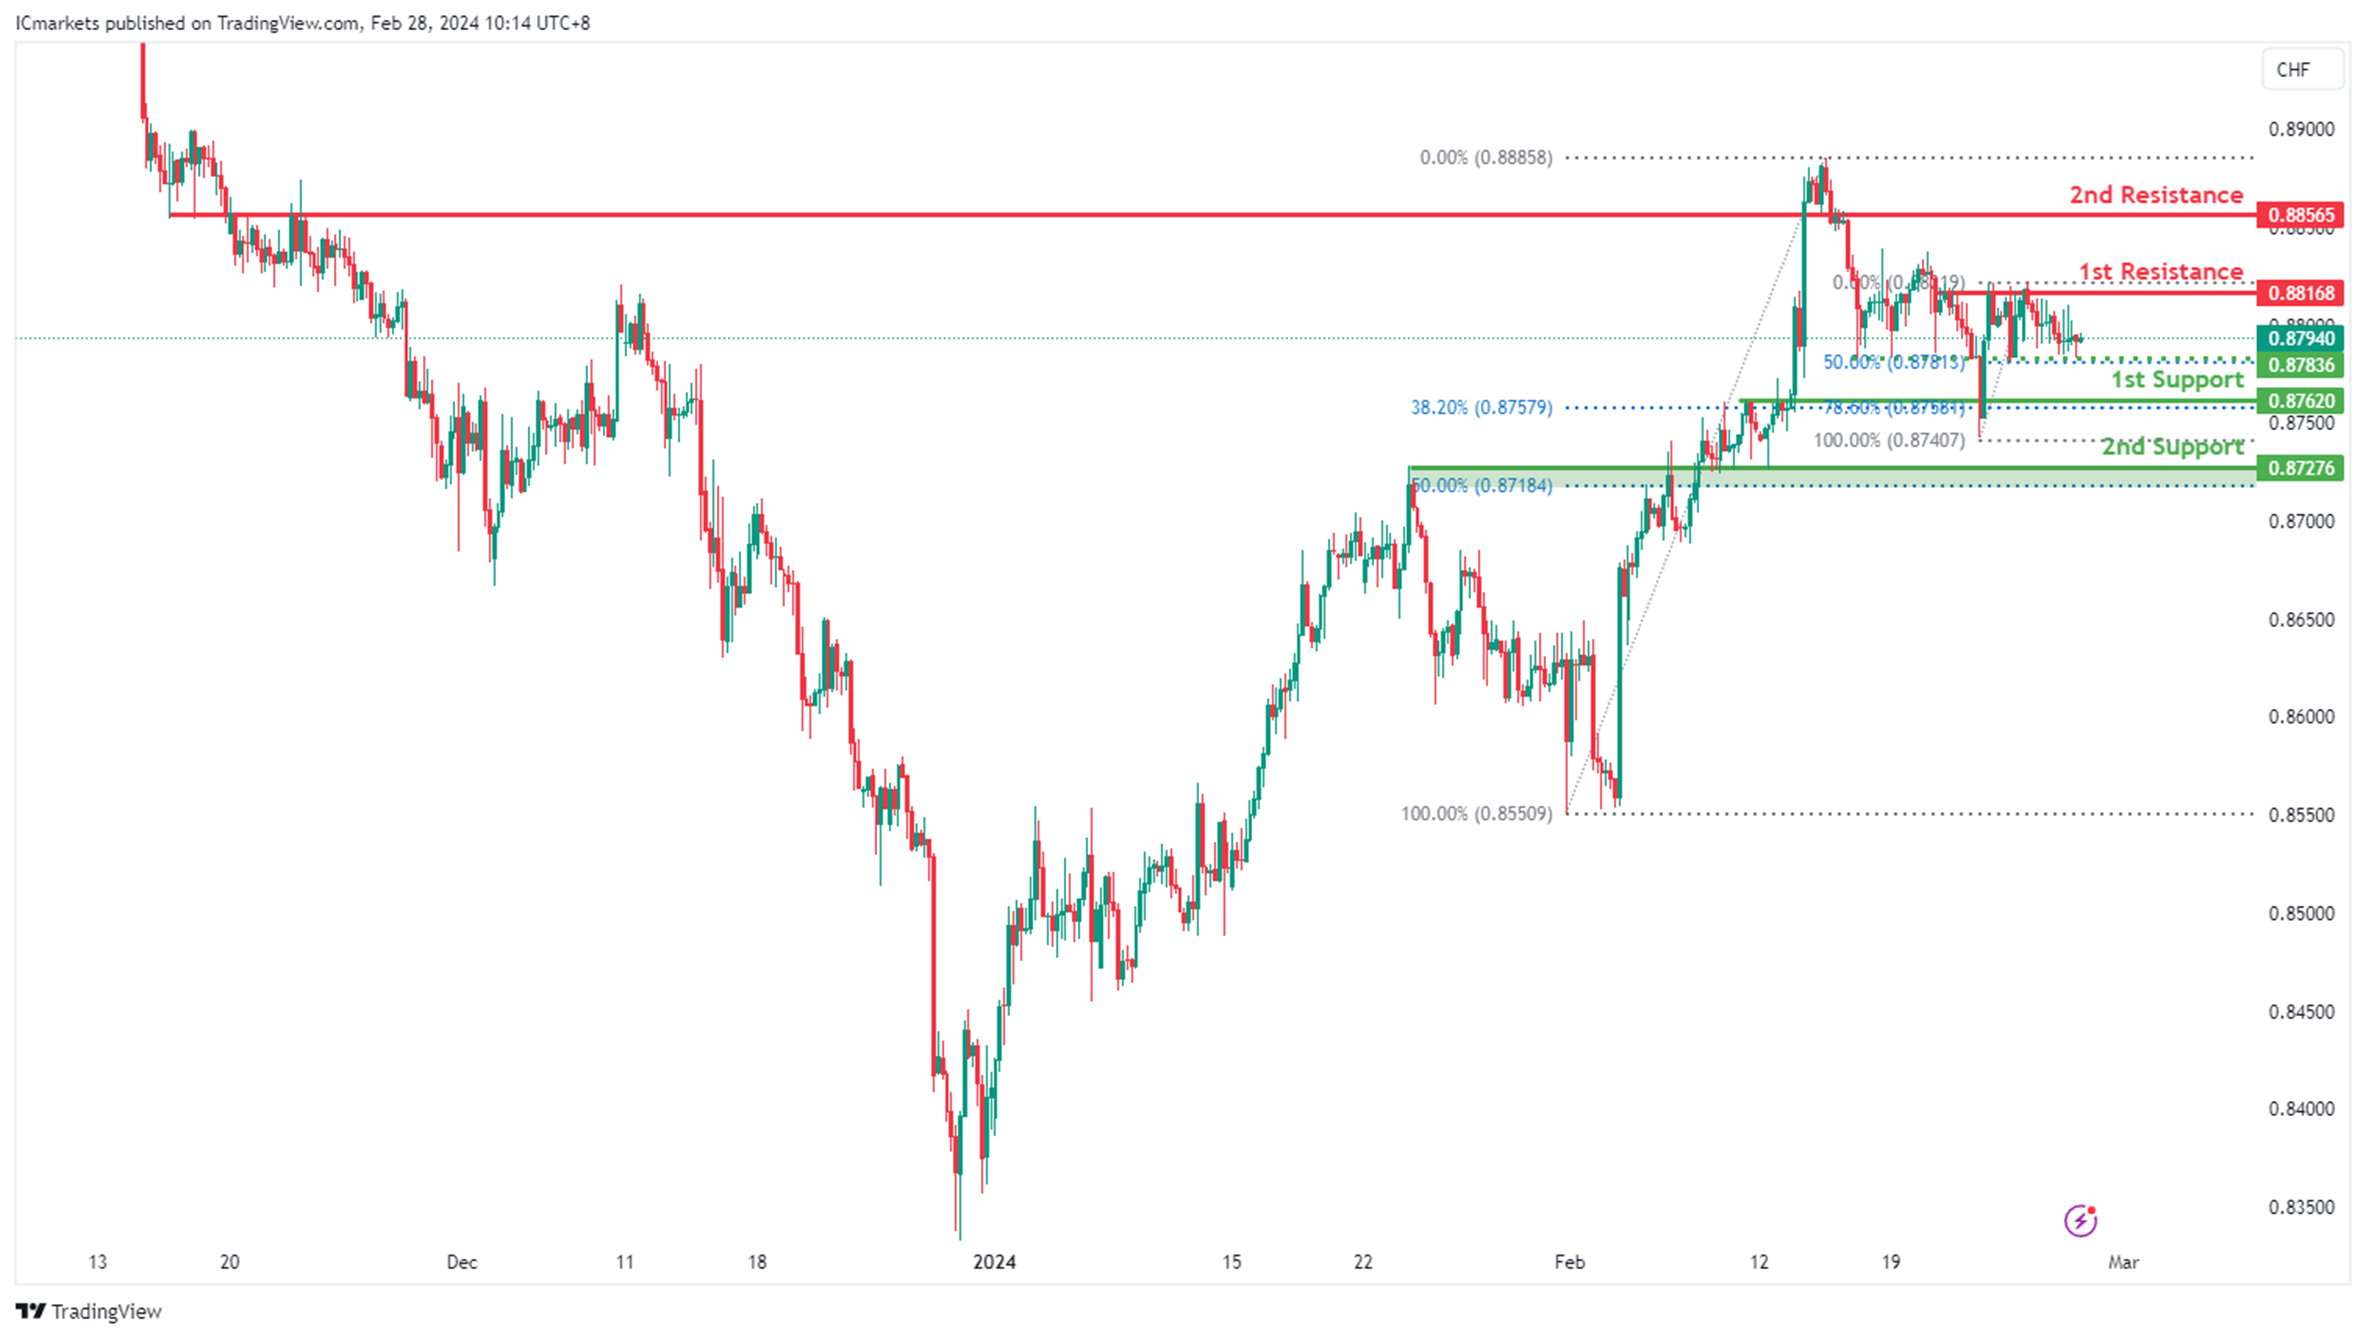
USD/CHF:
The USD/CHF chart currently exhibits a neutral bias. In this context, there is a potential scenario for price to fluctuate between the 1st support and the 1st resistance.
The 1st support level at 0.8762 is identified as an overlap support that aligns with the 38.20% Fibonacci Retracement level. Further below, the 2nd support level at 0.8727 is also marked as an overlap support that aligns close to the 50.00% Fibonacci Retracement level, further emphasizing its importance as a potential support zone.
To the upside, the 1st resistance level at 0.8816 is identified as a pullback resistance. Higher up, the 2nd resistance level at 0.8856 is noted as an overlap resistance, further highlighting its importance as a potential resistance point.
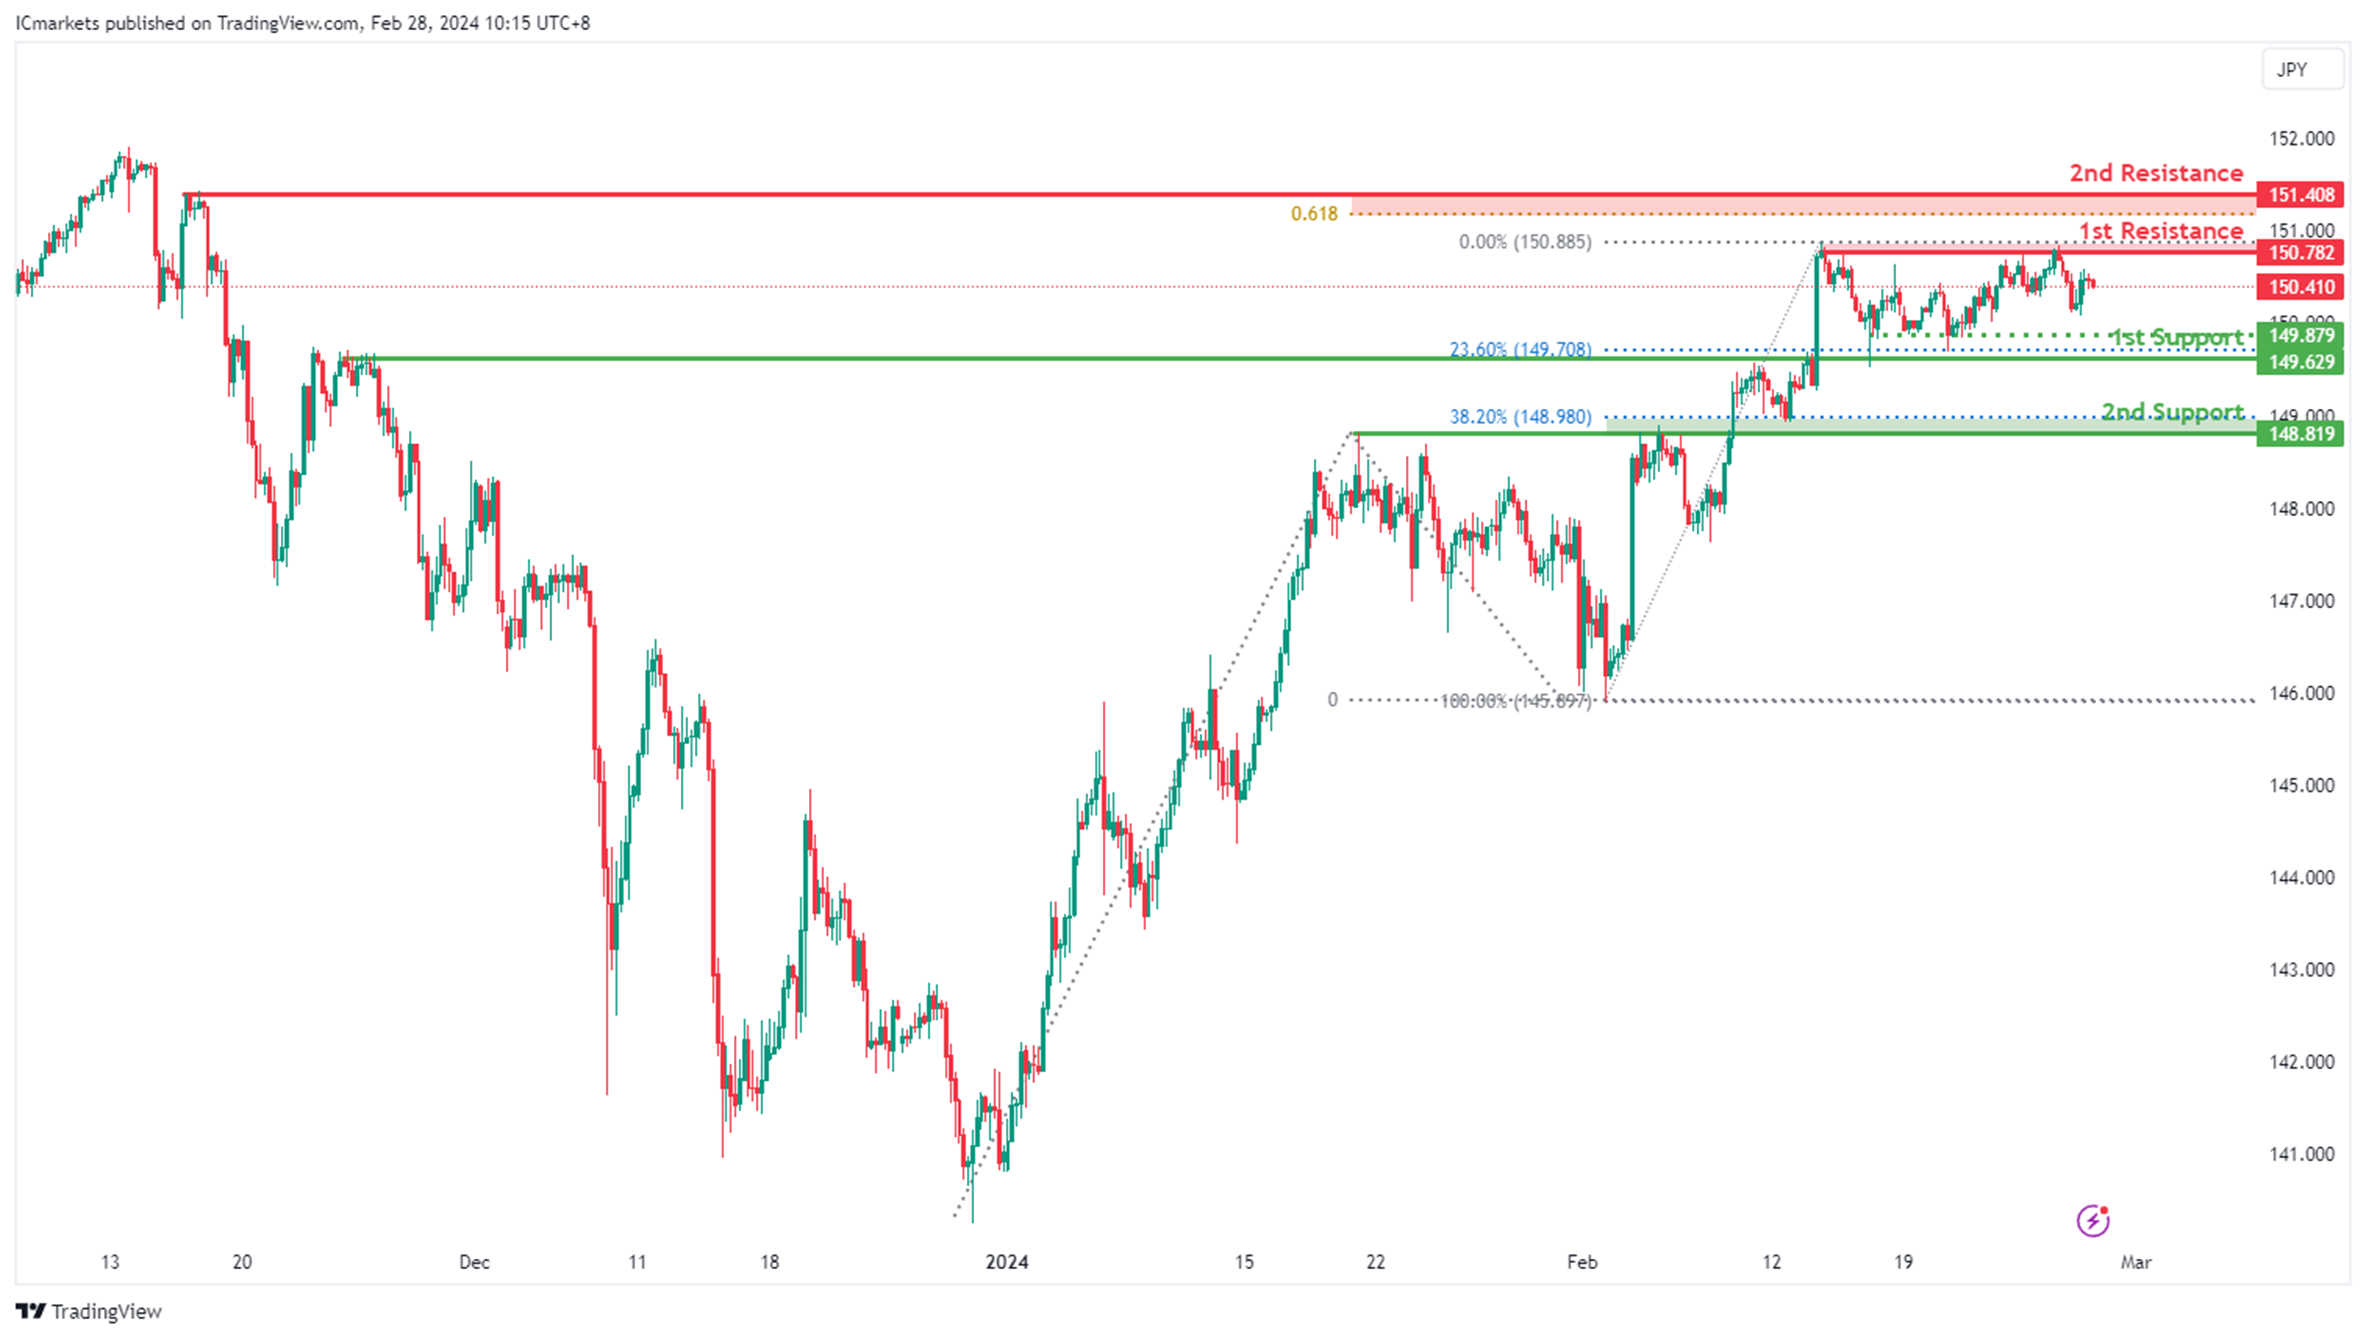
USD/JPY:
The USD/JPY chart currently exhibits a neutral bias. In this context, there is a potential scenario for price to fluctuate between the 1st support and the 1st resistance.
The 1st support level at 149.62 is identified as an overlap support that aligns with the 23.60% Fibonacci Retracement level. Further below, the 2nd support level at 148.81 is also marked as an overlap support that aligns close to the 38.20% Fibonacci Retracement level, further emphasizing its importance as a potential support zone.
To the upside, the 1st resistance level at 150.78 is identified as a pullback resistance. Higher up, the 2nd resistance level at 151.40 is also noted as a pullback resistance that aligns close to the 61.80% Fibonacci Projection level, further highlighting its importance as a potential resistance point.
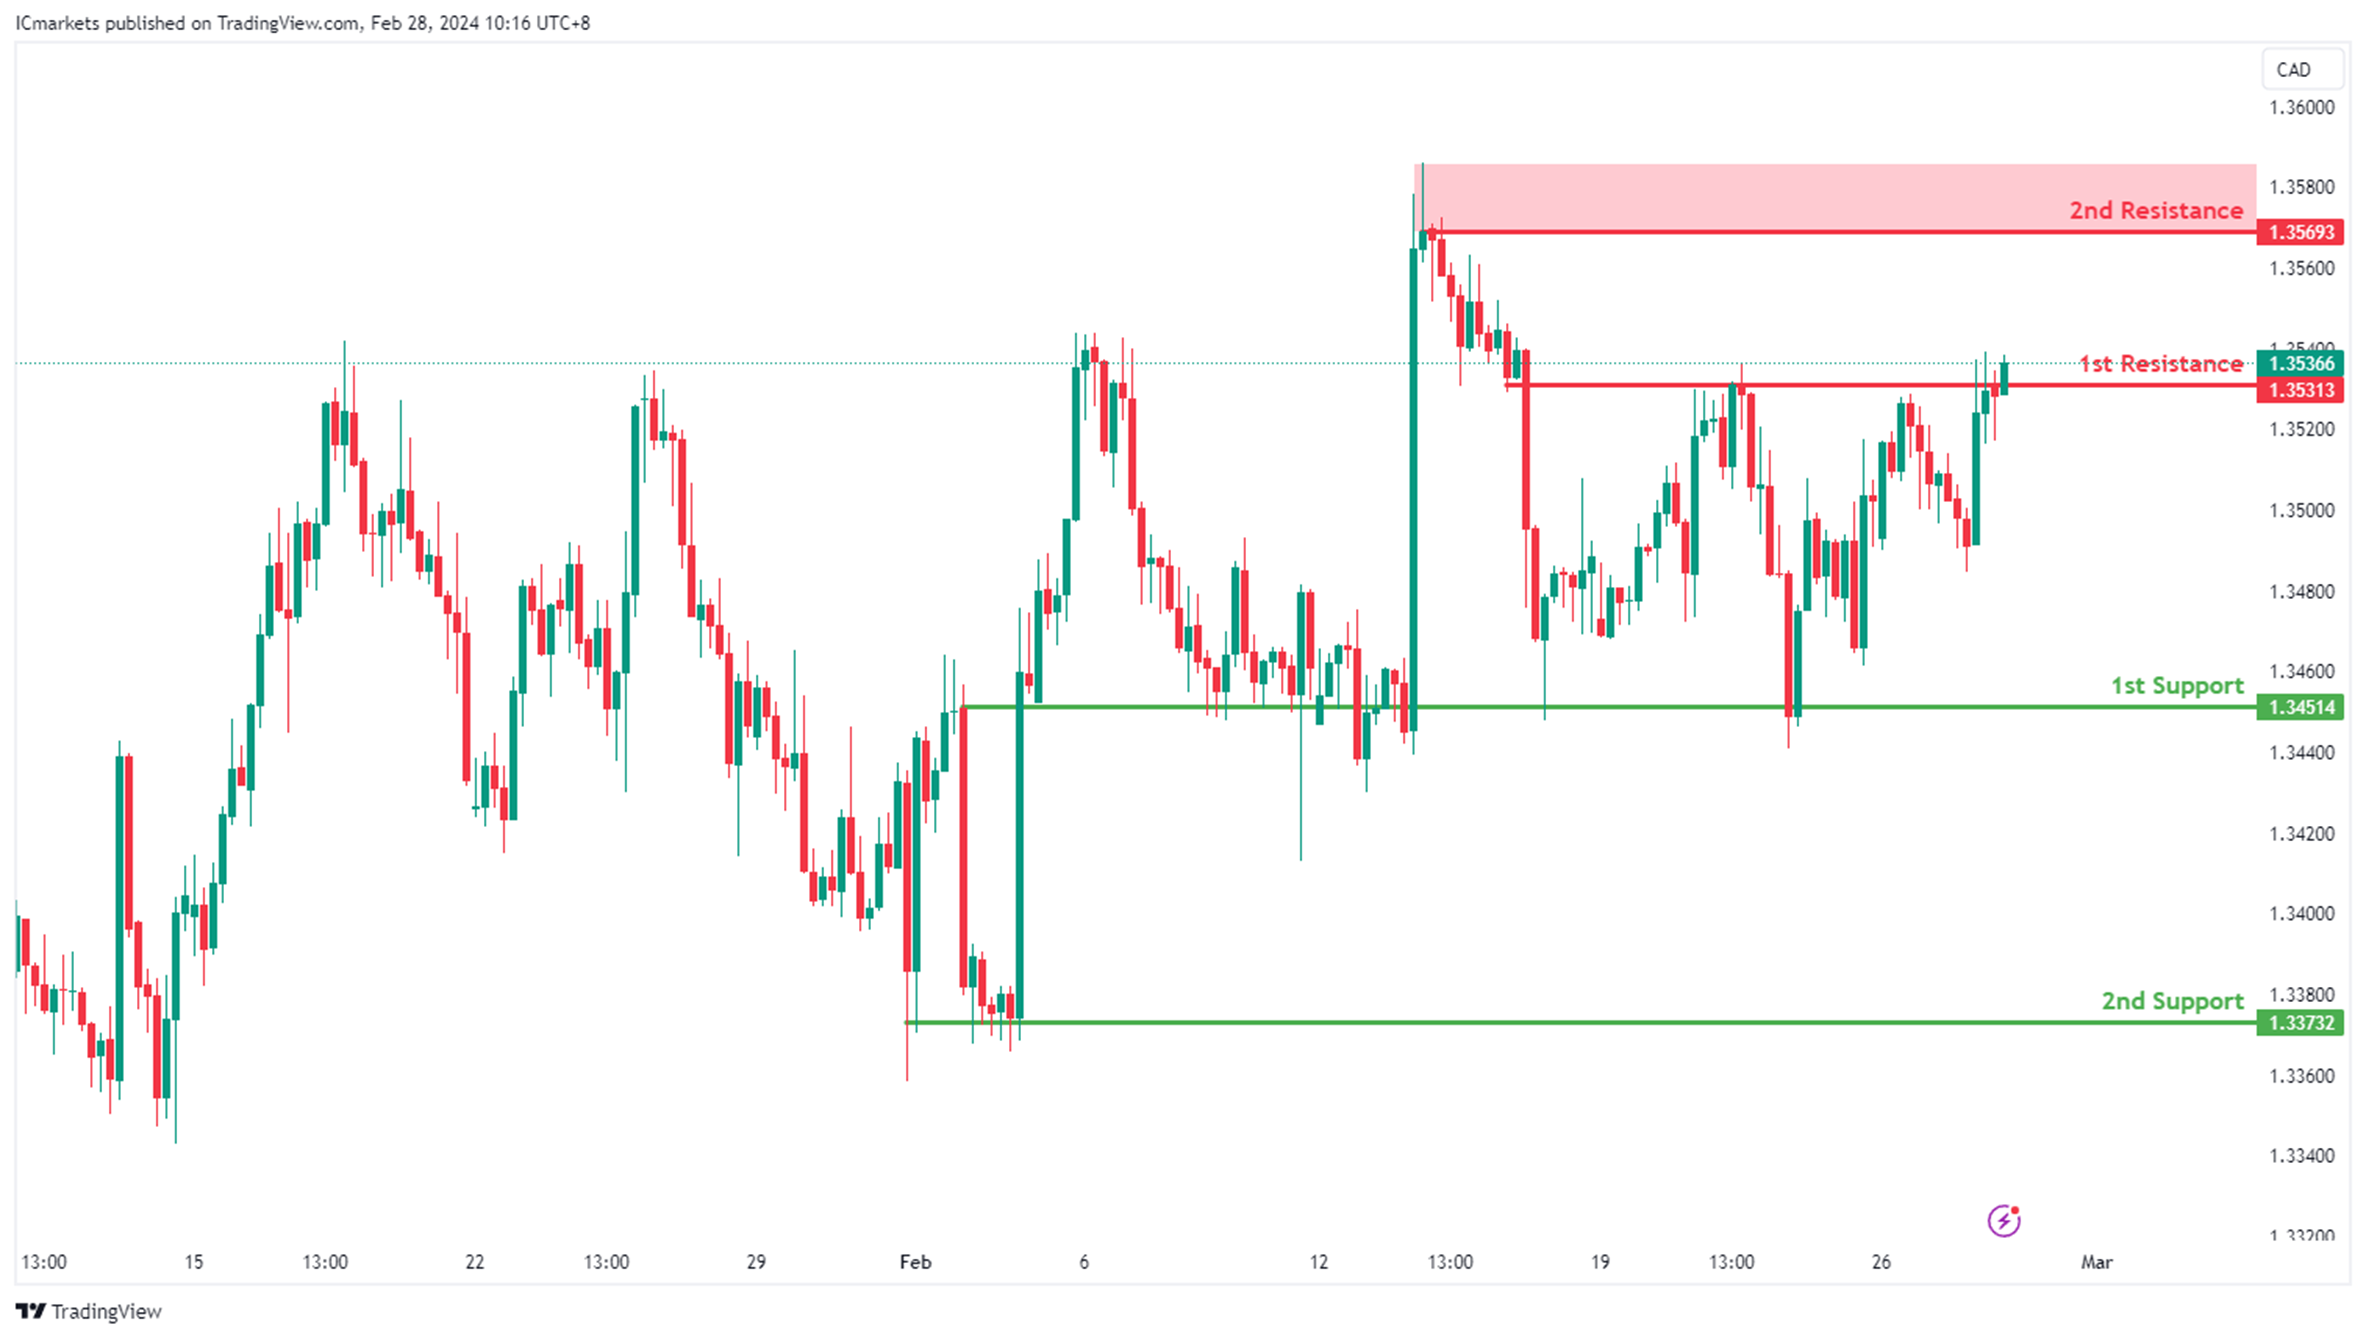
USD/CAD:
The USD/CAD chart currently exhibits an overall bullish momentum. In this context, there is a potential scenario for price to break above the 1st resistance and rise towards the 2nd resistance.
The 1st resistance level at 1.3531 is identified as an overlap resistance. Higher up, the 2nd resistance level at 1.3569 is marked as a pullback resistance, further highlighting its importance as a potential resistance zone.
To the downside, the 1st support level at 1.3451 is identified as an overlap support. Further below, the 2nd support level at 1.3373 is marked as a pullback support, reinforcing its significance as a key support level.
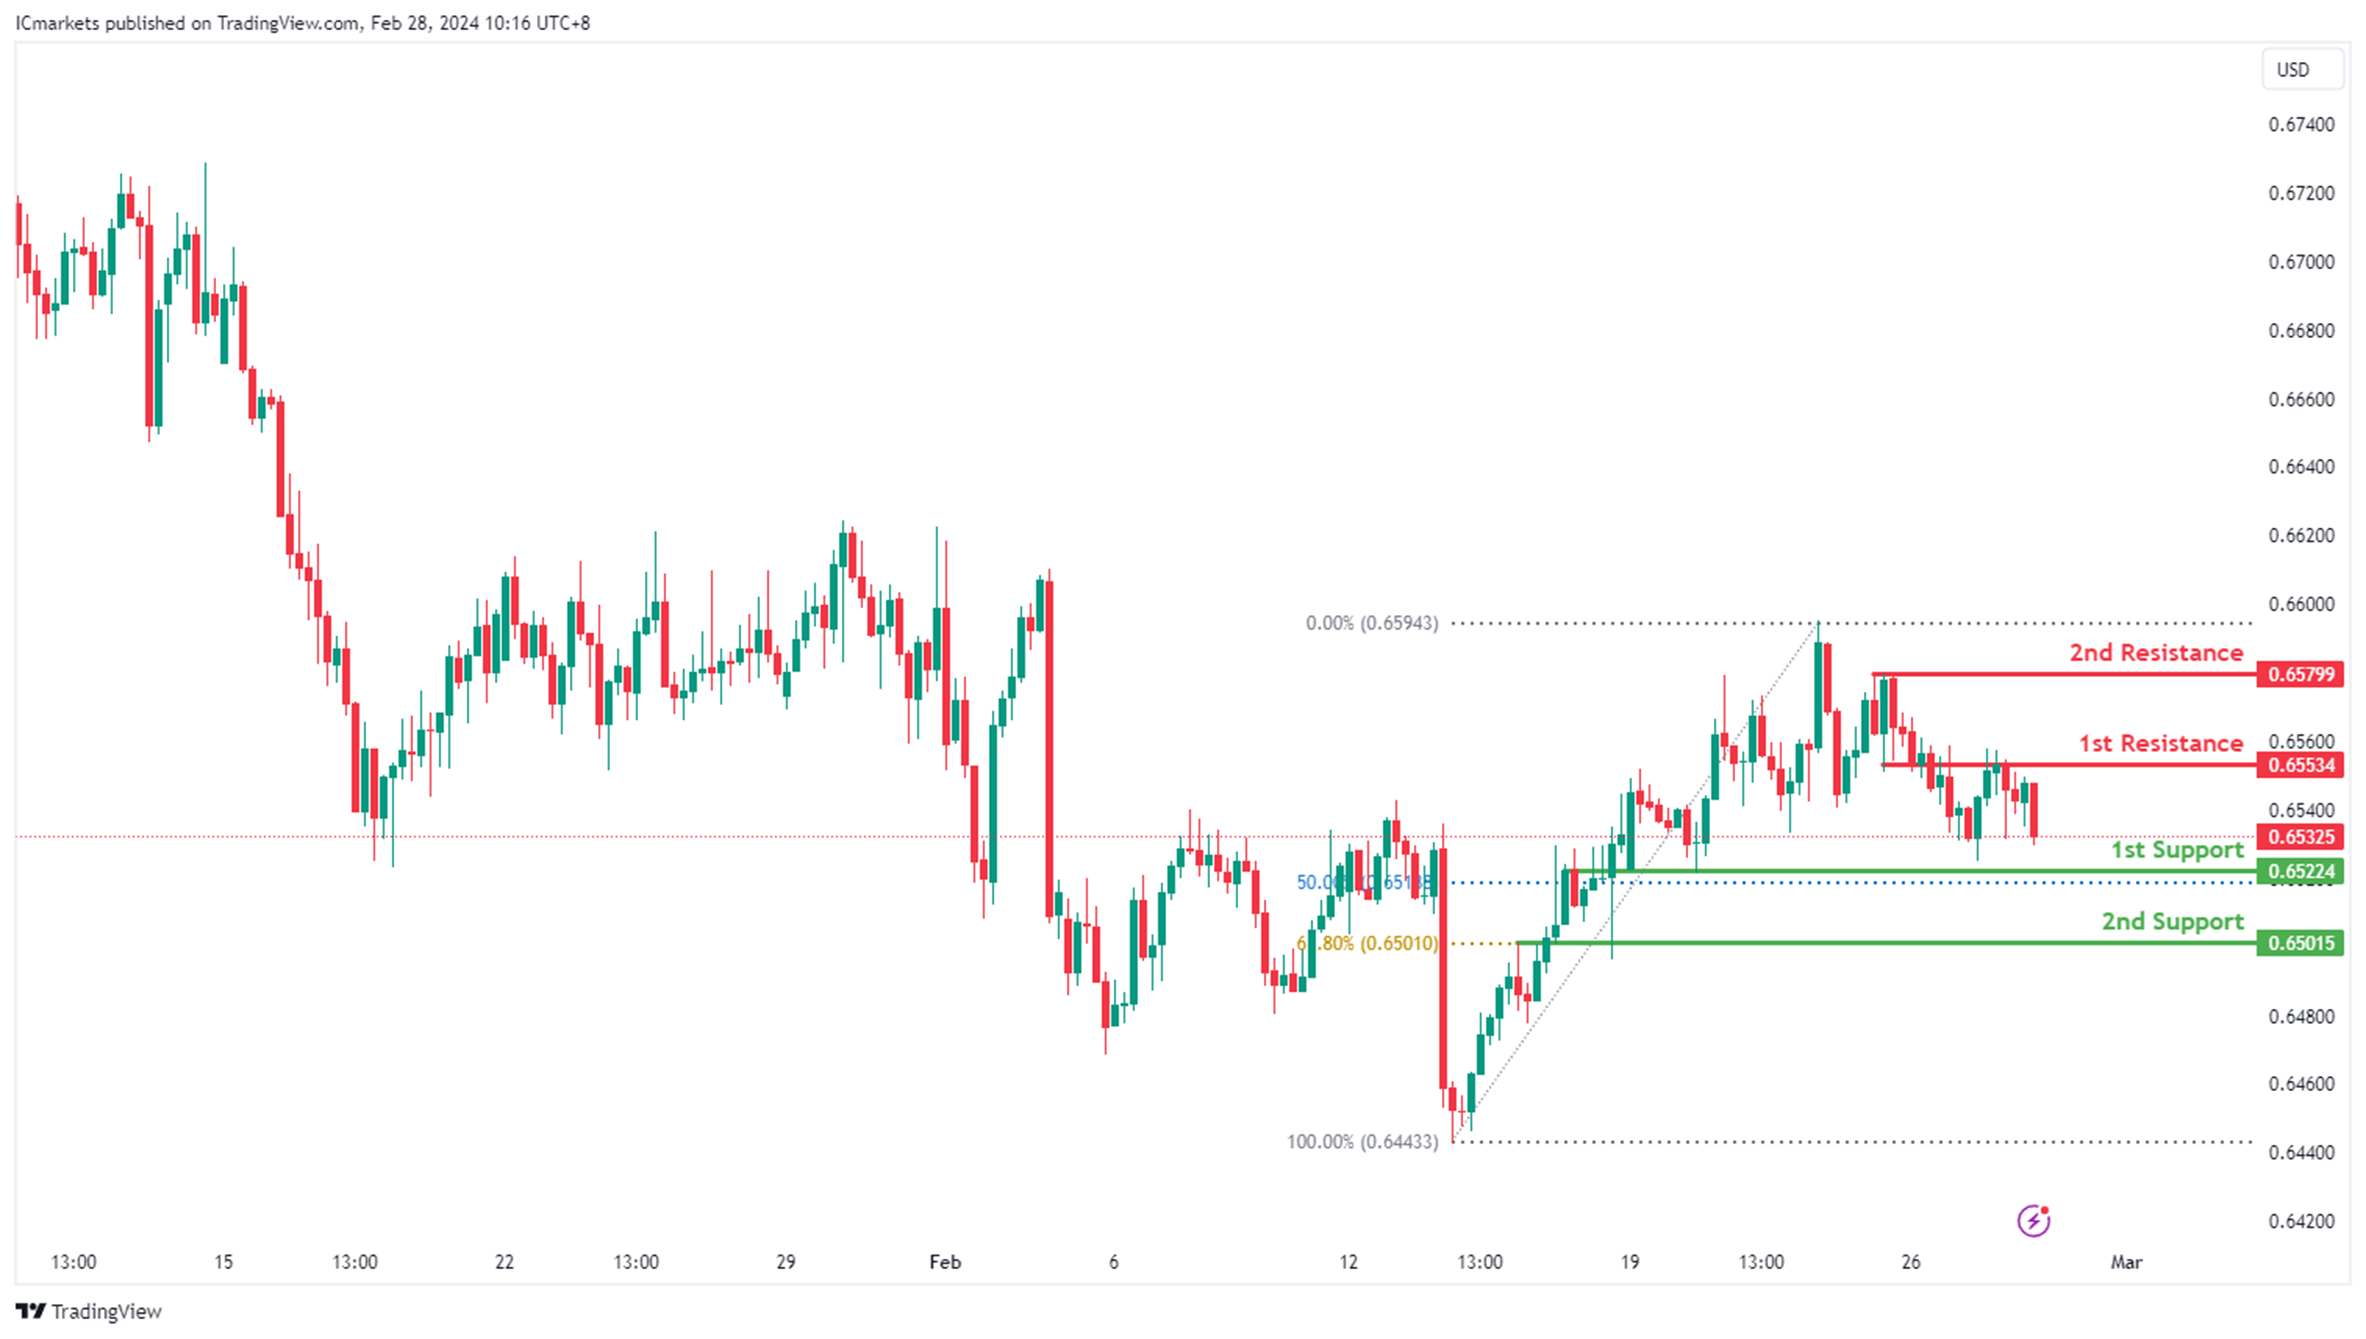
AUD/USD:
The AUD/USD chart currently exhibits an overall bearish momentum. In this context, there is a potential scenario for price to break below the 1st support and drop towards the 2nd support.
The 1st support level at 0.6522 is identified as an overlap support that aligns with the 50.00% Fibonacci Retracement level. Further below, the 2nd support level at 0.6501 is also marked as an overlap support that aligns with the 61.80% Fibonacci Retracement levels, further emphasizing its importance as a potential support zone.
To the upside, the 1st resistance level at 0.6553 is identified as an overlap resistance. Higher up, the 2nd resistance level at 0.6579 is noted as a pullback resistance, further highlighting its importance as a potential resistance point.
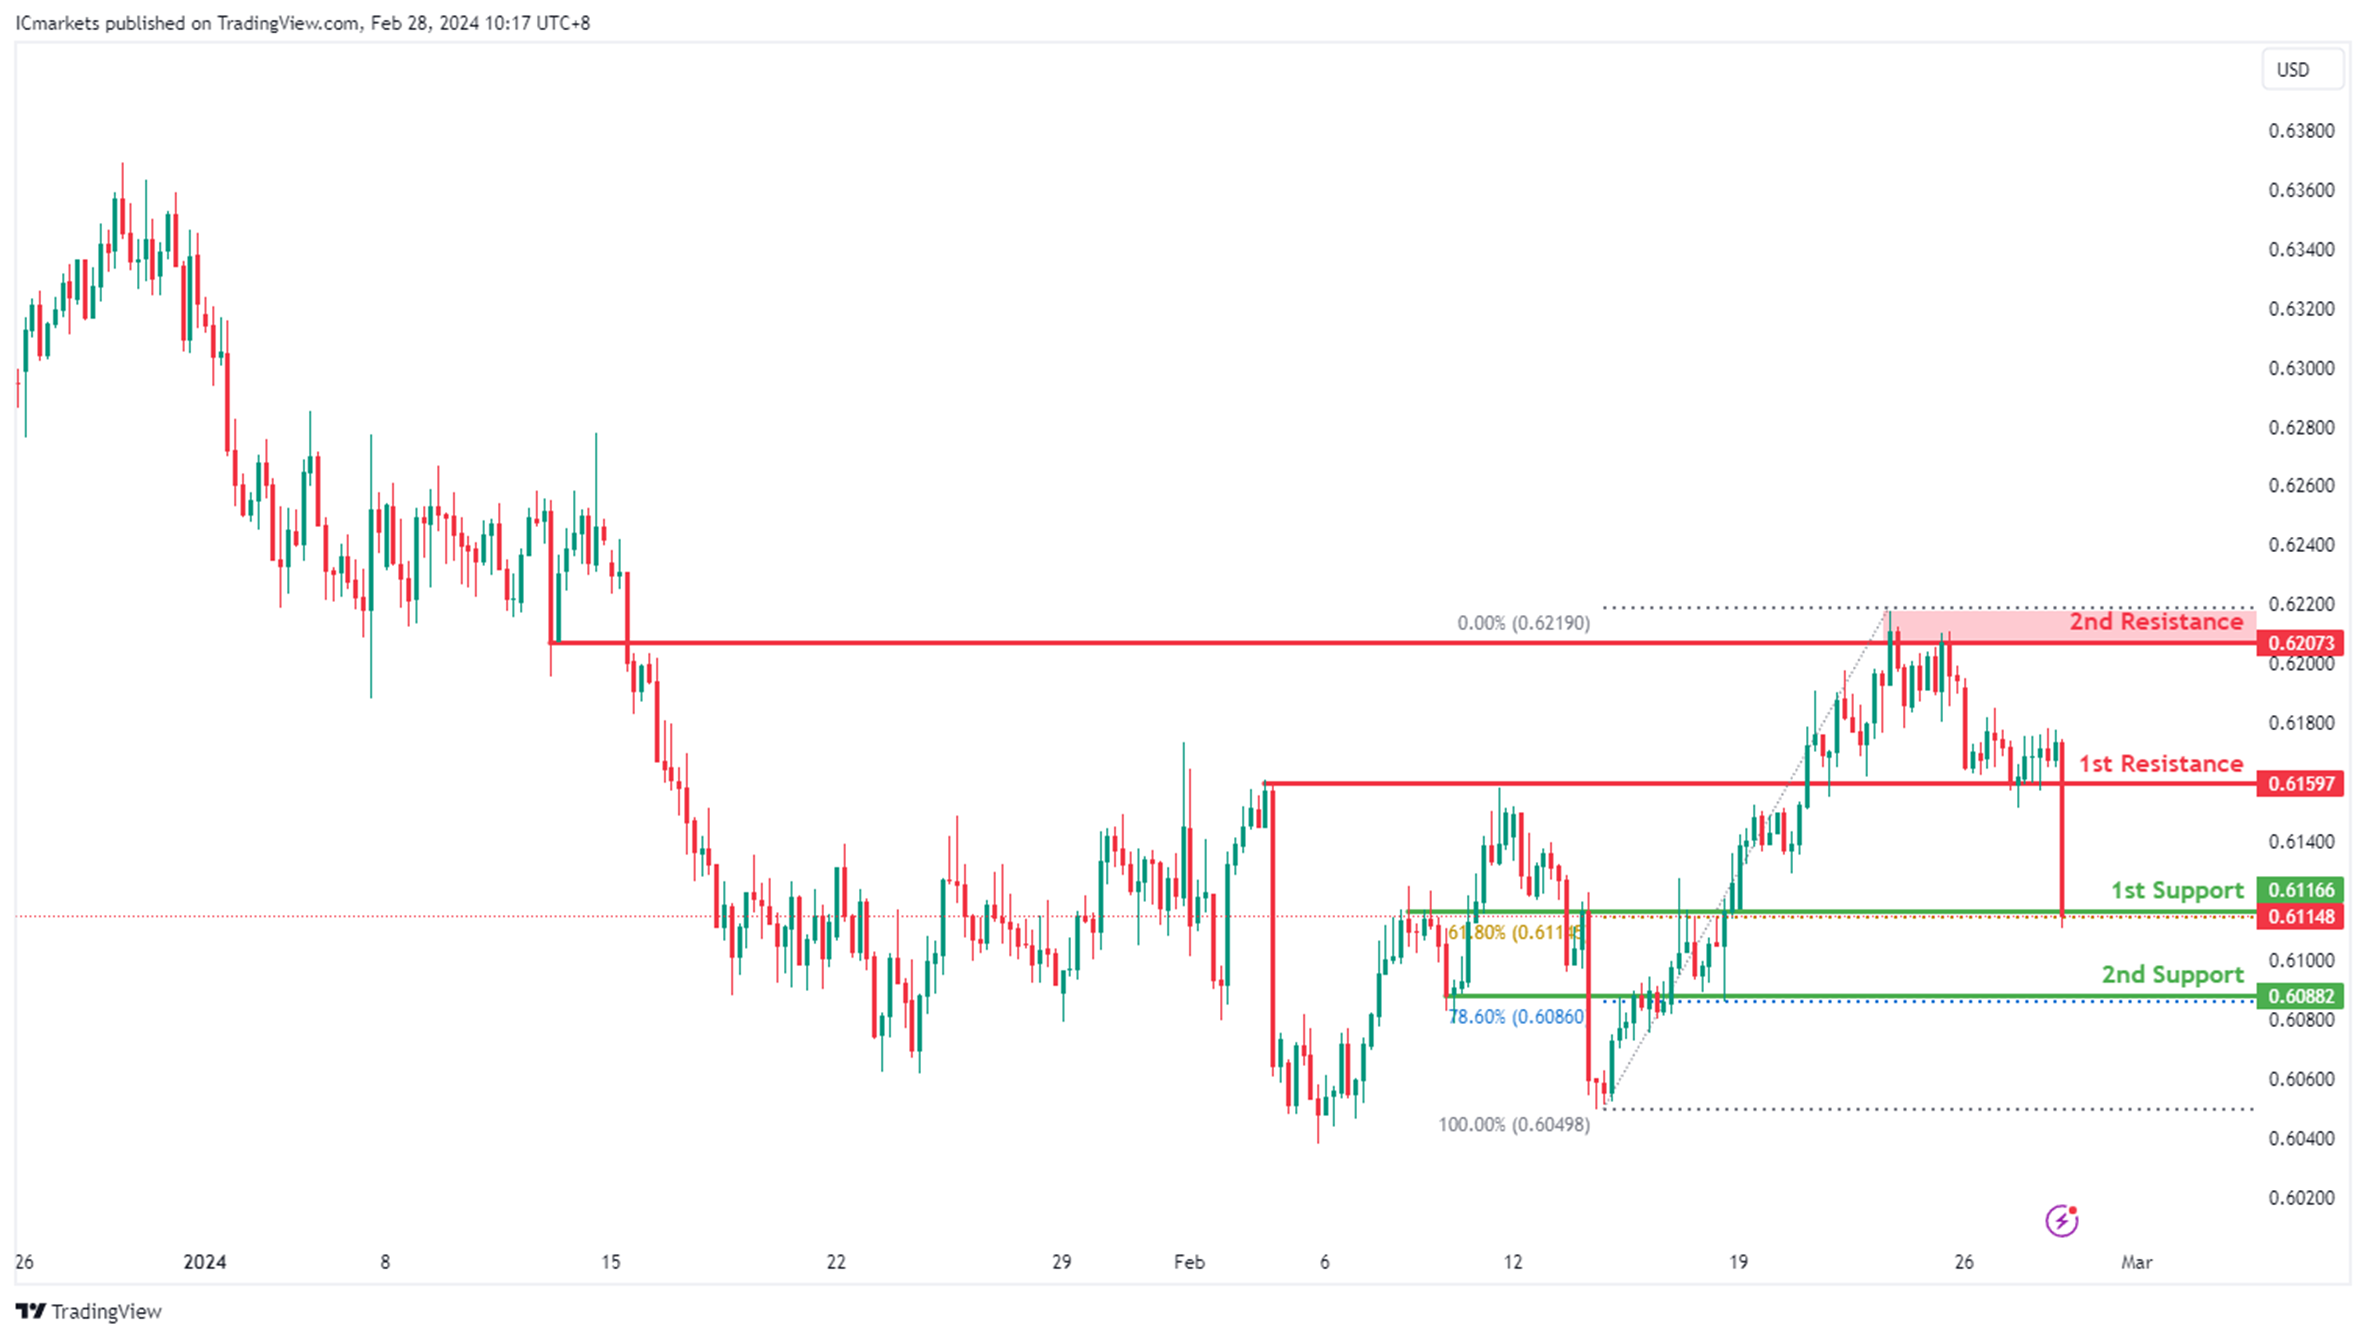
NZD/USD
The NZD/USD chart currently exhibits an overall bearish momentum. In this context, there is a potential scenario for price to break below the 1st support and drop towards the 2nd support.
The 1st support level at 0.6116 is identified as an overlap support that aligns with the 61.80% Fibonacci Retracement level. Further below, the 2nd support level at 0.6088 is also marked as an overlap support that aligns with the 78.60% Fibonacci Retracement level, further emphasizing its importance as a potential support zone.
To the upside, the 1st resistance level at 0.6159 is identified as an overlap resistance. Higher up, the 2nd resistance level at 0.6270 is also noted as an overlap resistance, further highlighting its importance as a potential resistance point.
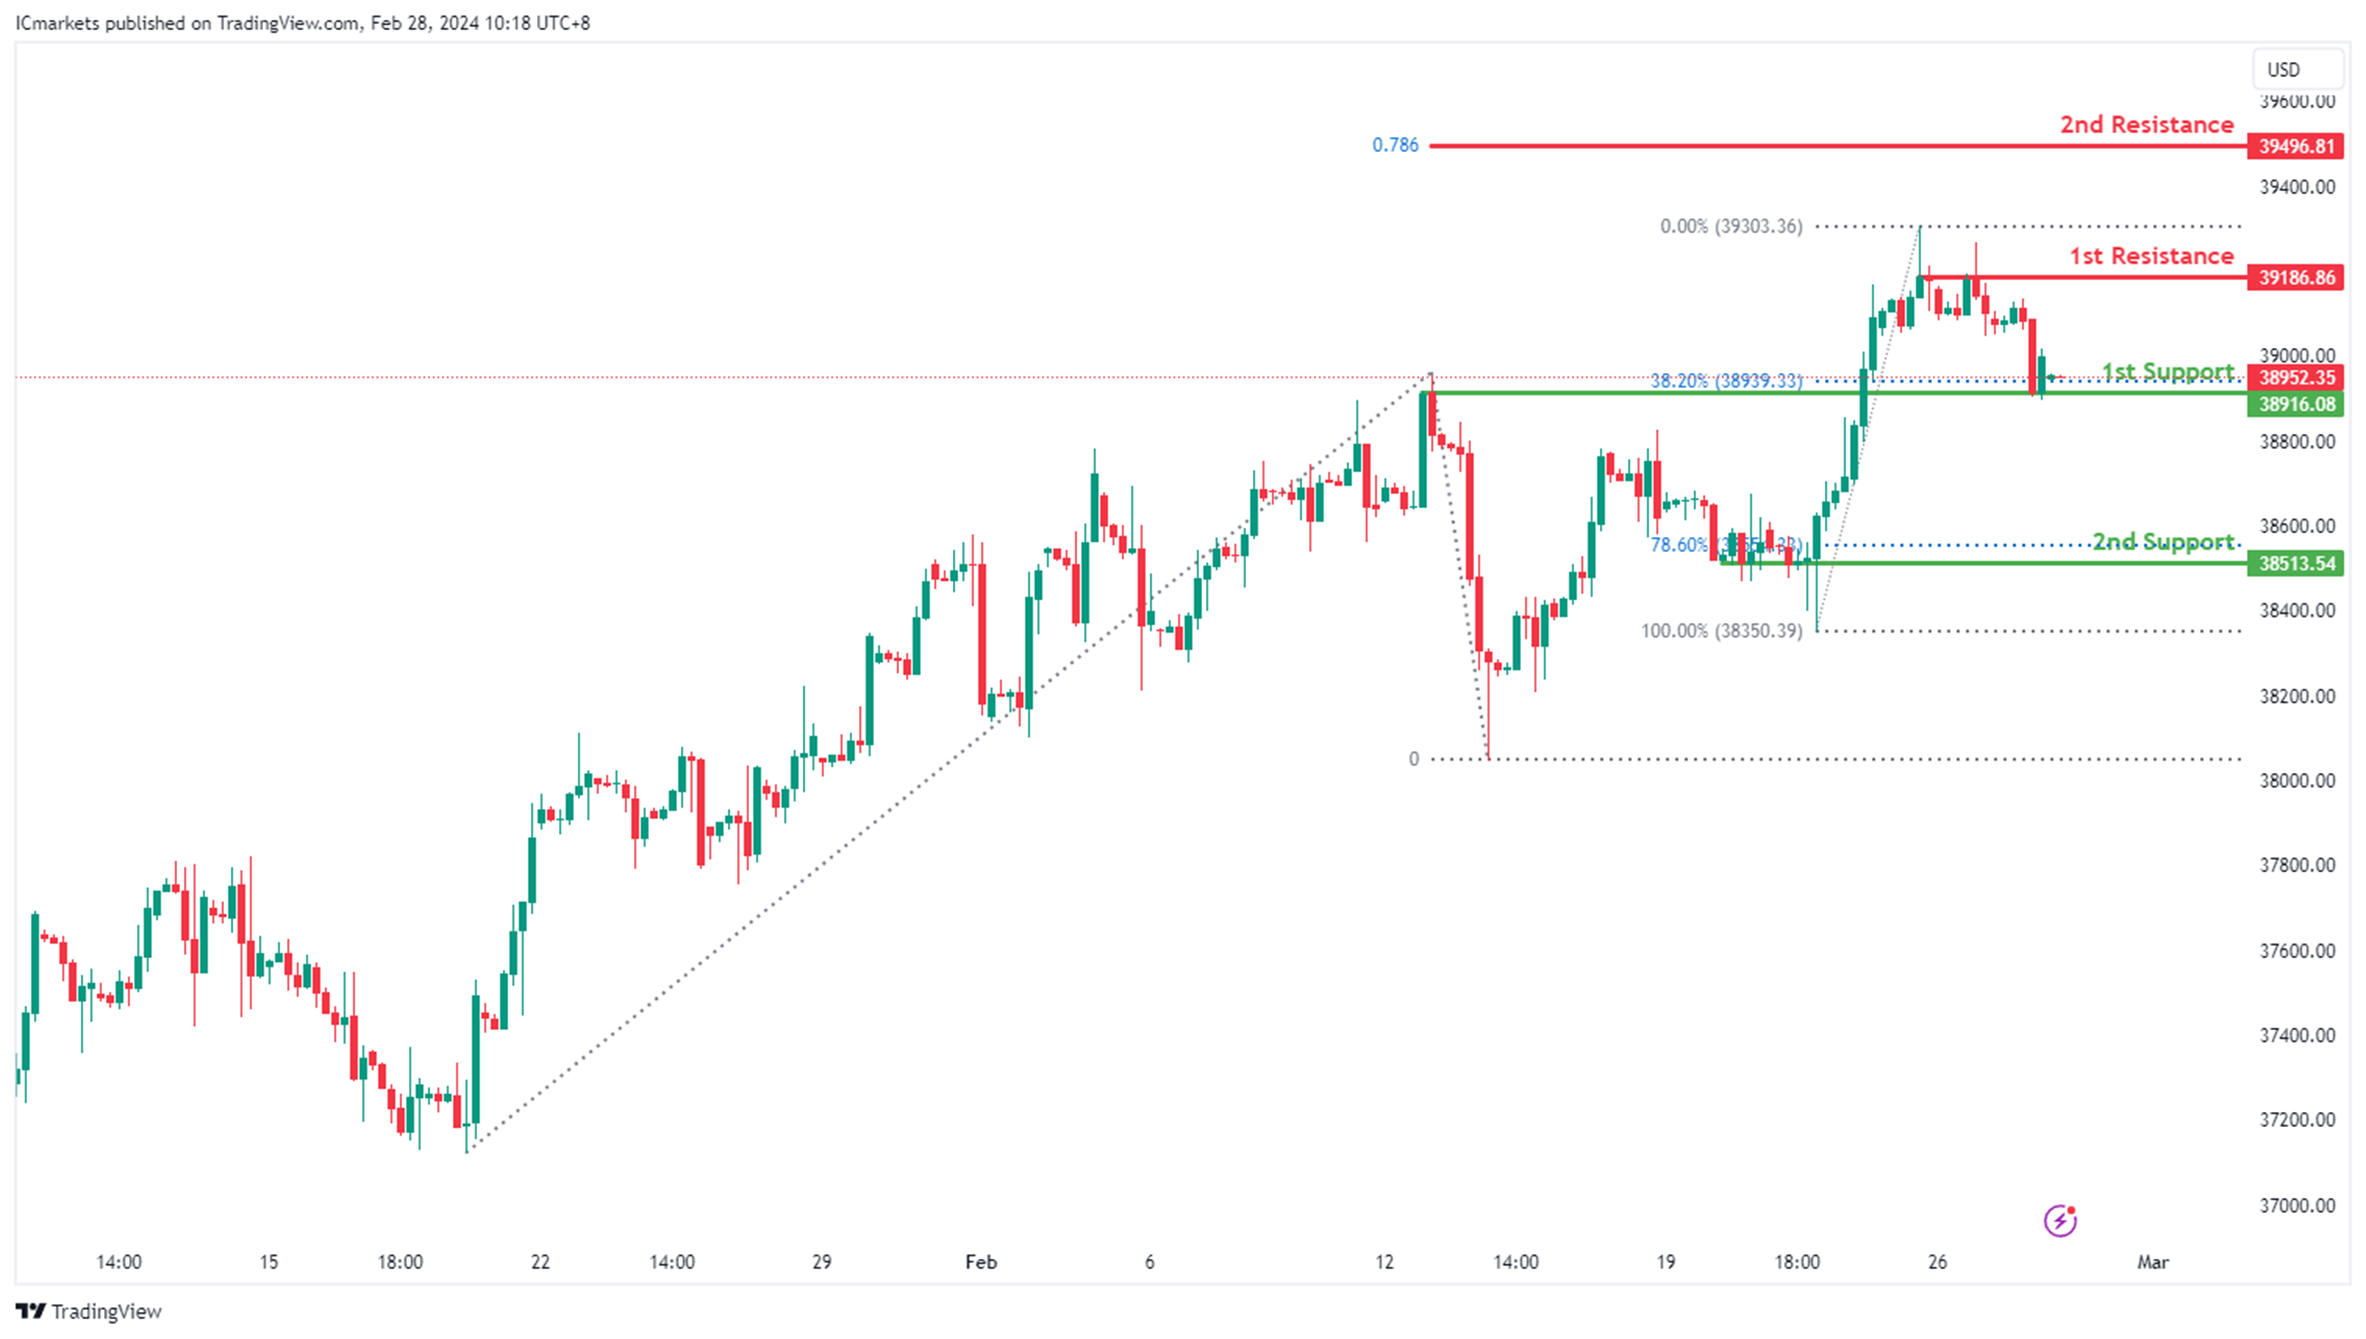
DJ30:
The DJ30 chart currently exhibits an overall bullish momentum. In this context, there is a potential scenario for price to make a bullish continuation towards the 1st resistance.
The 1st resistance level at 39,186.86 is identified as a pullback resistance. Higher up, the 2nd resistance level at 39,496.81 is noted as a resistance that aligns with the 78.60% Fibonacci Projection level, adding to its significance as a potential barrier to further bullish movement.
On the support side, the 1st support level at 38,916.08 is identified as an overlap support that aligns close to the 38.20% Fibonacci Retracement level. Further below, the 2nd support at 38,513.54 is marked as a pullback support that aligns close to the 78.60% Fibonacci Retracement level, further reinforcing its significance as a potential level of support.
GER40:
The GER40 chart currently demonstrates an overall bullish momentum, suggesting a potential continuation of the upward trend towards the 1st resistance.
The 1st resistance level at 17,834.20 is identified as a resistance that aligns with the 61.80% Fibonacci Projection level. Higher up, the 2nd resistance level at 18,244.54 is marked as a resistance that aligns with the 78.60% Fibonacci Projection level, adding to its significance as a potential barrier to further bullish movement.
On the support side, the intermediate support level at 17,372.90 is identified as a pullback support that aligns with the 23.60% Fibonacci Retracement level while the 1st support level at 17,179.53 is also marked as a pullback support that aligns with the 50.00% Fibonacci Retracement level. Additionally, the 2nd support level at 17,048.24 is noted as an overlap support, further reinforcing its importance as a potential area of support.

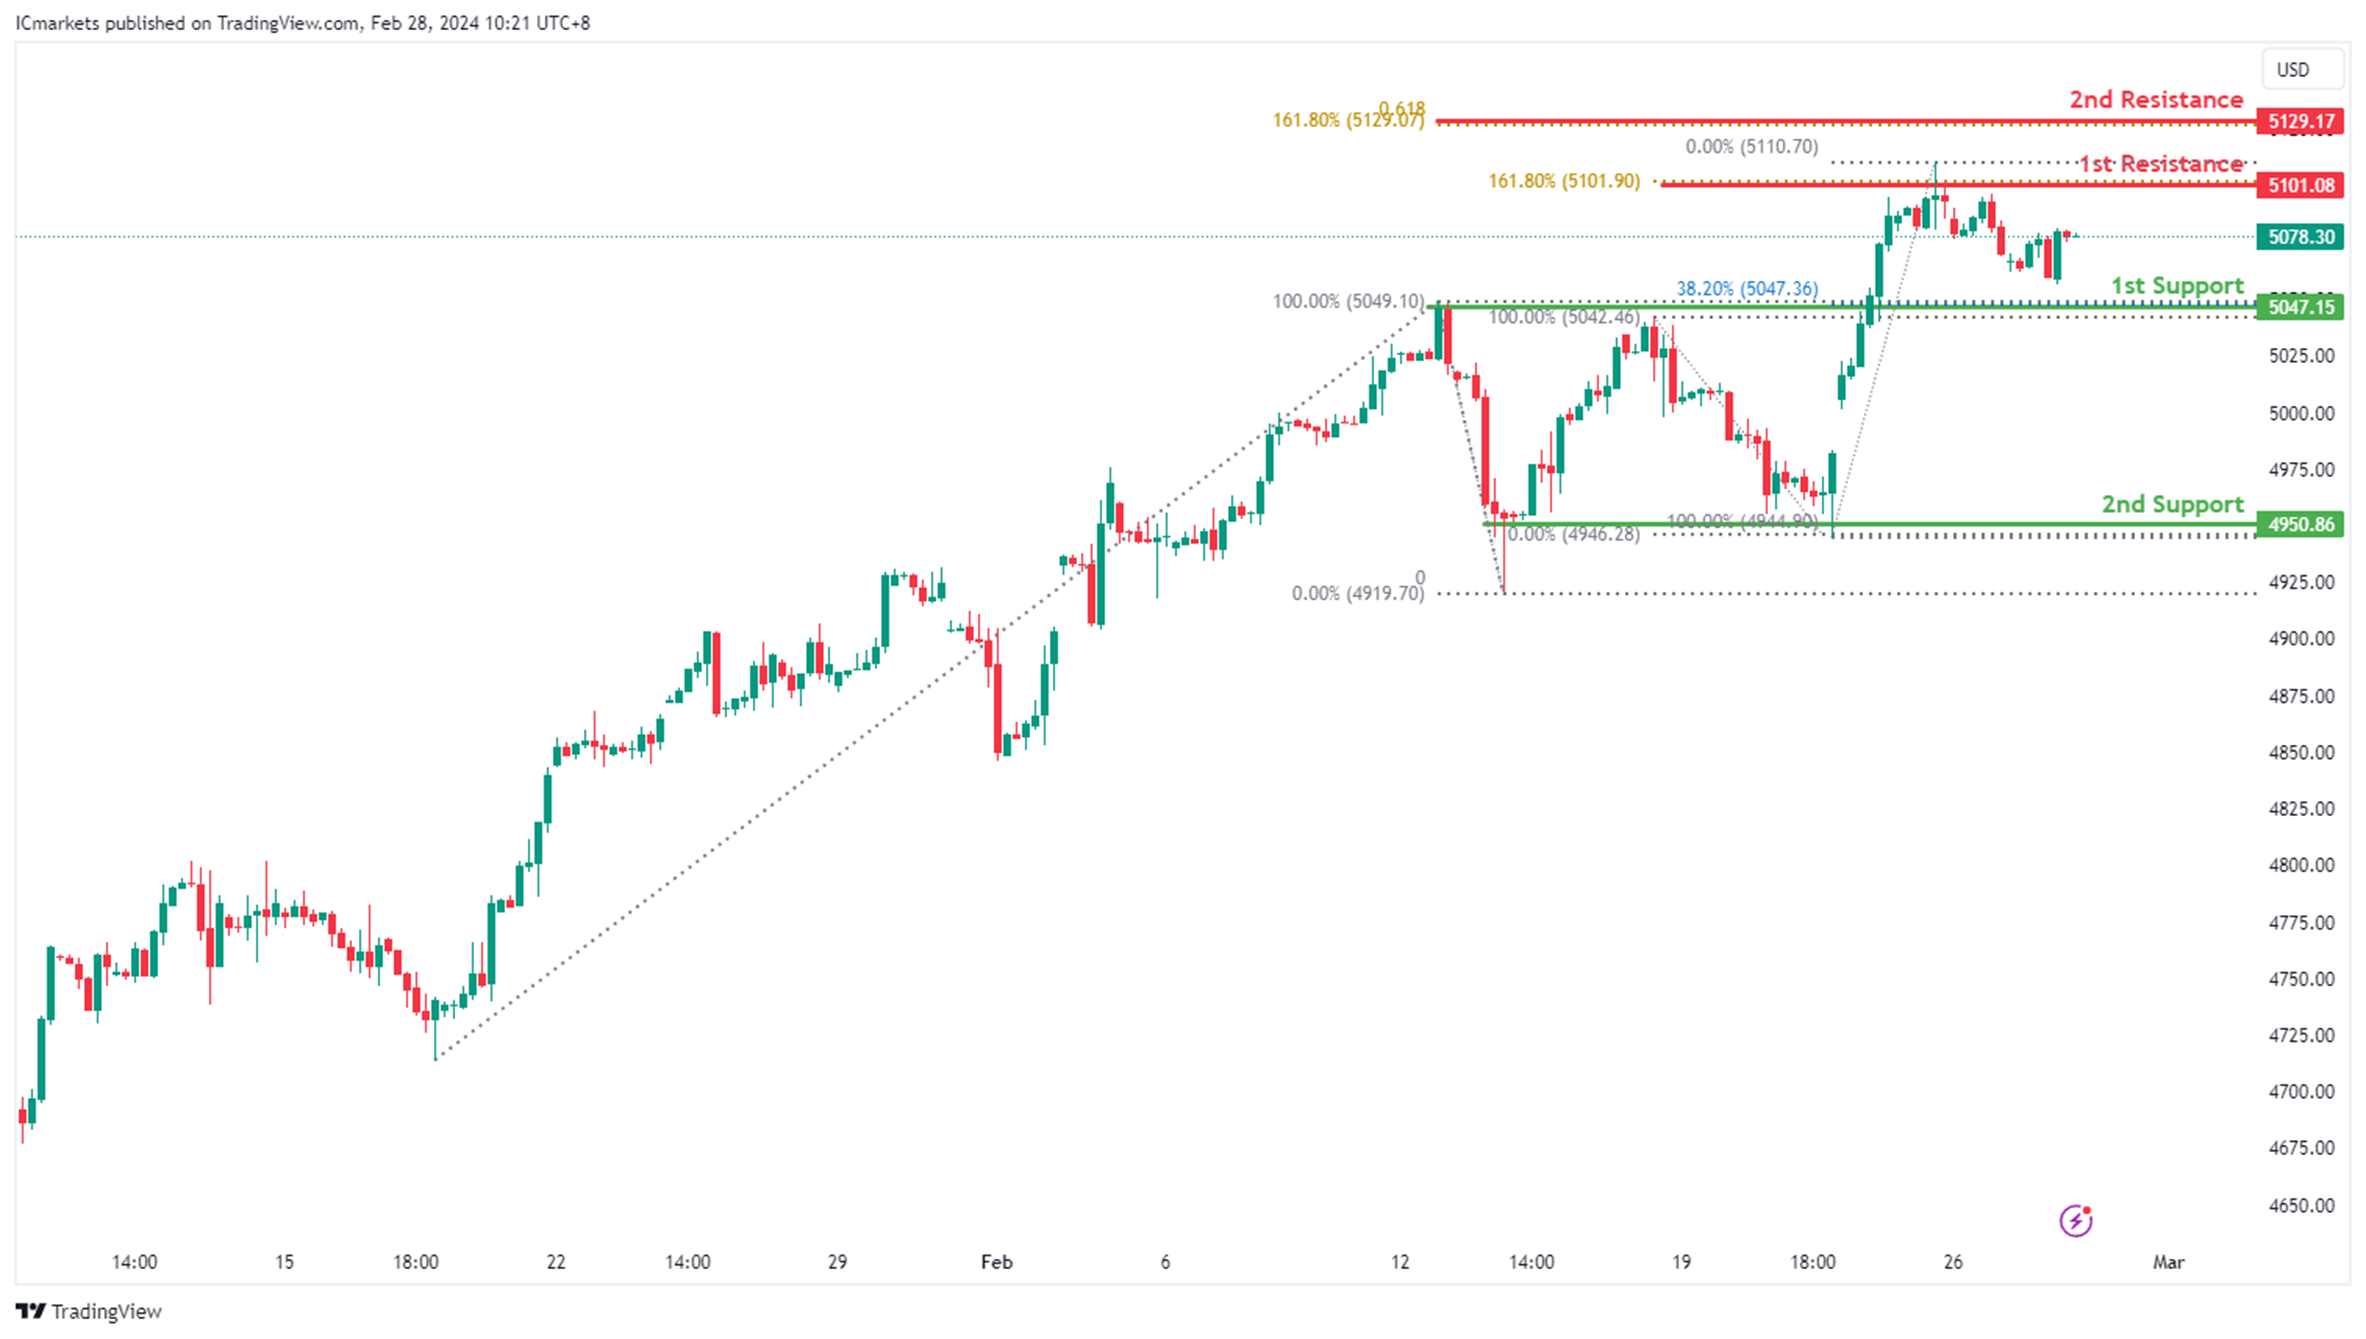
US500:
The US500 chart currently demonstrates an overall bullish momentum, suggesting a potential continuation of the upward trend towards the 1st resistance.
The 1st resistance level at 5,101.08 is identified as a pullback resistance that aligns with the 161.80% Fibonacci Extension level. Higher up, the 2nd resistance level at 5,129.17 is noted as a resistance that aligns with a confluence of Fibonacci levels i.e. the 61.80% Projection and the 161.80% Extension, adding to its significance as a potential barrier to further bullish movement.
On the support side, the 1st support level at 5,047.15 is identified as a pullback support that aligns with the 38.20% Fibonacci Retracement level. Further below, the 2nd support level at 4,950.86 is also marked as a pullback support, further reinforcing its significance as a potential area of support.
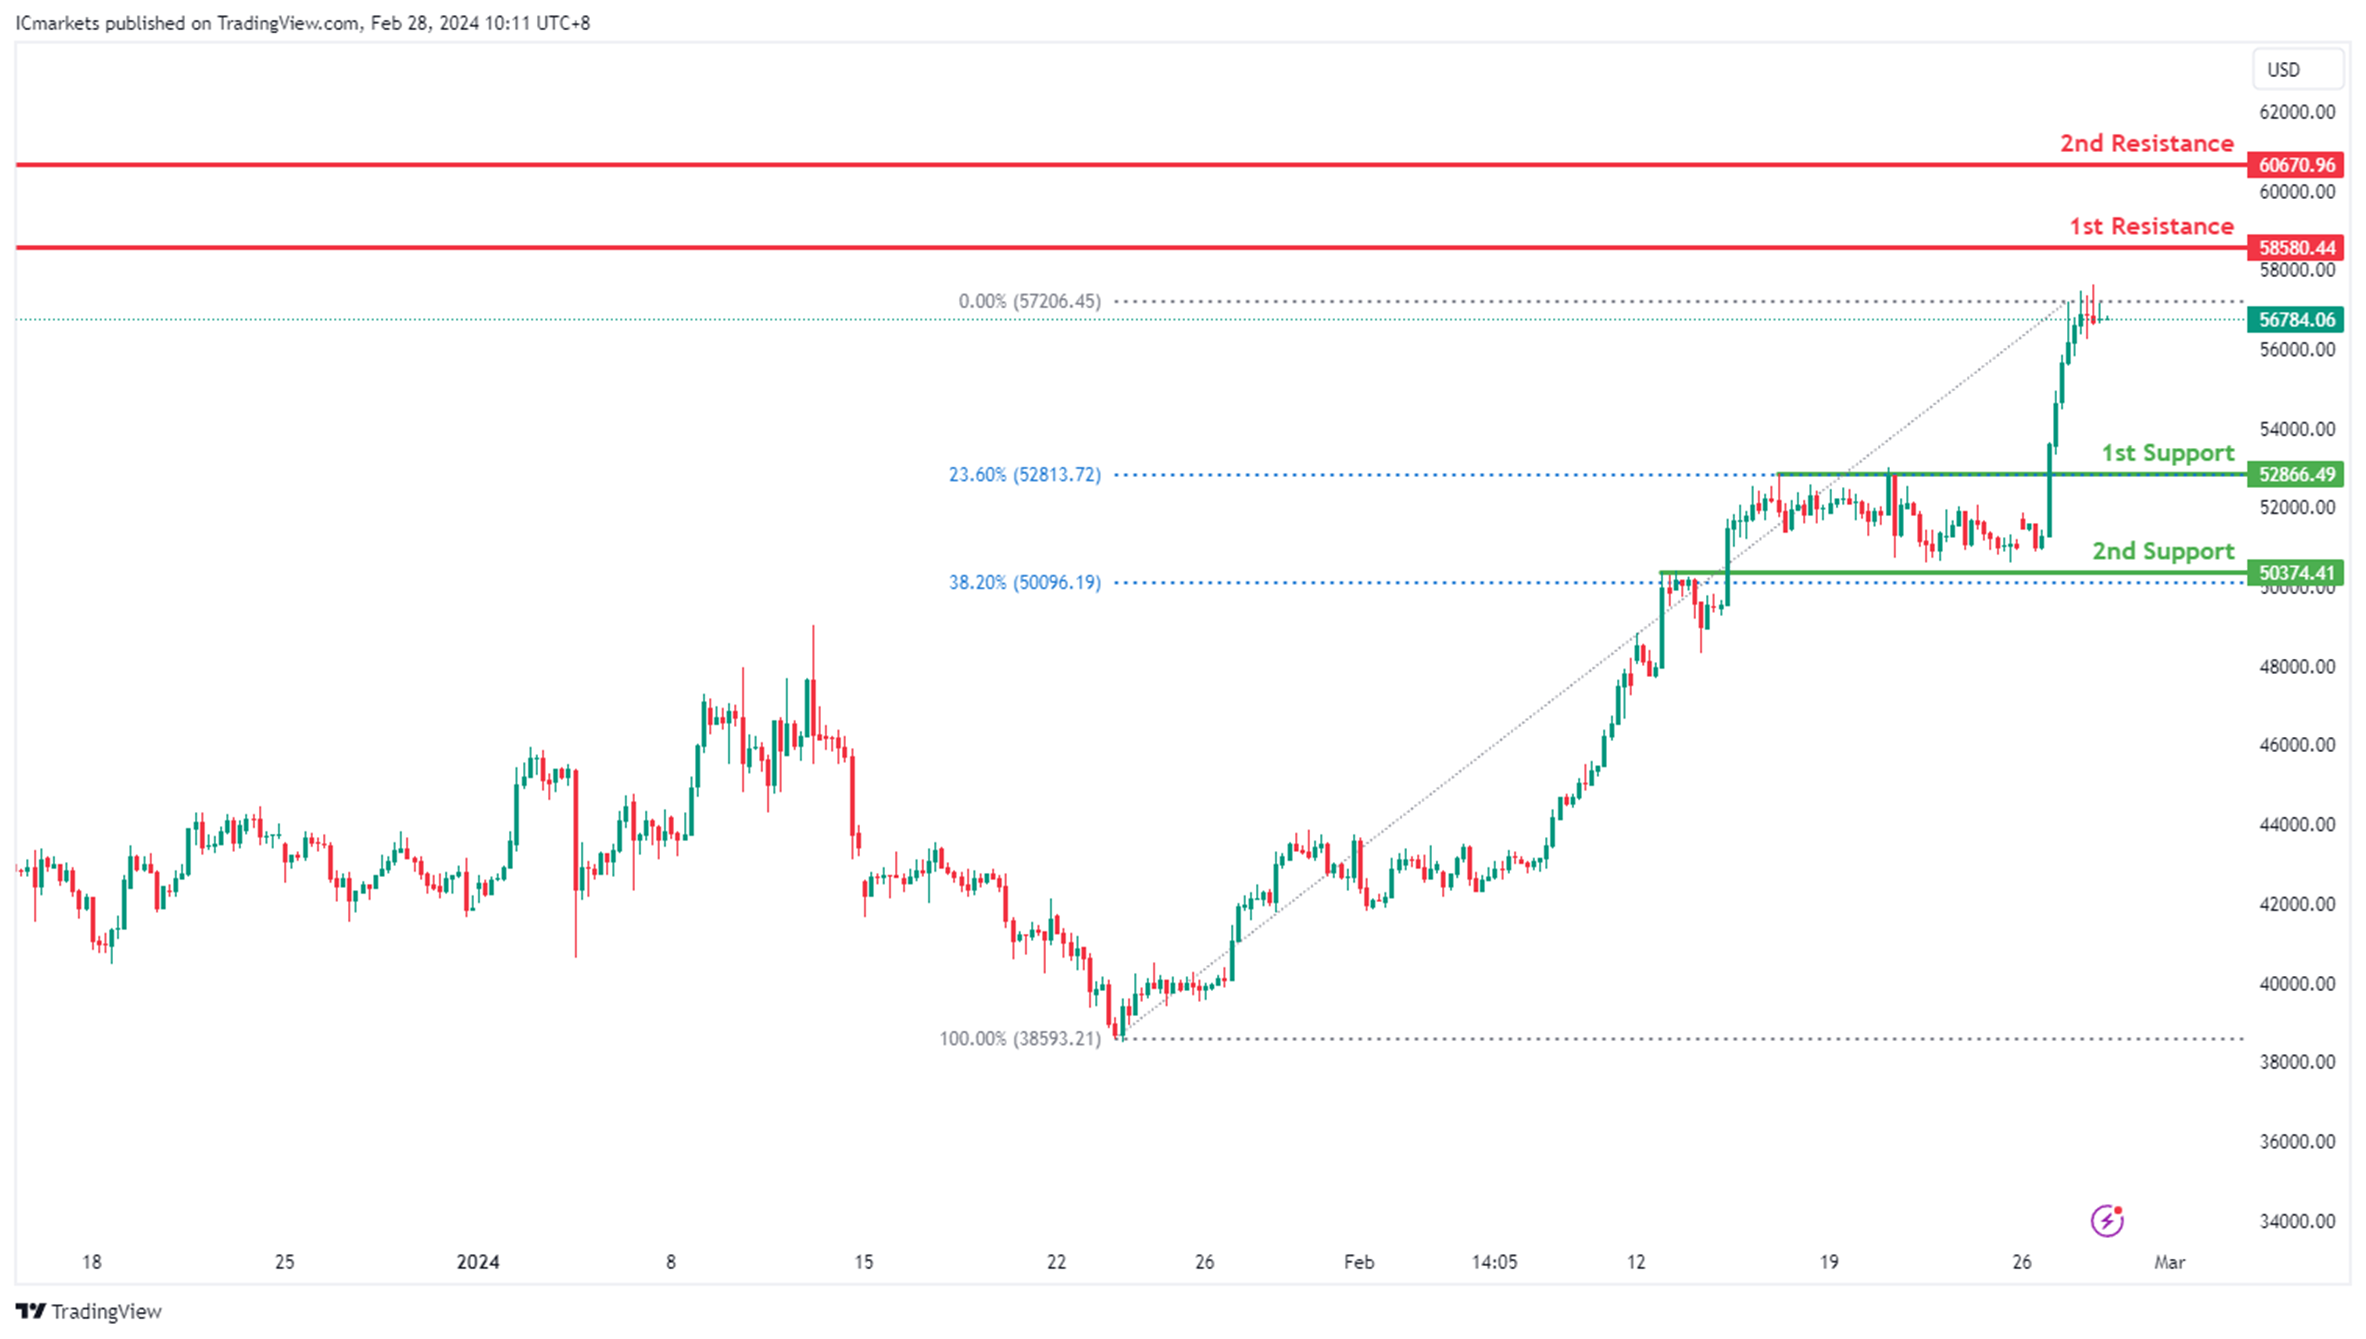
BTC/USD:
The BTC/USD chart currently exhibits an overall bullish momentum. In this context, there is a potential scenario for price to make a bullish continuation towards the 1st resistance.
The 1st resistance level at 58,580.44 is identified as a pullback resistance. Higher up, the 2nd resistance level at 60,670.96 is noted as an overlap resistance, adding to its significance as a potential barrier to further bullish movement.
On the support side, the 1st support level at 52,866.49 is identified as a pullback support that aligns with the 23.60% Fibonacci Retracement level. Further below, the 2nd support at 50,374.41 is marked as an overlap support that aligns with the 38.20% Fibonacci Retracement level, further reinforcing its significance as a potential level of support.
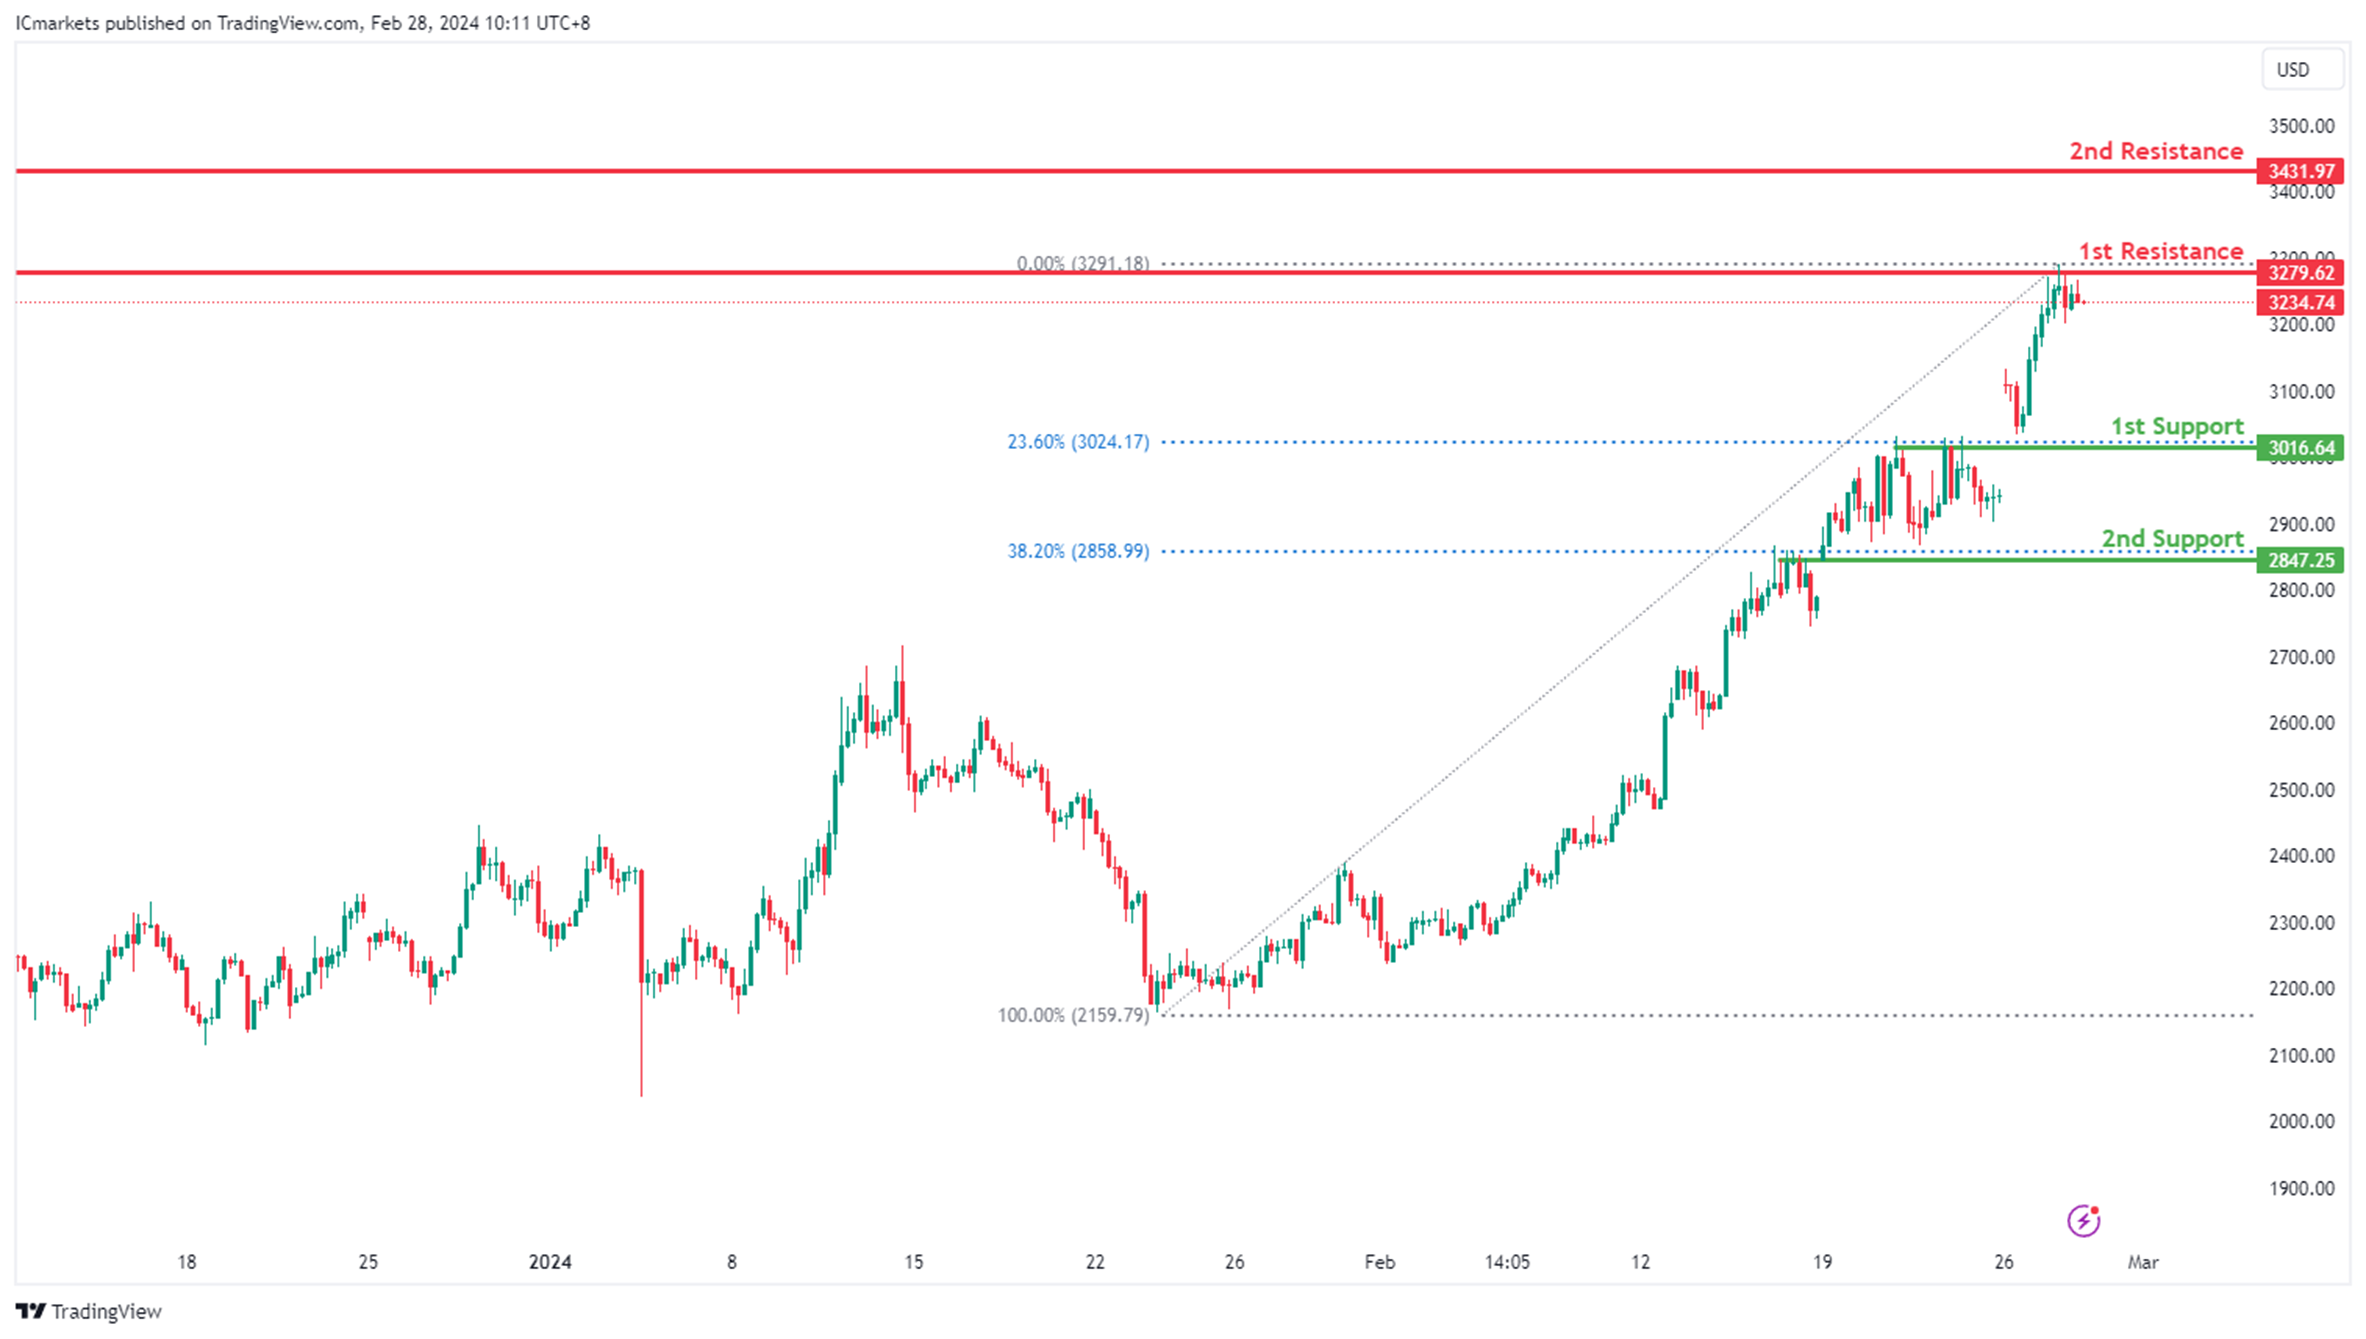
ETH/USD:
The ETH/USD chart currently exhibits an overall bullish momentum. In this context, there is a potential scenario for price to make a bullish continuation towards the 1st resistance.
The 1st resistance level at 3,279.62 is identified as a pullback resistance. Higher up, the 2nd resistance level at 3,431.97 is also noted as a pullback resistance, adding to its significance as a potential barrier to further bullish movement.
On the support side, the 1st support level at 3,016.64 is identified as a pullback support that aligns with the 23.60% Fibonacci Retracement level. Further below, the 2nd support at 2,847.25 is marked as an overlap support that aligns with the 38.20% Fibonacci Retracement level, further reinforcing its importance as a potential area of support.
WTI/USD:
The WTI (West Texas Intermediate) chart currently exhibits a neutral bias. In this context, there is a potential scenario for price to fluctuate between the 1st support and the 1st resistance.
The 1st support level at 76.17 is identified as a pullback support that aligns with the 38.20% Fibonacci Retracement level. Further below, the 2nd support level at 75.16 is also marked as a pullback support that aligns with the 50.00% Fibonacci Retracement level, reinforcing its significance as a key support level.
To the upside, the 1st resistance level at 79.07 is identified as a multi-swing-high resistance. Higher up, the 2nd resistance level at 80.79 is marked as a pullback resistance, further highlighting its importance as a potential resistance zone.

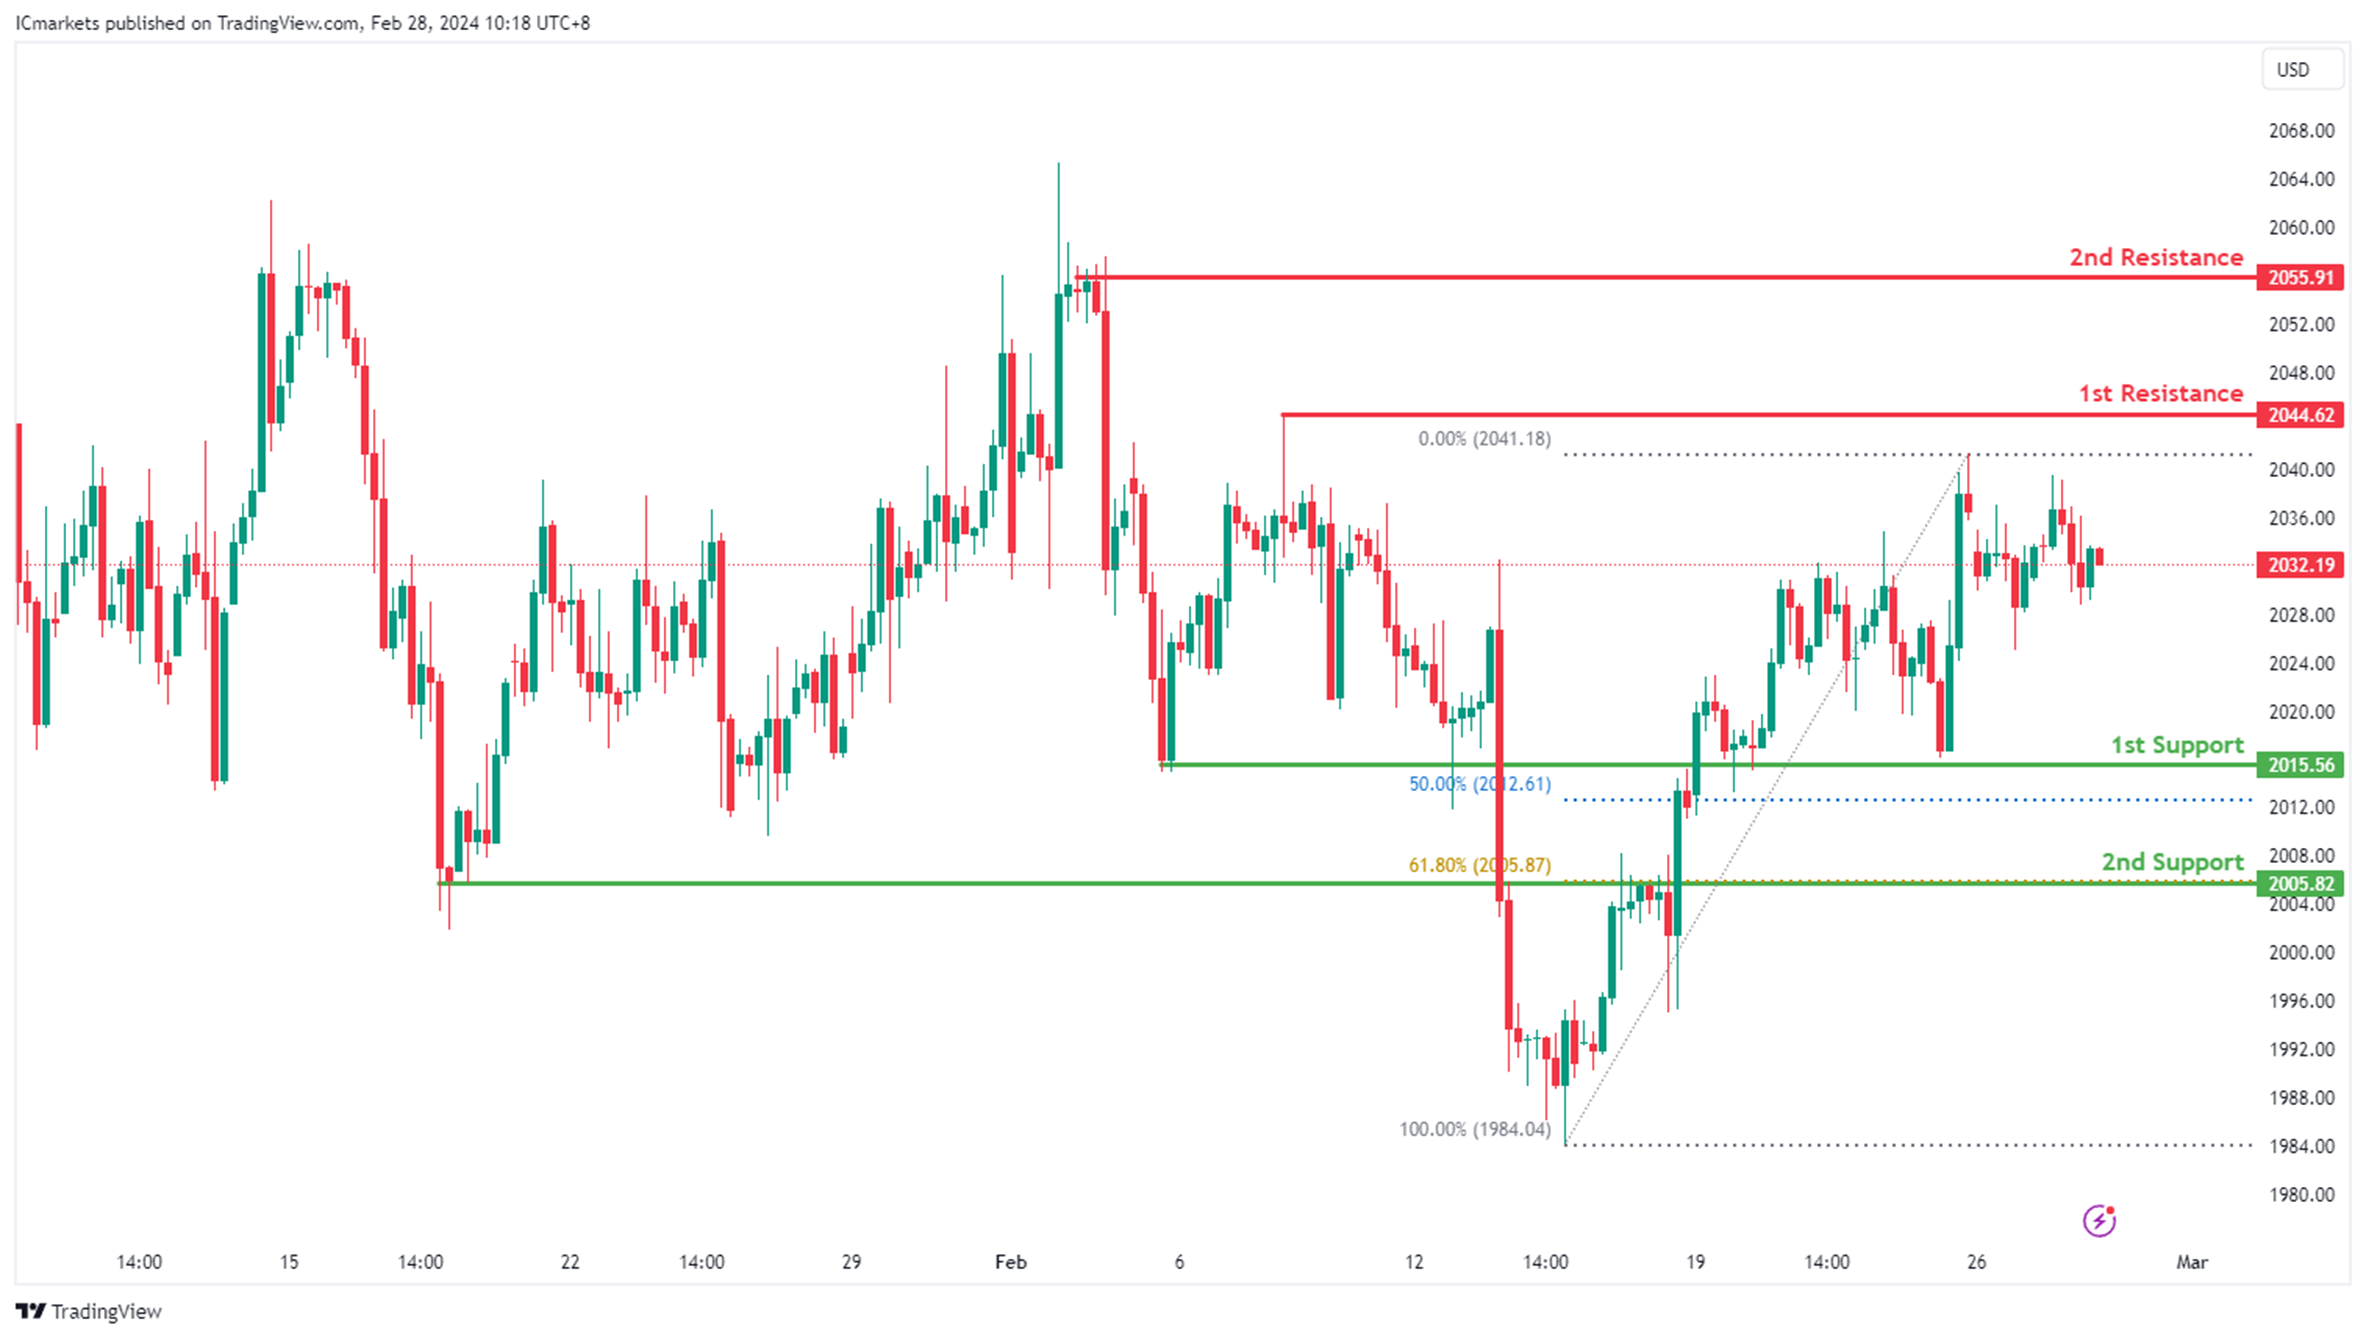
XAU/USD (GOLD):
The XAUUSD (Gold/USD) chart currently exhibits an overall bullish momentum. In this context, there is a potential scenario for price to make a bullish continuation towards the 1st resistance.
The 1st resistance level at 2,044.62 is identified as a pullback resistance. Higher up, the 2nd resistance level at 2,055.91 is also noted as a pullback resistance, adding to its significance as a potential barrier to further bullish movement.
On the support side, the 1st support level at 2,015.56 is identified as a pullback support that aligns close to the 50.00% Fibonacci Retracement level. Further below, the 2nd support at 2,005.82 is marked as an overlap support that aligns with the 61.80% Fibonacci Retracement level, further reinforcing its importance as a potential area of support.


