
Bullish Scenario: Buys above 17910 with TP:18098.07, TP2:18277, and TP3: 18415 with S.L. below 17890 or at least 1% of account capital*. Apply trailing stop.
Bearish Scenario: Sells below 17850 with TP1:17730, TP2: 17700 with S.L. above 17900 or at least 1% of account capital*.
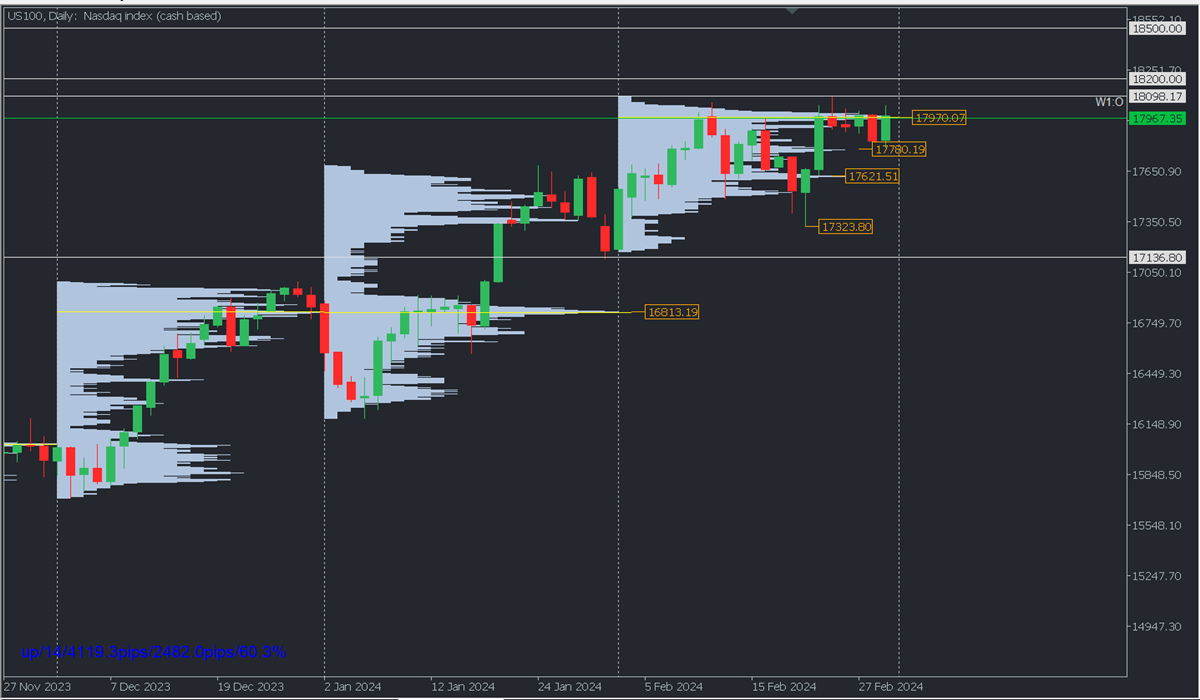
Analysis from the daily chart: volume Profile and Structure.
At the close of February, the index set a new all-time high at 18098.17 and a monthly volume profile with an uncovered POC* at the top around 17970.07, implying that as long as prices remain below that volume concentration, sales are expected with targets at nearby high volume nodes like 17780.19, from where it rebounded today, with a possible bullish renewal.
However, if the price falls below 17900, it is possible to consider the renewal of sales towards the next high volume node of the month at 17621.51, noting that as long as the last relevant macro support at 17322.94 is not broken, the index will continue in an uptrend, seeking to renew the ascent from one of the indicated points to create new all-time highs in March.
On the other hand, the anticipated surpassing of February’s POC at 17971.89 will confirm the market’s intention to extend the trend with 18200 as a short-term target and 18500 to be reached in March.
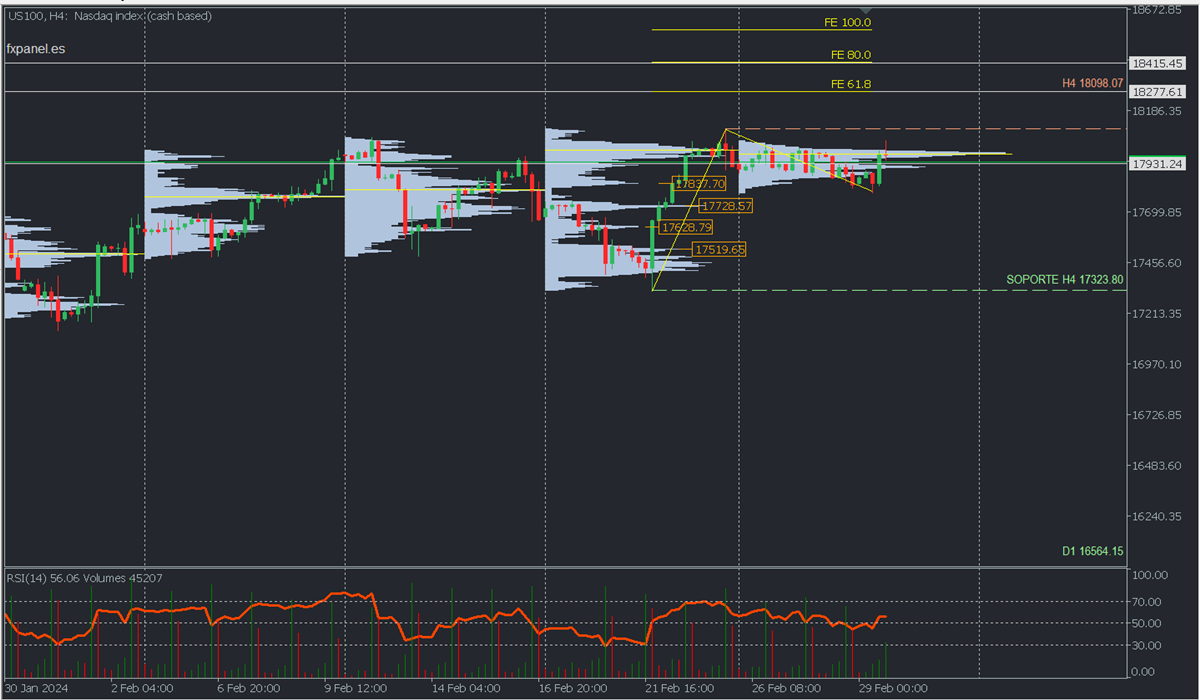
Scenario from H4 chart:
Observe on the chart the high volume buyer nodes from last week, which are objective levels in case prices fall again below 17850. The bulls will defend these high-volume nodes to provoke new price rebounds to break the current all-time high and seek Fibonacci extensions of 61.8 at 18277, and 80% at 18415.45. Generally, a second touch to each zone tends to break it, causing the descent towards the next high-volume node or buying zone.
*Uncovered POC: POC = Point of Control: It is the level or zone where the highest volume concentration occurred. If there was a bearish movement from it previously, it is considered a selling zone and forms a resistance zone. Conversely, if there was a bullish impulse previously, it is considered a buying zone, usually located at lows, thus forming support zones.
**Consider this risk management suggestion:
It is essential that risk management be based on capital and traded volume. Therefore, a maximum risk of 1% of the capital is recommended. It is suggested to use risk management indicators such as Easy Order.


