
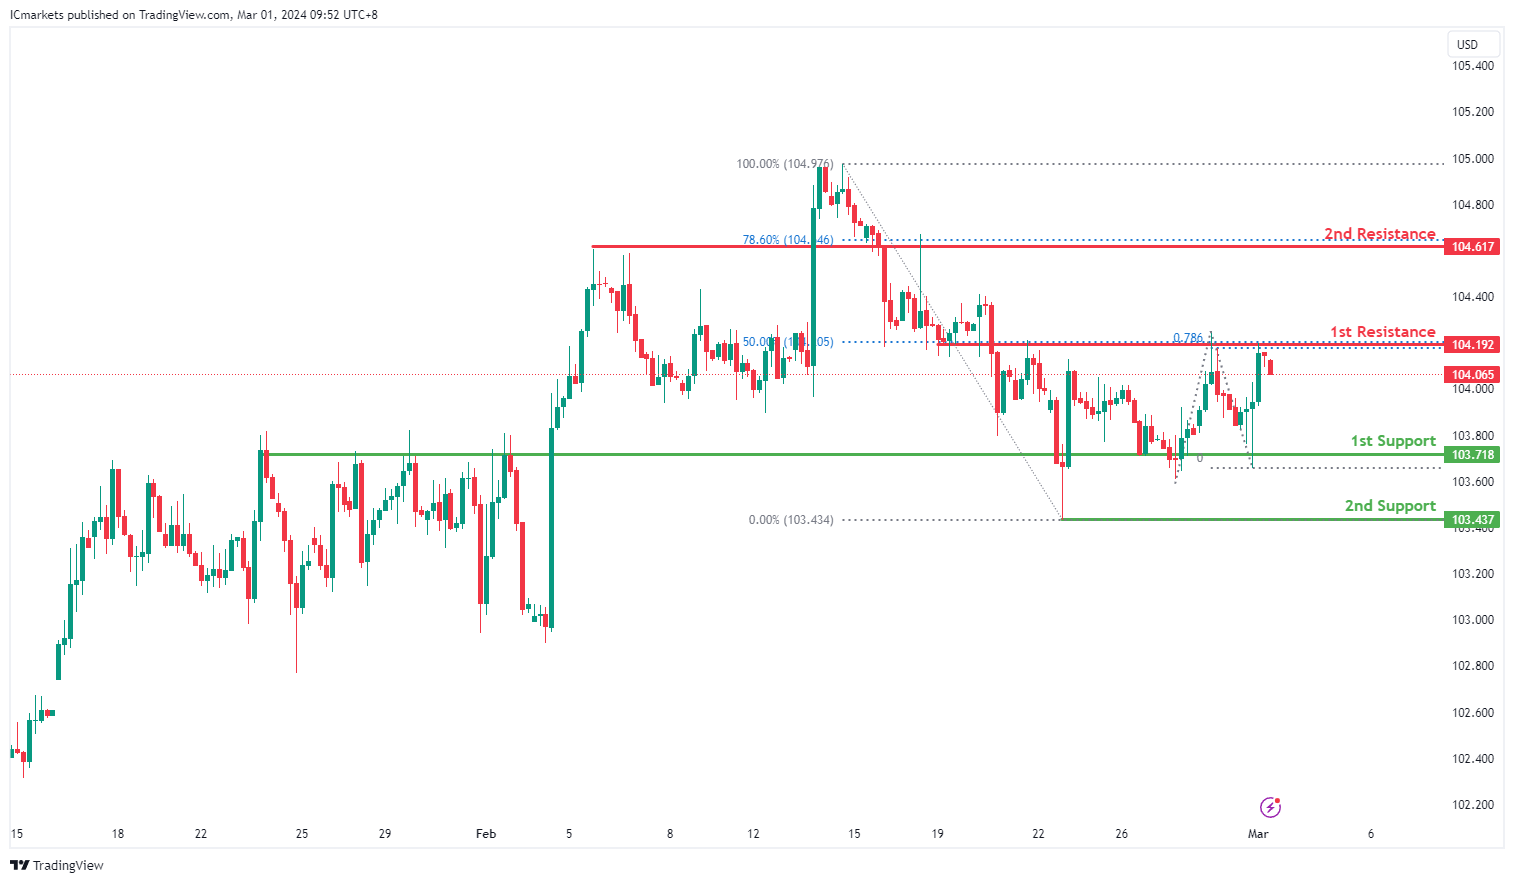
DXY:
The DXY chart maintains a bearish momentum, suggesting a potential continuation of the downtrend towards the 1st support level.
The 1st support at 103.71 is significant as an overlap support, indicating its historical relevance as a level where buying interest has previously emerged, potentially providing a floor for the current downtrend.
Further supporting potential downside movement, the 2nd support at 103.43 corresponds to a swing low support, reinforcing its significance as a level where buyers historically intervened to prevent further decline.
On the resistance side, the 1st resistance level at 104.19 is identified as an overlap resistance, coinciding with the 50% Fibonacci Retracement level. This suggests a notable barrier to upward movement, where selling pressure may intensify.
Additionally, the 2nd resistance at 104.61 represents another overlap resistance and aligns with the 78.60% Fibonacci Retracement level, further reinforcing its significance as a potential area of selling interest.
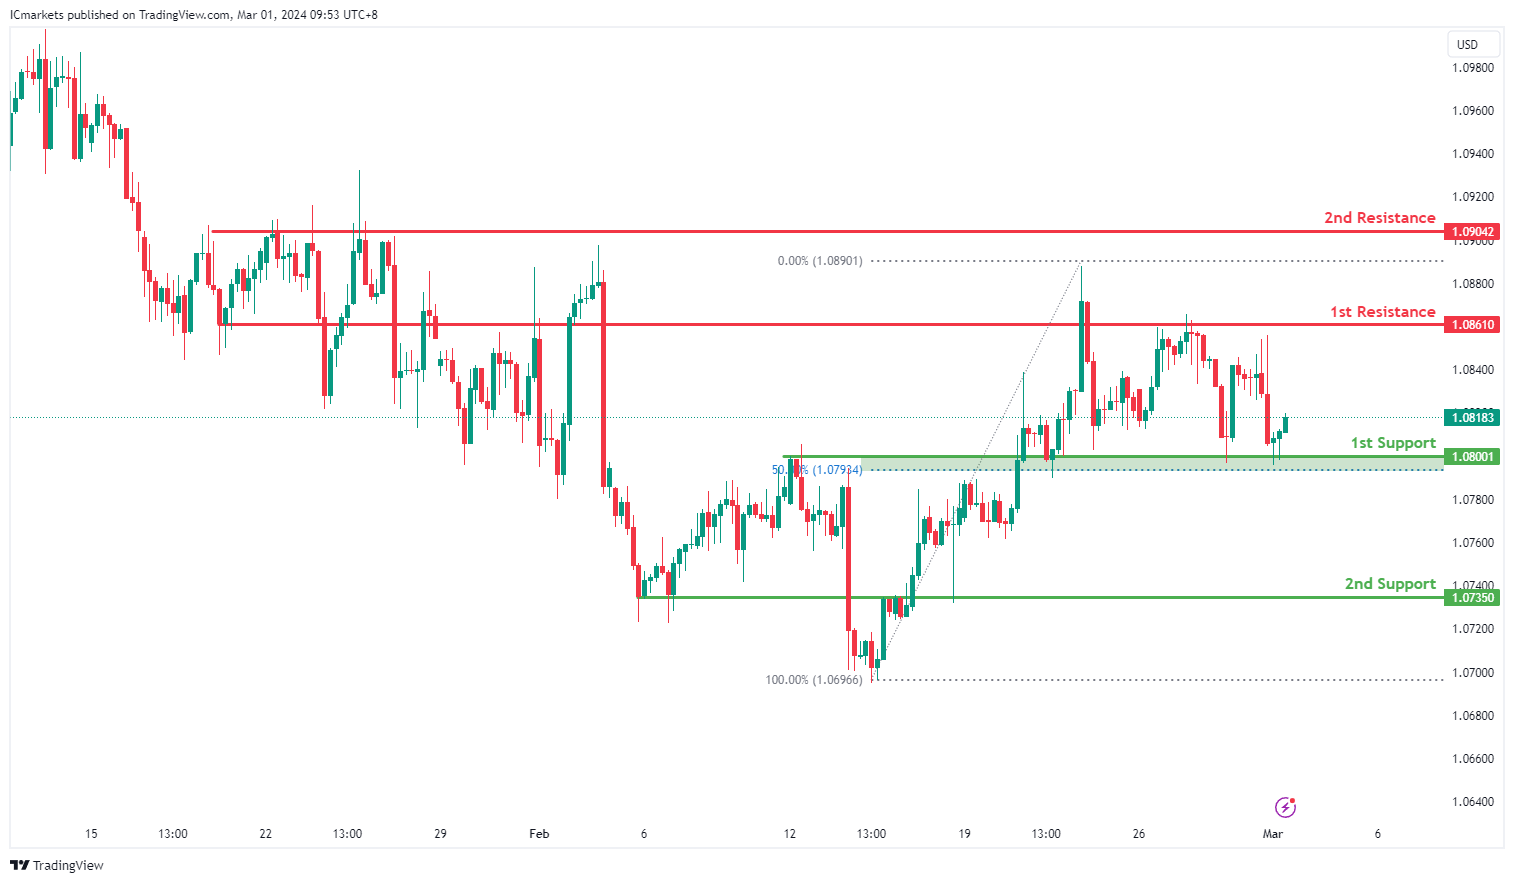
EUR/USD:
The EUR/USD chart exhibits bullish momentum, suggesting a potential bullish bounce off the 1st support level towards the 1st resistance.
The 1st support at 1.0800 is significant as an overlap support, indicating its historical significance as a level where buying interest has previously emerged to support the price. Traders may anticipate a potential rebound from this level given its historical relevance.
Additionally, the 2nd support at 1.0735 is also characterized as an overlap support, further reinforcing its importance as a level where buyers historically intervened to prevent further decline. This level provides additional confirmation of potential support.
On the resistance side, the 1st resistance level at 1.0861 is identified as an overlap resistance, suggesting its historical significance as a barrier where selling pressure may increase, potentially limiting upward movement in the short term.
Furthermore, the 2nd resistance at 1.0904 is noted for its presence as a multi-swing high resistance, further reinforcing its importance as a level where selling interest may intensify, potentially capping the upward movement of prices
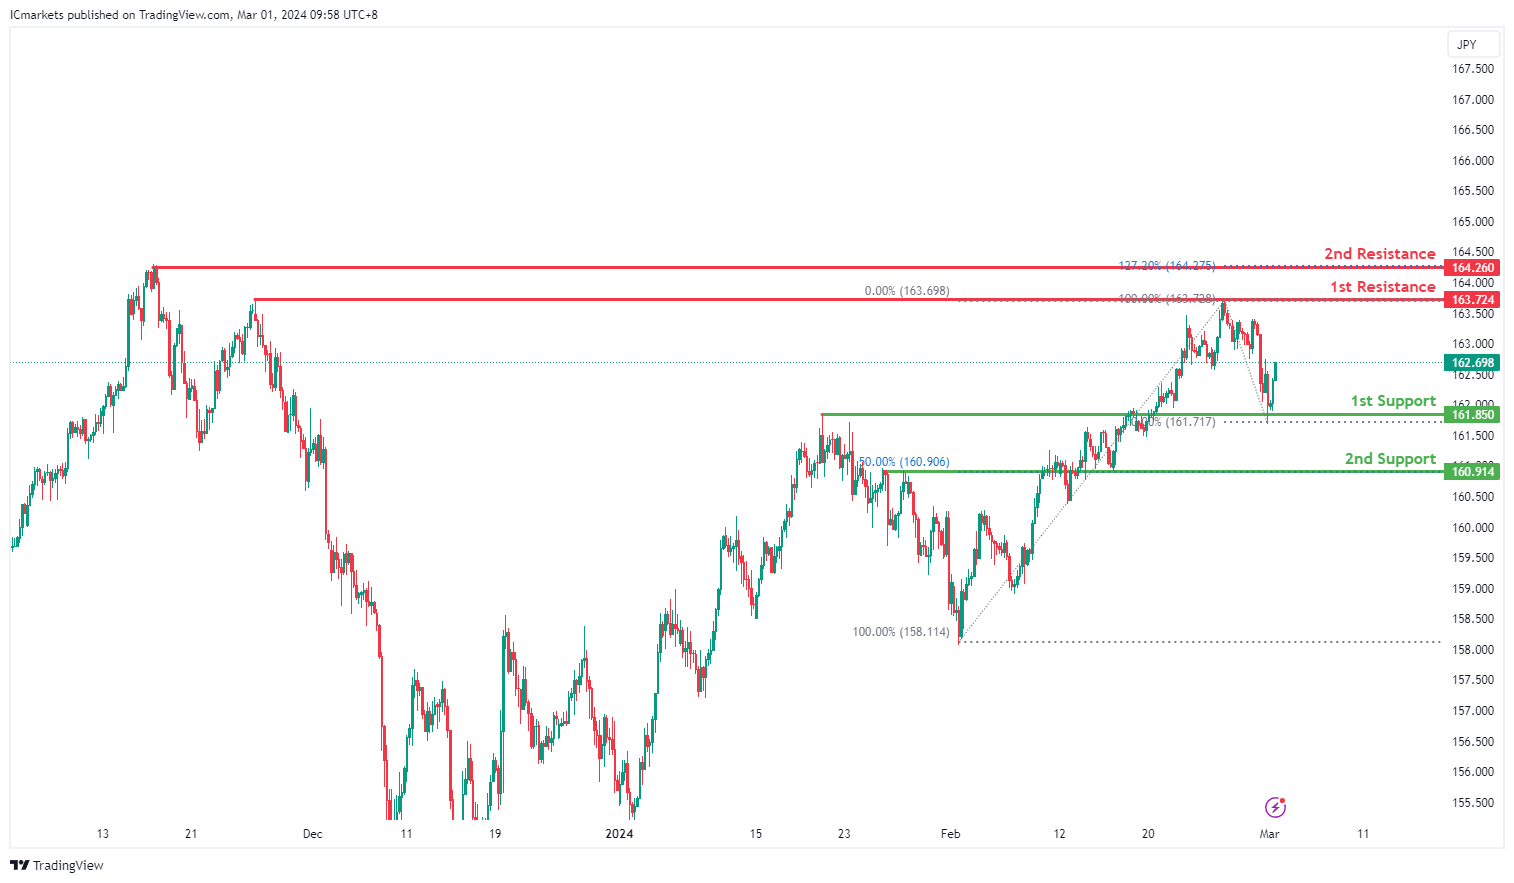
EUR/JPY:
The EUR/JPY chart reflects bullish momentum, suggesting a potential scenario of a bullish bounce off the 1st support level, leading towards the 1st resistance.
The 1st support at 161.85 is identified as an overlap support, indicating its historical significance as a level where buying interest has emerged previously, potentially providing support to the price.
Additionally, the 2nd support at 160.91 is characterized as an overlap support and aligns with the 50% Fibonacci Retracement level. This strengthens its significance as a potential support level where buyers may step in.
On the resistance side, the 1st resistance level at 163.72 is identified as a multi-swing high resistance, suggesting its historical importance as a barrier where selling pressure may increase, potentially limiting upward movement.
Furthermore, the 2nd resistance at 164.26 is noted as a swing high resistance and coincides with the 127.20% Fibonacci Extension level. This adds further weight to its significance as a level where selling interest may intensify.
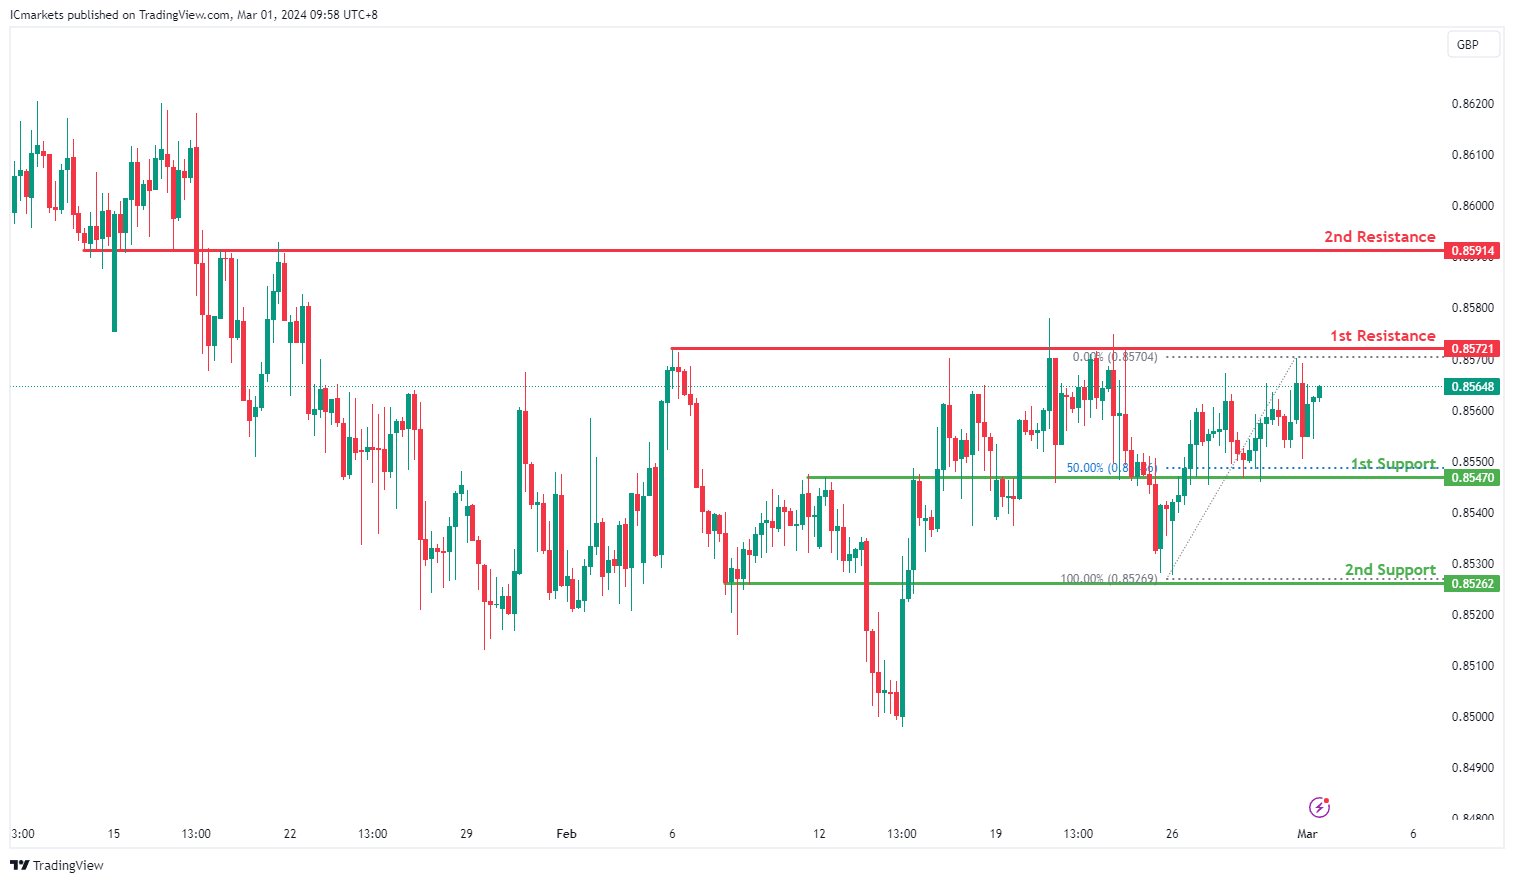
EUR/GBP:
The EUR/GBP chart currently demonstrates bullish momentum, suggesting a potential scenario of a bullish continuation towards the 1st resistance.
The 1st support level at 0.8547 is identified as an overlap support, indicating its historical significance as a level where buying interest has previously emerged, further reinforced by its alignment with the 50% Fibonacci Retracement level.
Moreover, the 2nd support at 0.8526 is also characterized as an overlap support, providing additional confirmation of potential support for the price.
On the resistance side, the 1st resistance level at 0.8572 is identified as a multi-swing high resistance, suggesting its historical importance as a barrier where selling pressure may increase, potentially limiting upward movement.
Additionally, the 2nd resistance at 0.8591 is noted as an overlap resistance, further solidifying its significance as a level where selling interest may intensify.
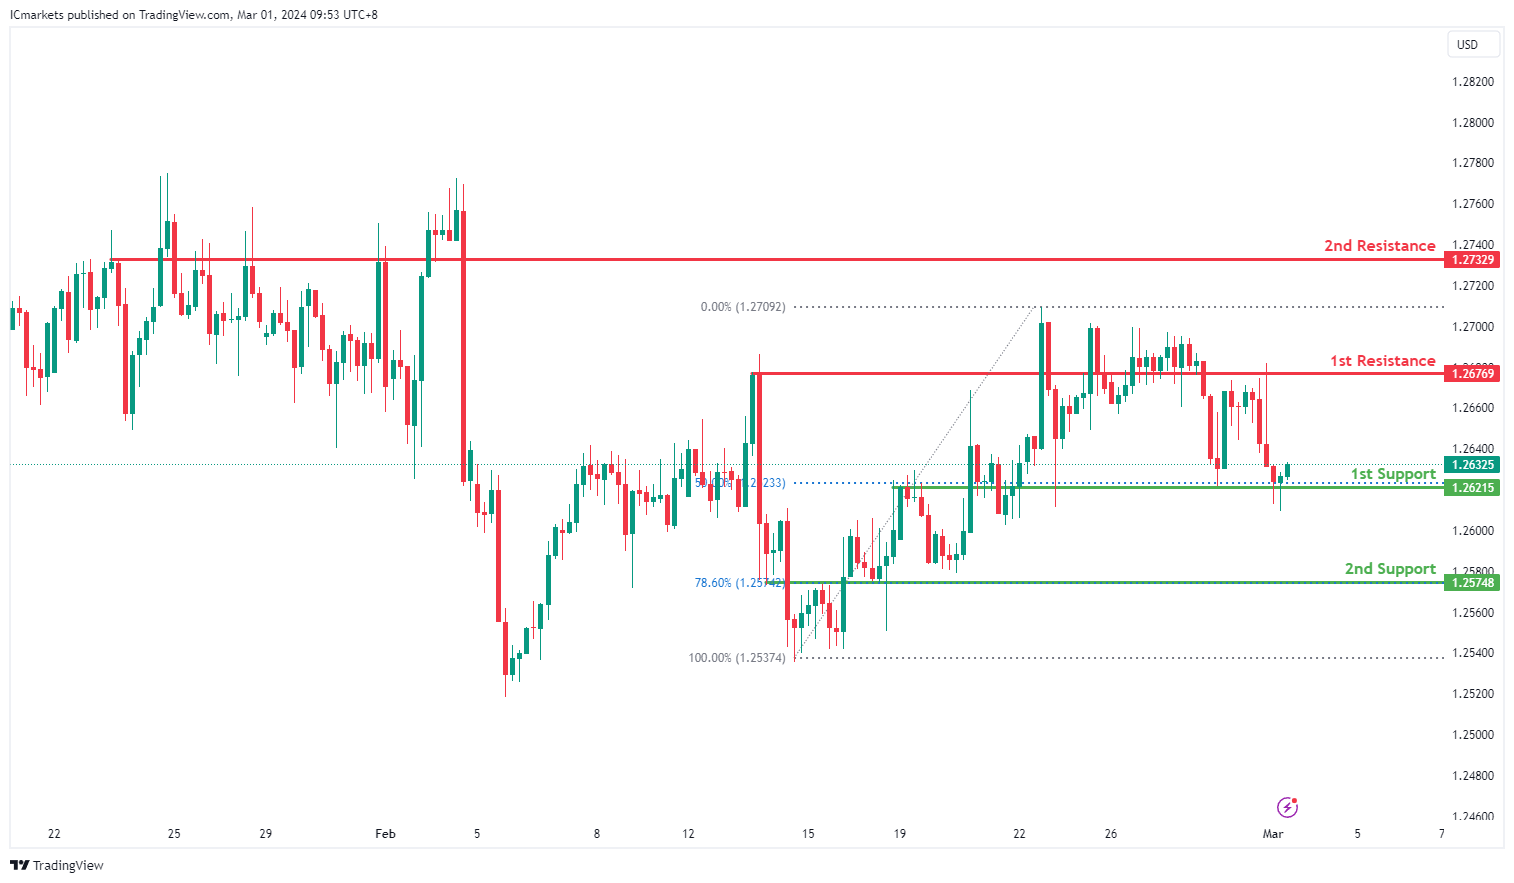
GBP/USD:
The GBP/USD chart indicates bullish momentum, suggesting a potential bullish bounce off the 1st support level towards the 1st resistance.
The 1st support at 1.2621 is significant as an overlap support, indicating its historical relevance as a level where buying interest has previously emerged to support the price. This level may attract buyers looking for opportunities to enter long positions.
Furthermore, the 2nd support at 1.2574 is characterized as an overlap support and coincides with the 78.60% Fibonacci retracement level, adding further significance to this support zone. It reinforces the potential for a bounce as historical buying interest aligns with Fibonacci retracement levels.
On the resistance side, the 1st resistance level at 1.2676 is identified as an overlap resistance, suggesting its historical significance as a barrier where selling pressure may increase, potentially limiting upward movement in the short term.
Additionally, the 2nd resistance at 1.2732 is noted as a pullback resistance, indicating its potential to act as a level where selling pressure may intensify, possibly leading to a temporary halt or reversal in price movement.
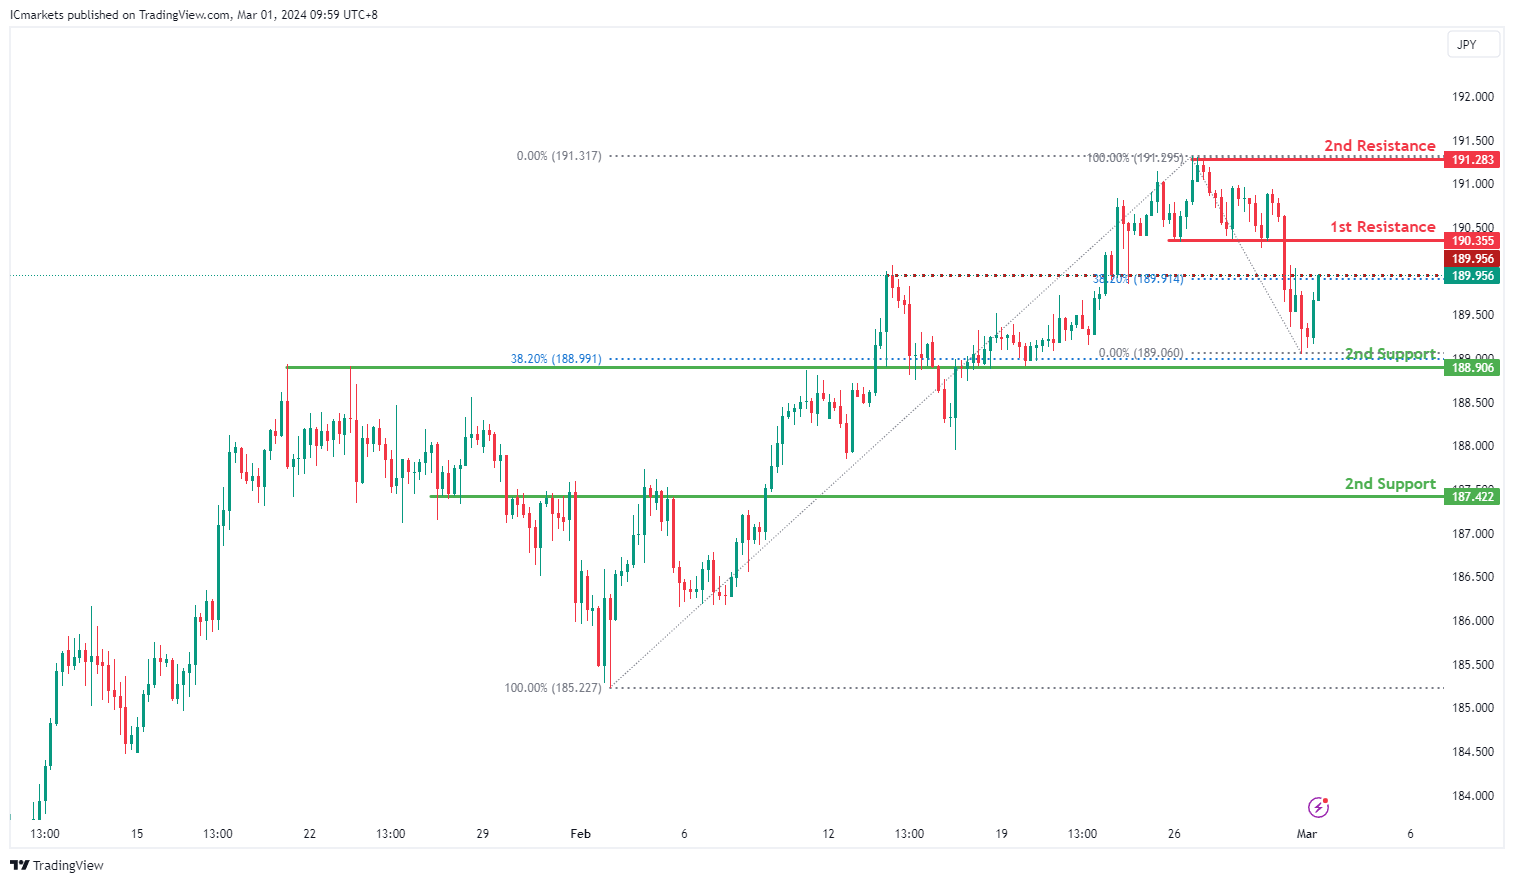
GBP/JPY:
The GBP/JPY chart currently exhibits bearish momentum, suggesting a potential scenario of a rise towards the 1st resistance in the short term before reversing off it and dropping towards the 1st support.
The 1st support level at 188.80 is identified as an overlap support, coinciding with the 38.20% Fibonacci Retracement level, which historically indicates a level where buying interest has emerged, offering potential support for the price.
Furthermore, the 2nd support at 187.42 is characterized as a pullback support, reinforcing its significance as a level where buyers have historically intervened to prevent further decline.
On the resistance side, the 1st resistance level at 190.35 is identified as a pullback resistance, suggesting its historical importance as a barrier where selling pressure may increase, potentially limiting upward movement in the short term.
Additionally, the 2nd resistance at 191.28 is noted as a multi-swing high resistance, further solidifying its significance as a level where selling interest may intensify.
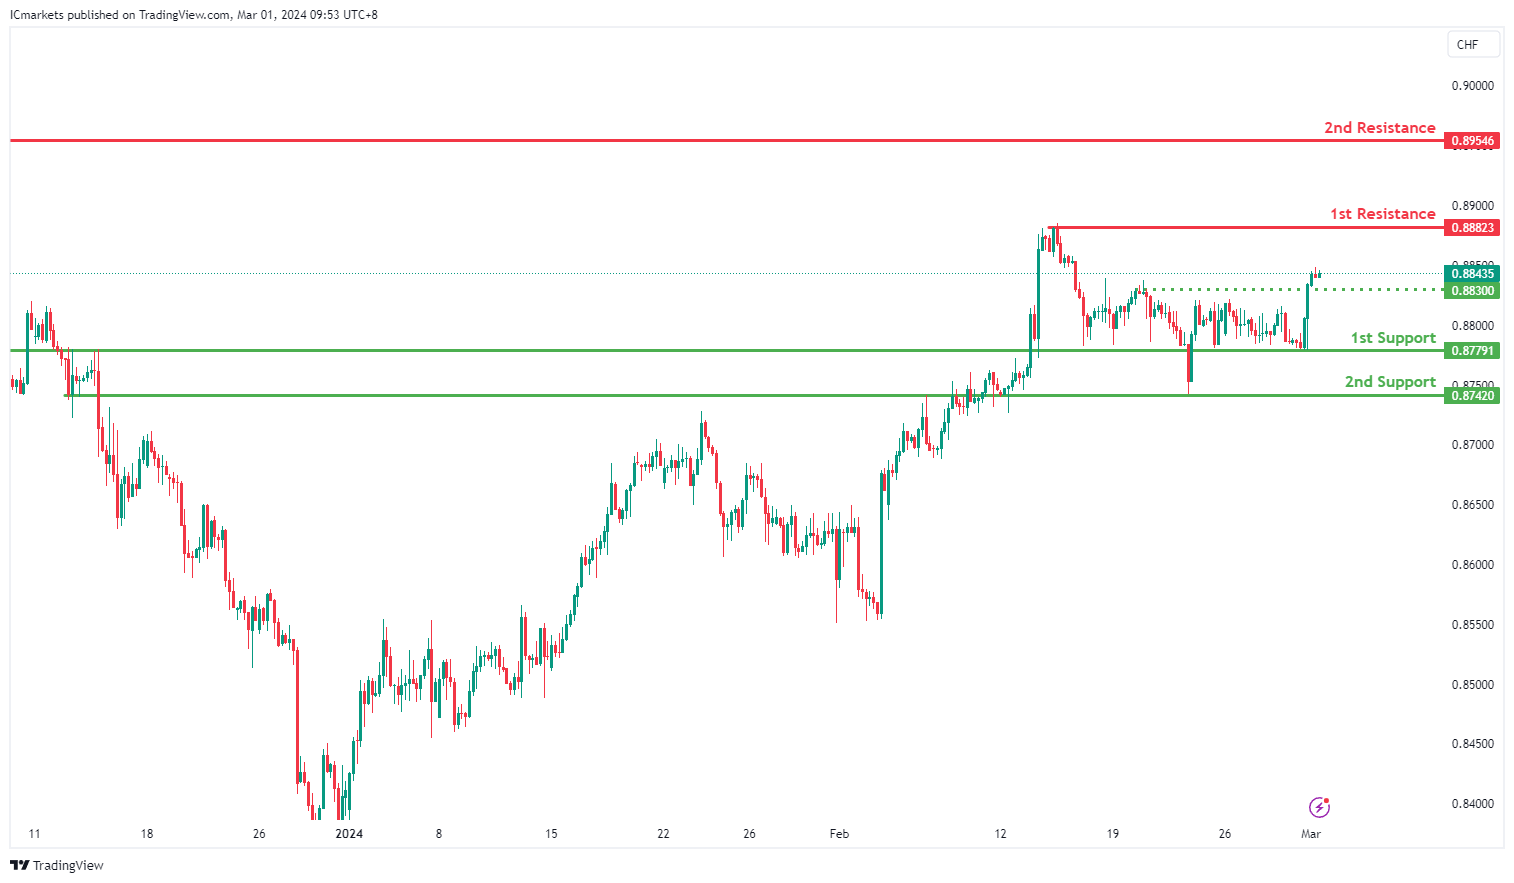
USD/CHF:
The USD/CHF chart indicates bullish momentum, suggesting a potential bullish continuation towards the 1st resistance level.
The 1st support at 0.8779 is significant as an overlap support, indicating its historical relevance as a level where buying interest has previously emerged to support the price. This level may attract buyers looking for opportunities to enter long positions.
Furthermore, the 2nd support at 0.8742 is also characterized as an overlap support, reinforcing its importance as a level where buyers have historically intervened to prevent further decline. This level provides additional confirmation of potential support.
On the resistance side, the 1st resistance level at 0.8823 is identified as a swing high resistance, suggesting its historical significance as a barrier where selling pressure may increase, potentially limiting upward movement in the short term.
Additionally, the 2nd resistance at 0.8954 is noted as a pullback resistance, indicating its potential to act as a level where selling pressure may intensify, possibly leading to a temporary halt or reversal in price movement.
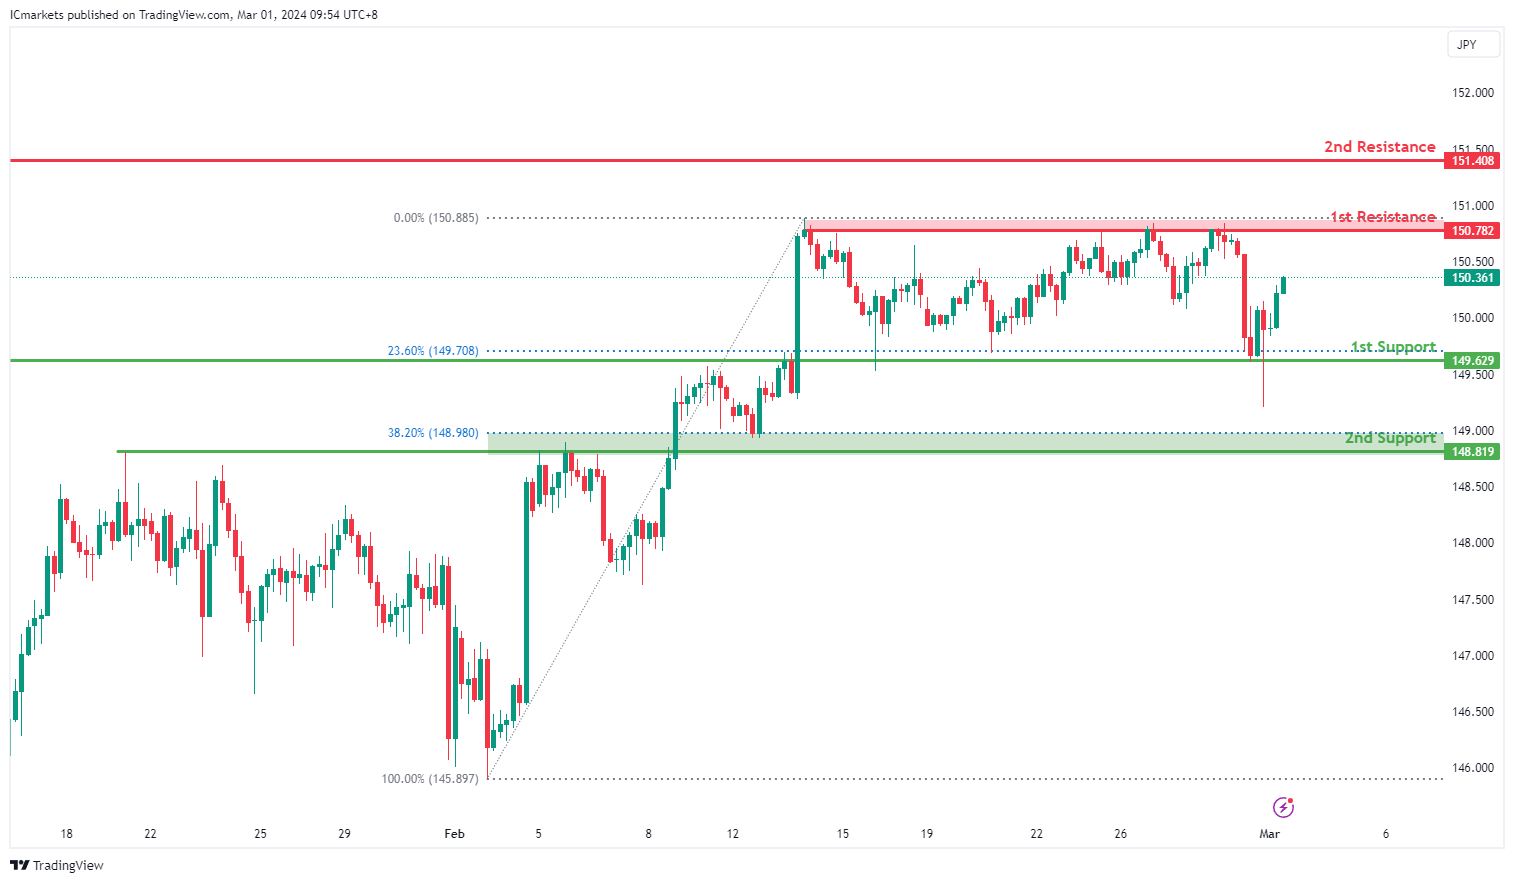
USD/JPY:
The USD/JPY chart reflects bullish momentum, suggesting a potential bullish continuation towards the 1st resistance level.
The 1st support at 149.62 is notable as an overlap support, indicating its historical significance as a level where buying interest has previously emerged, potentially providing support for the price. This level aligns with the 23.60% Fibonacci Retracement, adding to its significance as a potential support area.
Additionally, the 2nd support at 148.81 is identified as an overlap support, further reinforcing its importance as a level where buyers may step in to prevent further decline. This level corresponds to the 38.20% Fibonacci Retracement, providing additional confirmation of potential support.
On the resistance side, the 1st resistance level at 150.78 is characterized as a multi-swing high resistance, suggesting its historical significance as a level where selling pressure may increase, potentially limiting upward movement in the short term.
Furthermore, the 2nd resistance at 151.40 is noted as a swing high resistance, indicating its potential to act as a barrier where selling interest may intensify, possibly leading to a temporary halt or reversal in price movement.
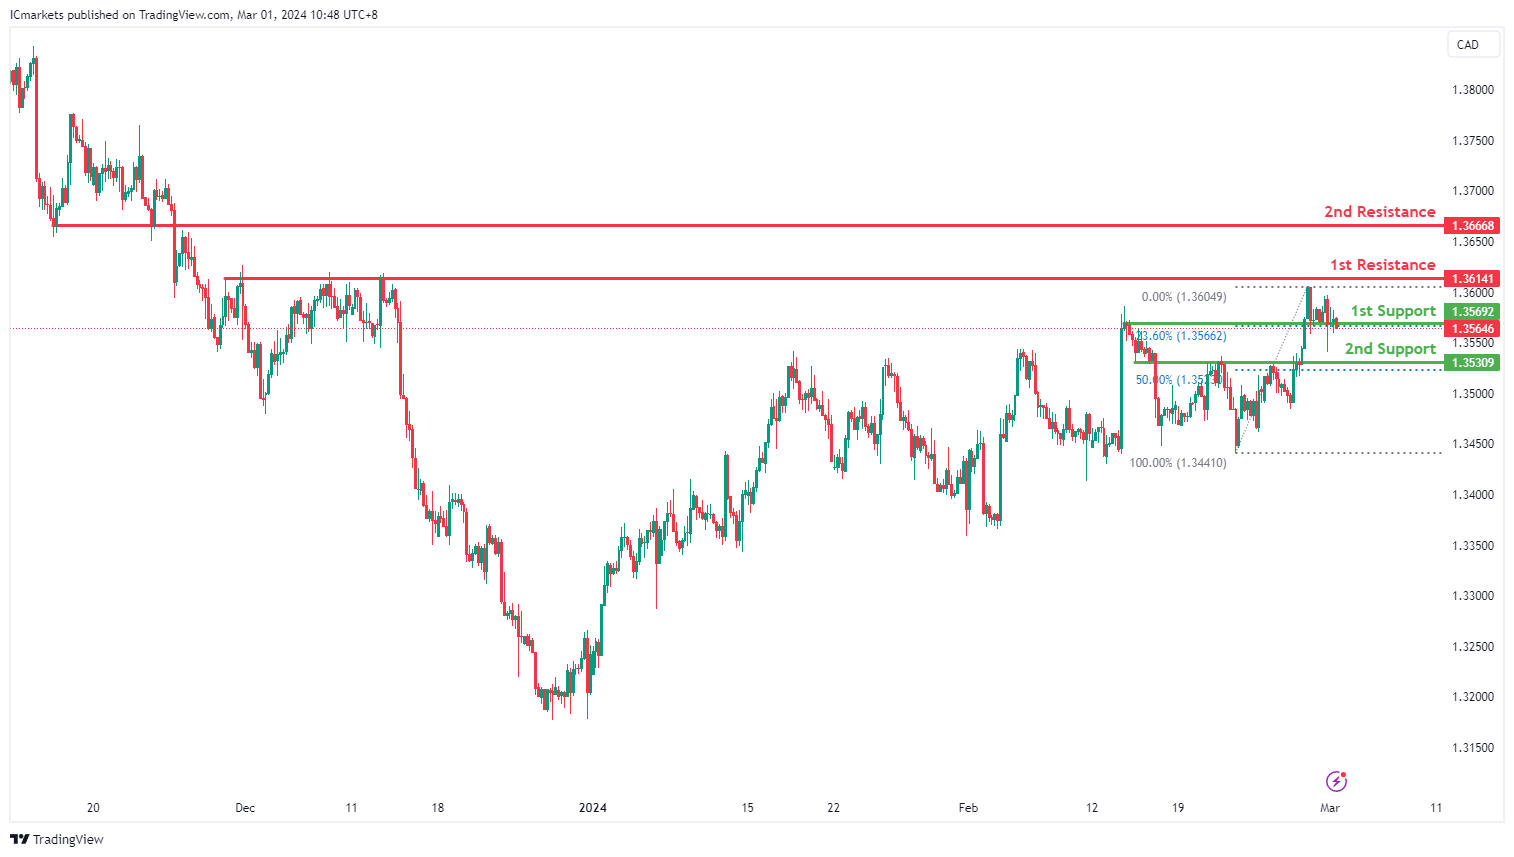
USD/CAD:
The USD/CAD chart currently exhibits an overall bearish momentum. In this context, there is a potential scenario for price to break below the 1st support and drop towards the 2nd support.
The 1st support level at 1.3569 is identified as an overlap support that aligns with the 23.60% Fibonacci retracement level. Further below, the 2nd support level at 1.3530 is also marked as an overlap support that aligns close to the 50.00% Fibonacci retracement level, reinforcing its significance as a key support level.
To the upside, the 1st resistance level at 1.3614 is identified as a pullback resistance. Higher up, the 2nd resistance level at 1.3666 is also marked as a pullback resistance, further highlighting its importance as a potential resistance zone.
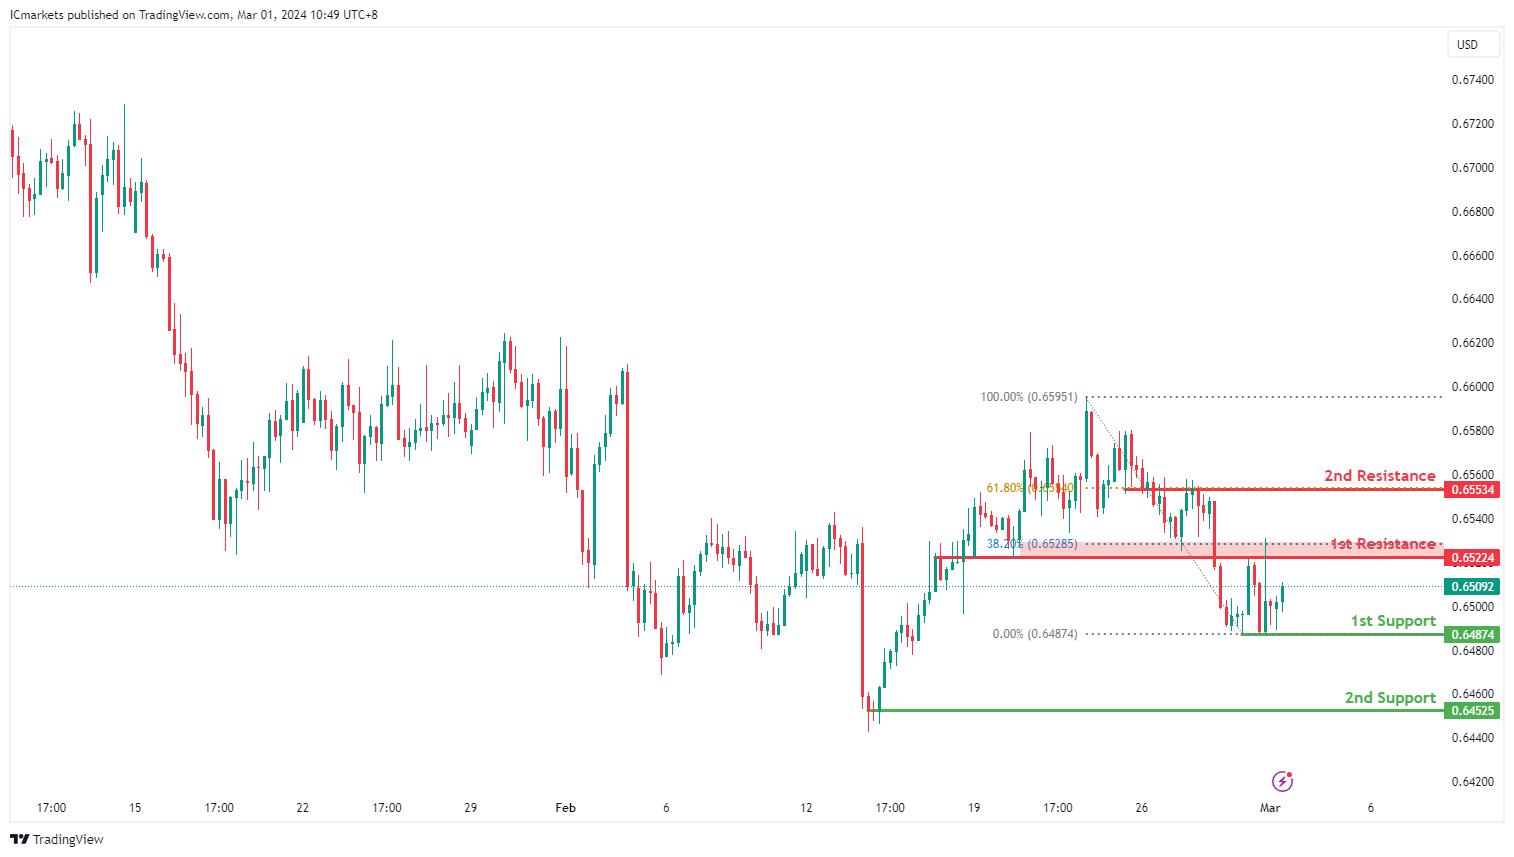
AUD/USD:
The AUD/USD chart currently exhibits an overall bearish momentum. However, there is a potential scenario for price to rise towards the 1st resistance before resuming the downtrend.
The 1st resistance level at 0.6522 is identified as an overlap resistance that aligns close to the 38.20% Fibonacci Retracement level. Higher up, the 2nd resistance level at 0.6553 is also noted as an overlap resistance that aligns with the 61.80% Fibonacci Retracement level, further highlighting its importance as a potential resistance zone.
To the downside, the 1st support level at 0.6487 is identified as a pullback support. Further below, the 2nd support level at 0.6452 is also marked as a pullback support, further emphasizing its importance as a potential support zone.
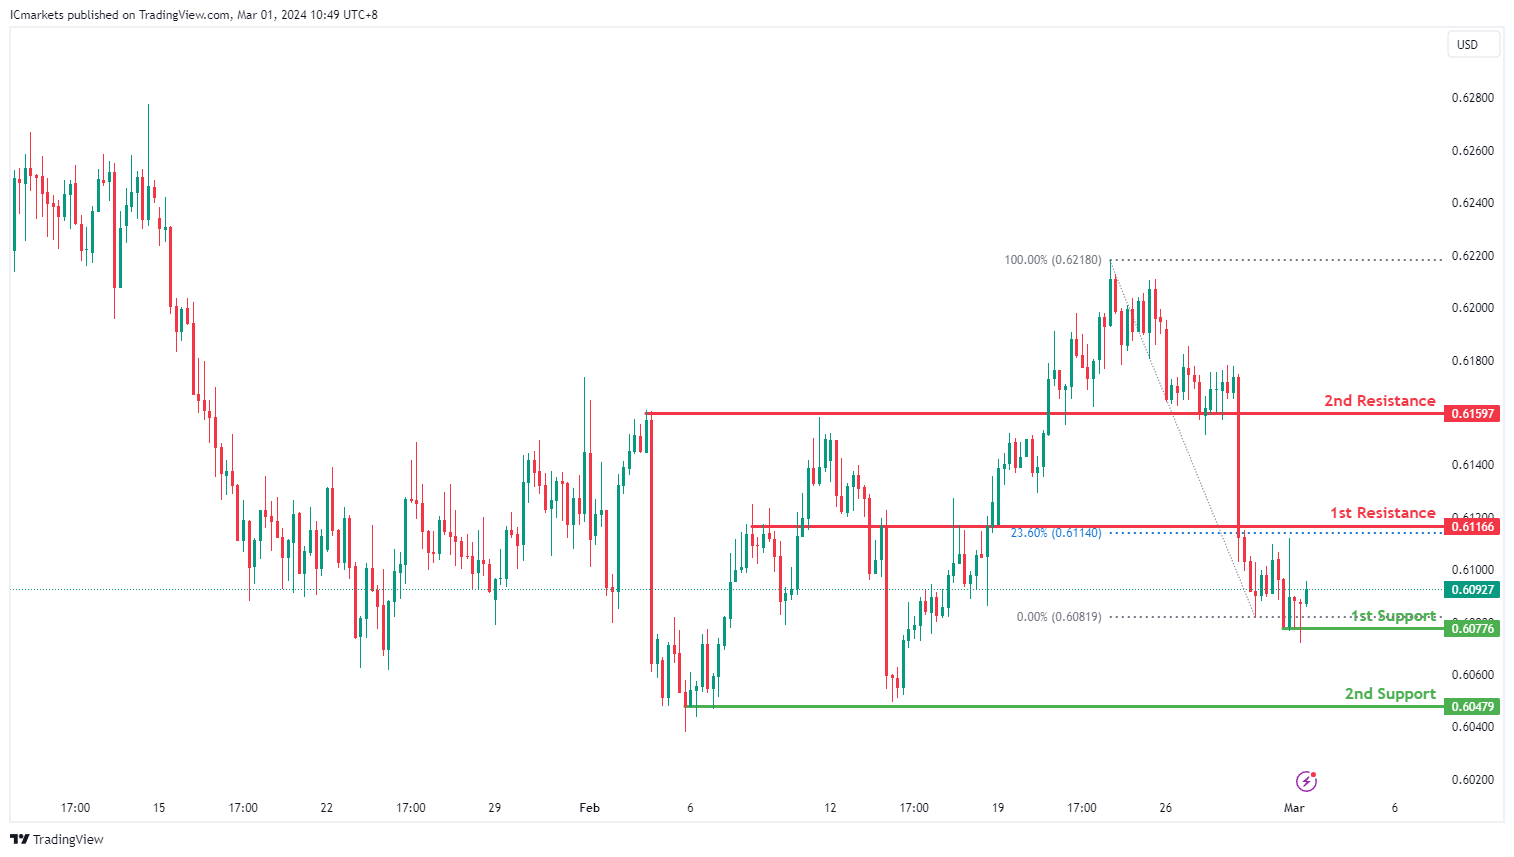
NZD/USD
The NZD/USD chart currently exhibits an overall bearish momentum. However, there is a potential scenario for price to rise towards the 1st resistance before resuming the downtrend.
The 1st resistance level at 0.6116 is identified as an overlap resistance that aligns with the 23.60% Fibonacci Retracement level. Higher up, the 2nd resistance level at 0.6159 is also noted as an overlap resistance, further highlighting its importance as a potential resistance zone.
To the downside, the 1st support level at 0.6077 is identified as a pullback support. Further below, the 2nd support level at 0.6047 is also marked as a pullback support, further emphasizing its importance as a potential support zone.
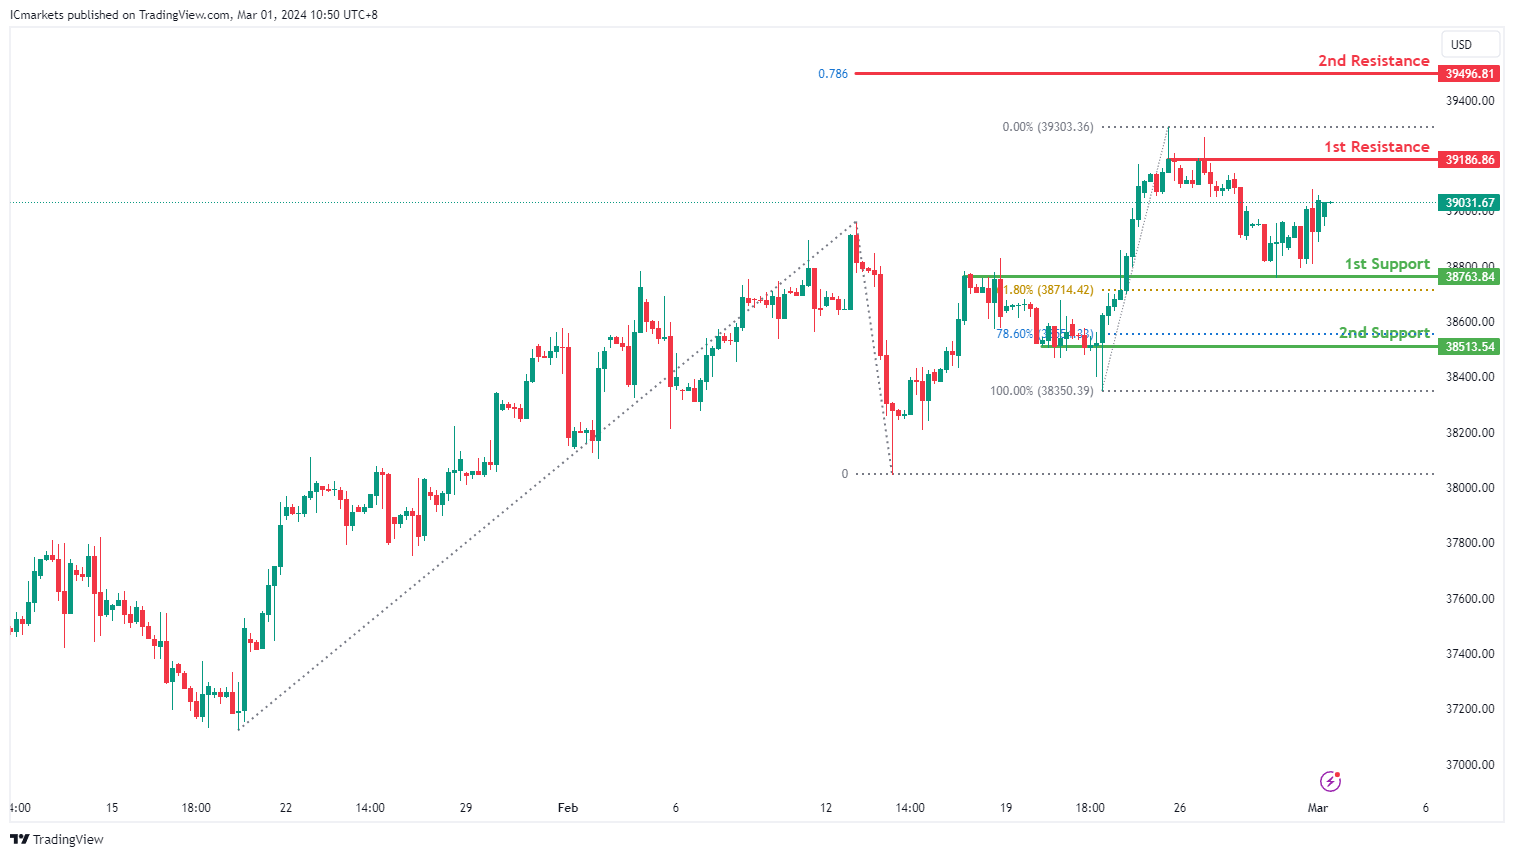
DJ30:
The DJ30 chart currently exhibits an overall bullish momentum. In this context, there is a potential scenario for price to make a bullish continuation towards the 1st resistance.
The 1st resistance level at 39,186.86 is identified as a pullback resistance. Higher up, the 2nd resistance level at 39,496.81 is noted as a resistance that aligns with the 78.60% Fibonacci Projection level, adding to its significance as a potential barrier to further bullish movement.
On the support side, the 1st support level at 38,763.84 is identified as an overlap support that aligns close to the 61.80% Fibonacci Retracement level. Further below, the 2nd support at 38,513.54 is marked as a pullback support that aligns close to the 78.60% Fibonacci Retracement level, further reinforcing its significance as a potential level of support.
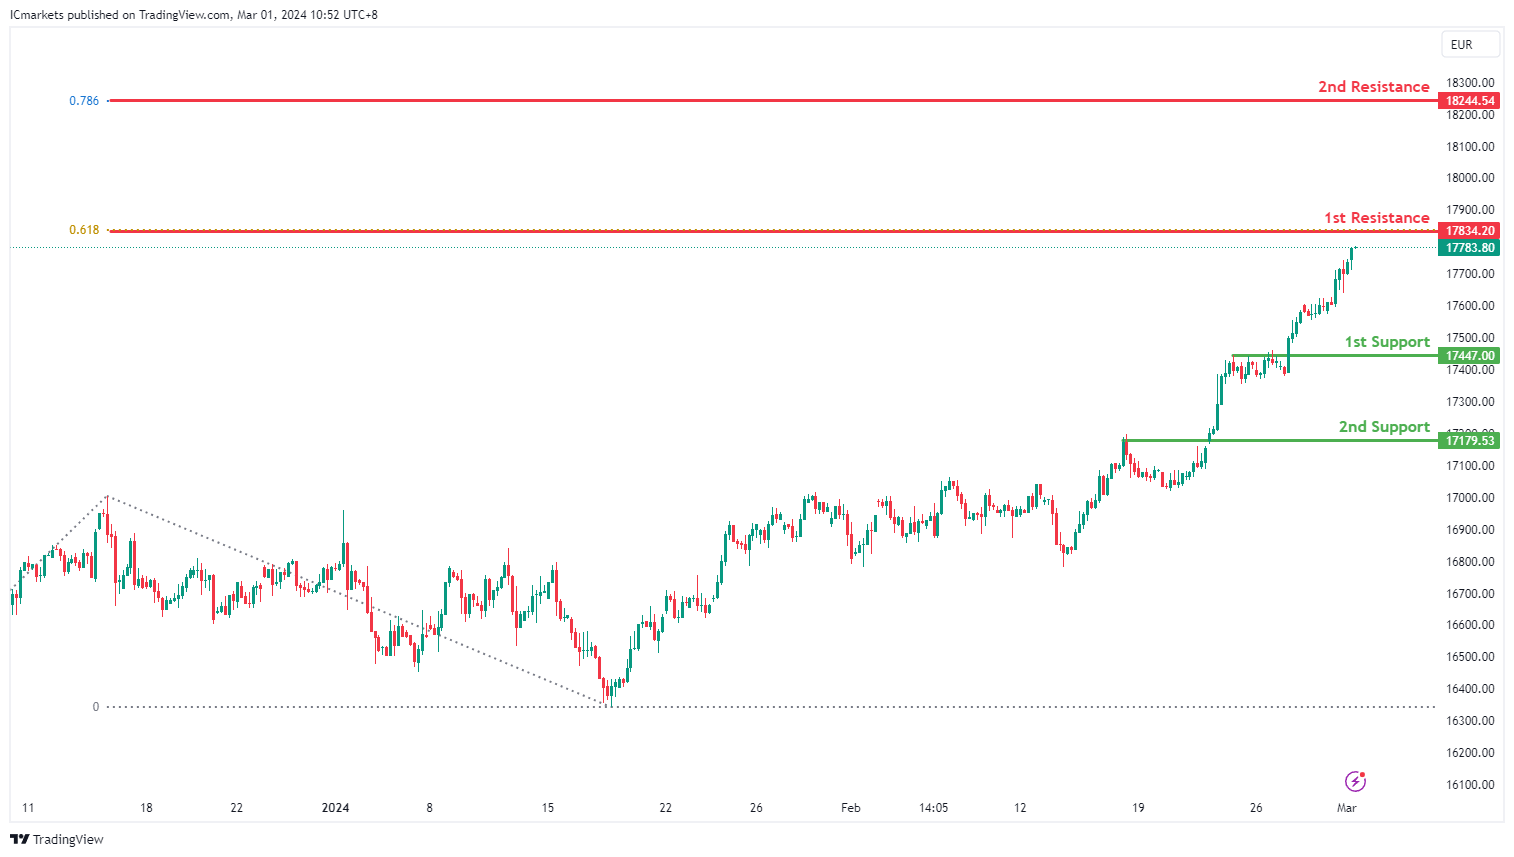
GER40:
The GER40 chart currently demonstrates an overall bullish momentum, suggesting a potential continuation of the upward trend towards the 1st resistance.
The 1st resistance level at 17,834.20 is identified as a resistance that aligns with the 61.80% Fibonacci Projection level. Higher up, the 2nd resistance level at 18,244.54 is marked as a resistance that aligns with the 78.60% Fibonacci Projection level, adding to its significance as a potential barrier to further bullish movement.
On the support side, the 1st support level at 17,447.00 is identified as a pullback support. Additionally, the 2nd support level at 17,179.53 is also noted as a pullback support, further reinforcing its importance as a potential area of support.
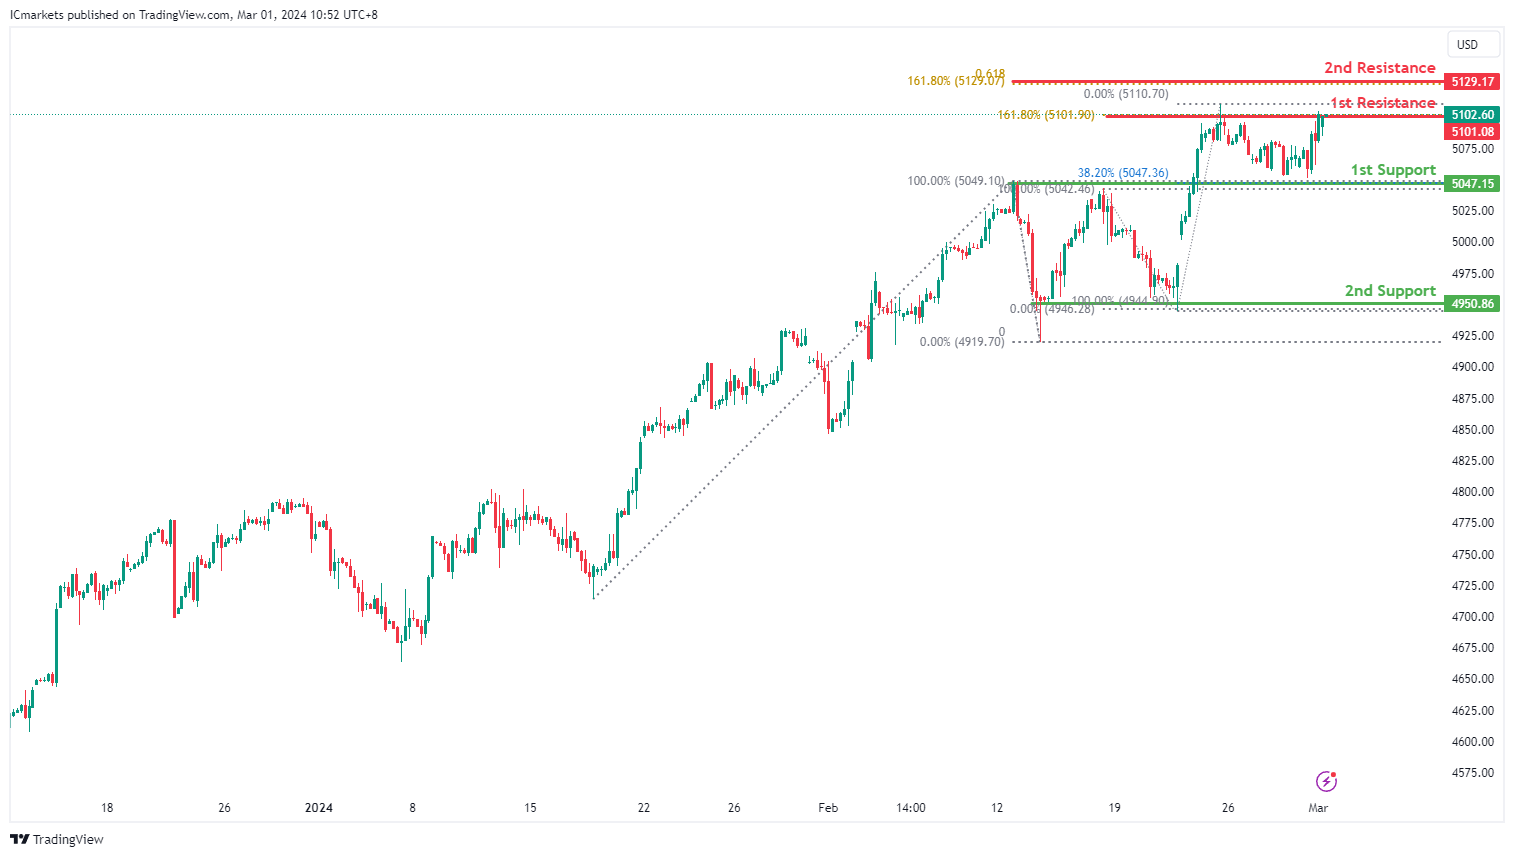
US500:
The US500 chart currently demonstrates an overall bullish momentum. In this context, there is a potential scenario for price to break above the 1st resistance and rise towards the 2nd resistance.
The 1st resistance level at 5,101.08 is identified as a pullback resistance that aligns with the 161.80% Fibonacci Extension level. Higher up, the 2nd resistance level at 5,129.17 is noted as a resistance that aligns with a confluence of Fibonacci levels i.e. the 61.80% Projection and the 161.80% Extension, adding to its significance as a potential barrier to further bullish movement.
On the support side, the 1st support level at 5,047.15 is identified as an overlap support that aligns with the 38.20% Fibonacci Retracement level. Further below, the 2nd support level at 4,950.86 is marked as a pullback support, further reinforcing its significance as a potential area of support.
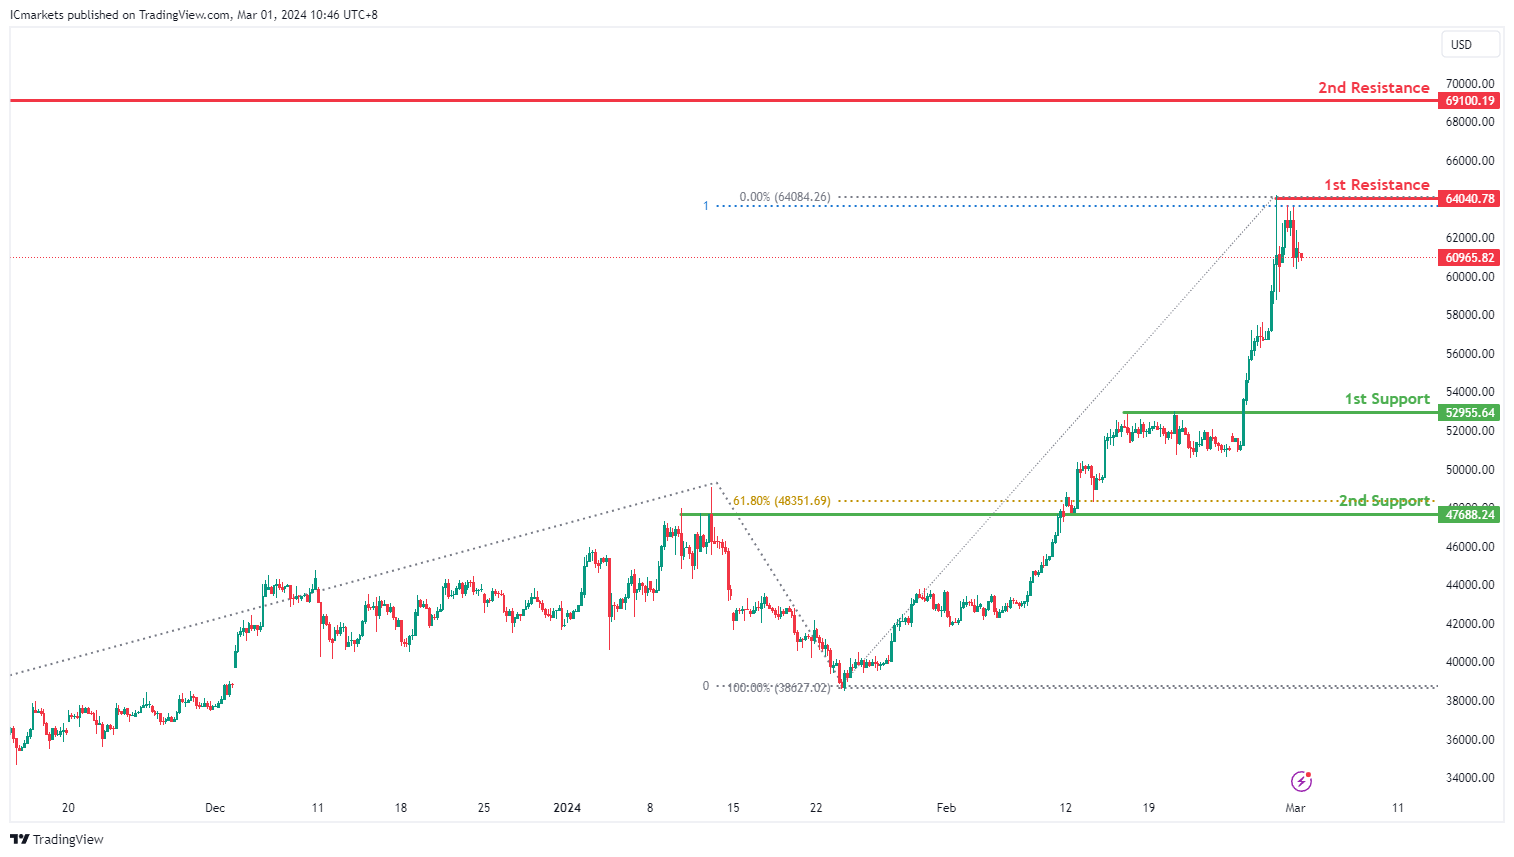
BTC/USD:
The BTC/USD chart currently demonstrates an overall bullish momentum, suggesting a potential continuation of the upward trend towards the 1st resistance.
The 1st resistance level at 64,040.78 is identified as a pullback resistance that aligns with the 100.00% Fibonacci Projection level. Higher up, the 2nd resistance level at 69,100.19 is noted as a swing-high resistance at the all-time high, adding to its significance as a potential barrier to further bullish movement.
On the support side, the 1st support level at 52,955.64 is identified as a pullback support. Further below, the 2nd support level at 47,688.24 is marked as an overlap support that aligns close to the 61.80% Fibonacci Retracement level, further reinforcing its significance as a potential area of support.
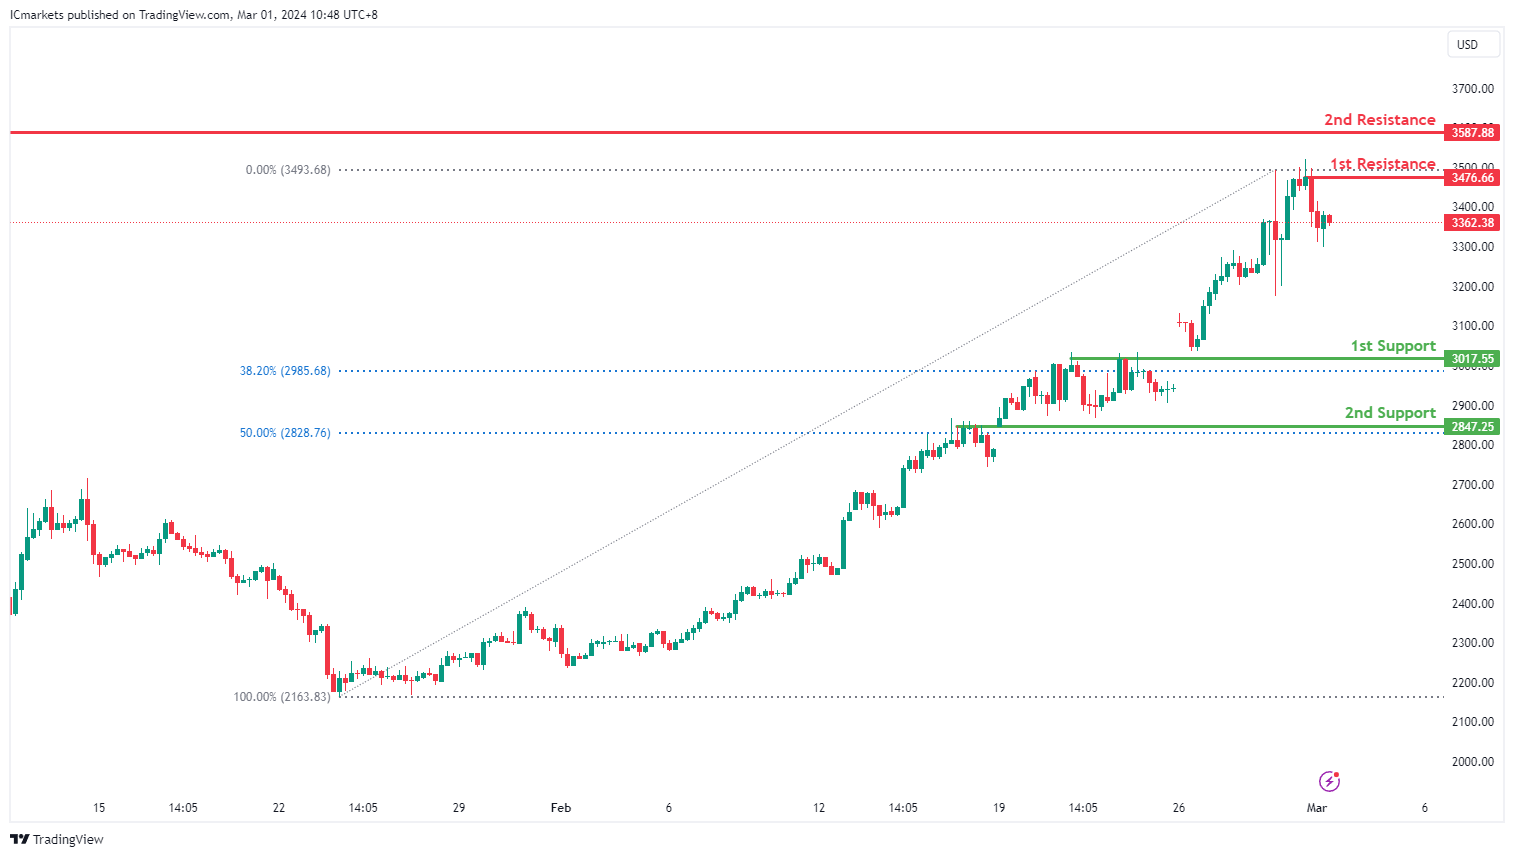
ETH/USD:
The ETH/USD chart currently demonstrates an overall bullish momentum, suggesting a potential continuation of the upward trend towards the 1st resistance.
The 1st resistance level at 3,476.66 is identified as a pullback resistance. Higher up, the 2nd resistance level at 3,587.88 is noted as an overlap resistance, adding to its significance as a potential barrier to further bullish movement.
On the support side, the 1st support level at 3,017.55 is identified as an overlap support that aligns close to the 38.20% Fibonacci Retracement level. Further below, the 2nd support level at 2,847.25 is also marked as an overlap support that aligns with the 50.00% Fibonacci Retracement level, further reinforcing its significance as a potential area of support.
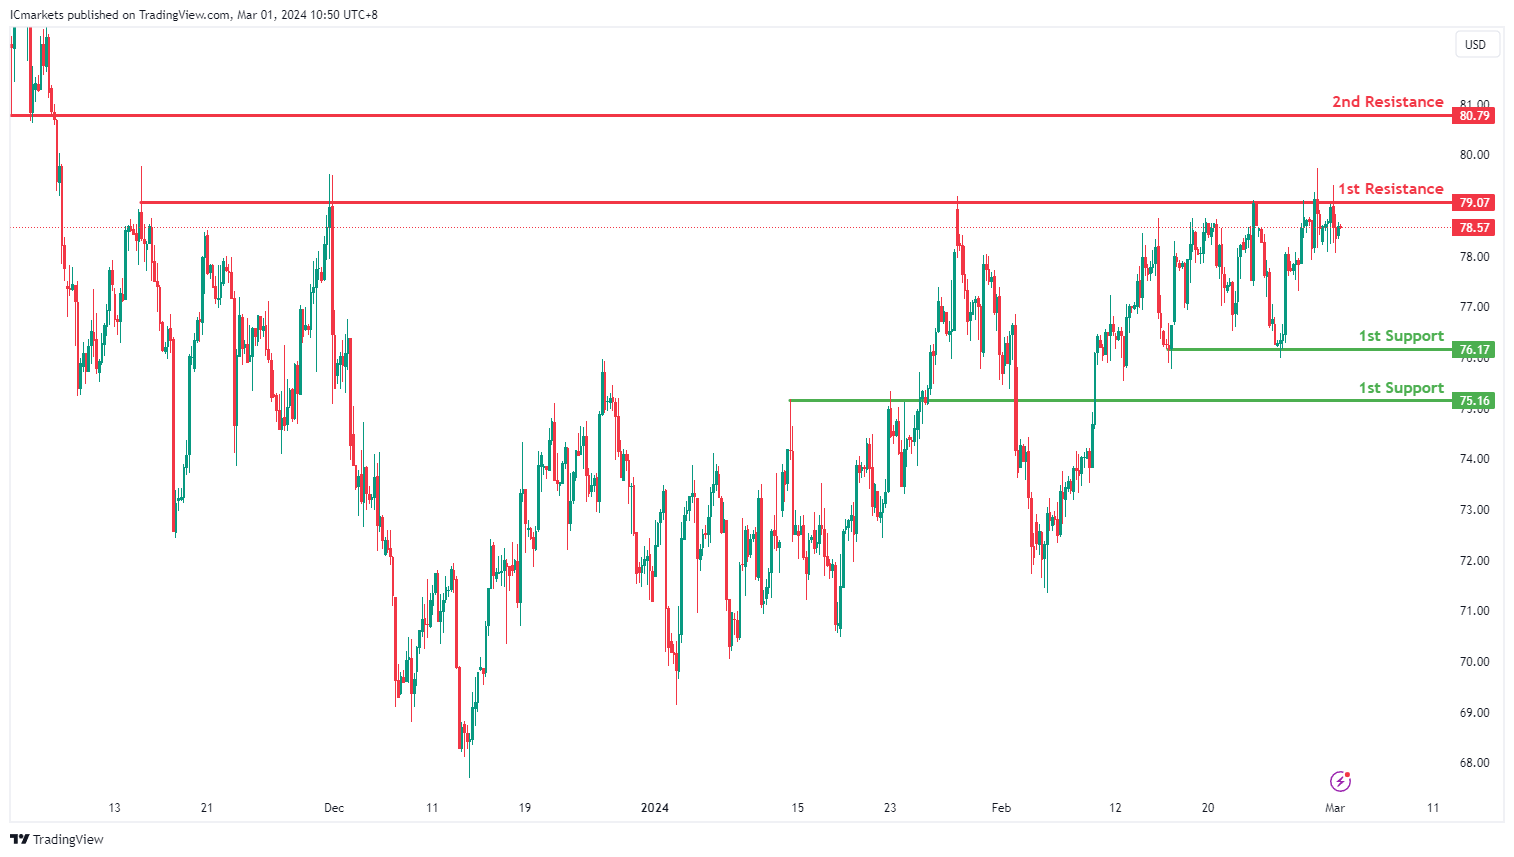
WTI/USD:
The WTI (West Texas Intermediate) chart currently exhibits a neutral bias. In this context, there is a potential scenario for price to fluctuate between the 1st support and the 1st resistance.
The 1st resistance level at 79.07 is identified as a multi-swing-high resistance. Higher up, the 2nd resistance level at 80.79 is marked as a pullback resistance, further highlighting its importance as a potential resistance zone.
To the downside, the 1st support level at 76.17 is identified as a pullback support. Further below, the 2nd support level at 75.16 is also marked as a pullback support, reinforcing its significance as a key support level.
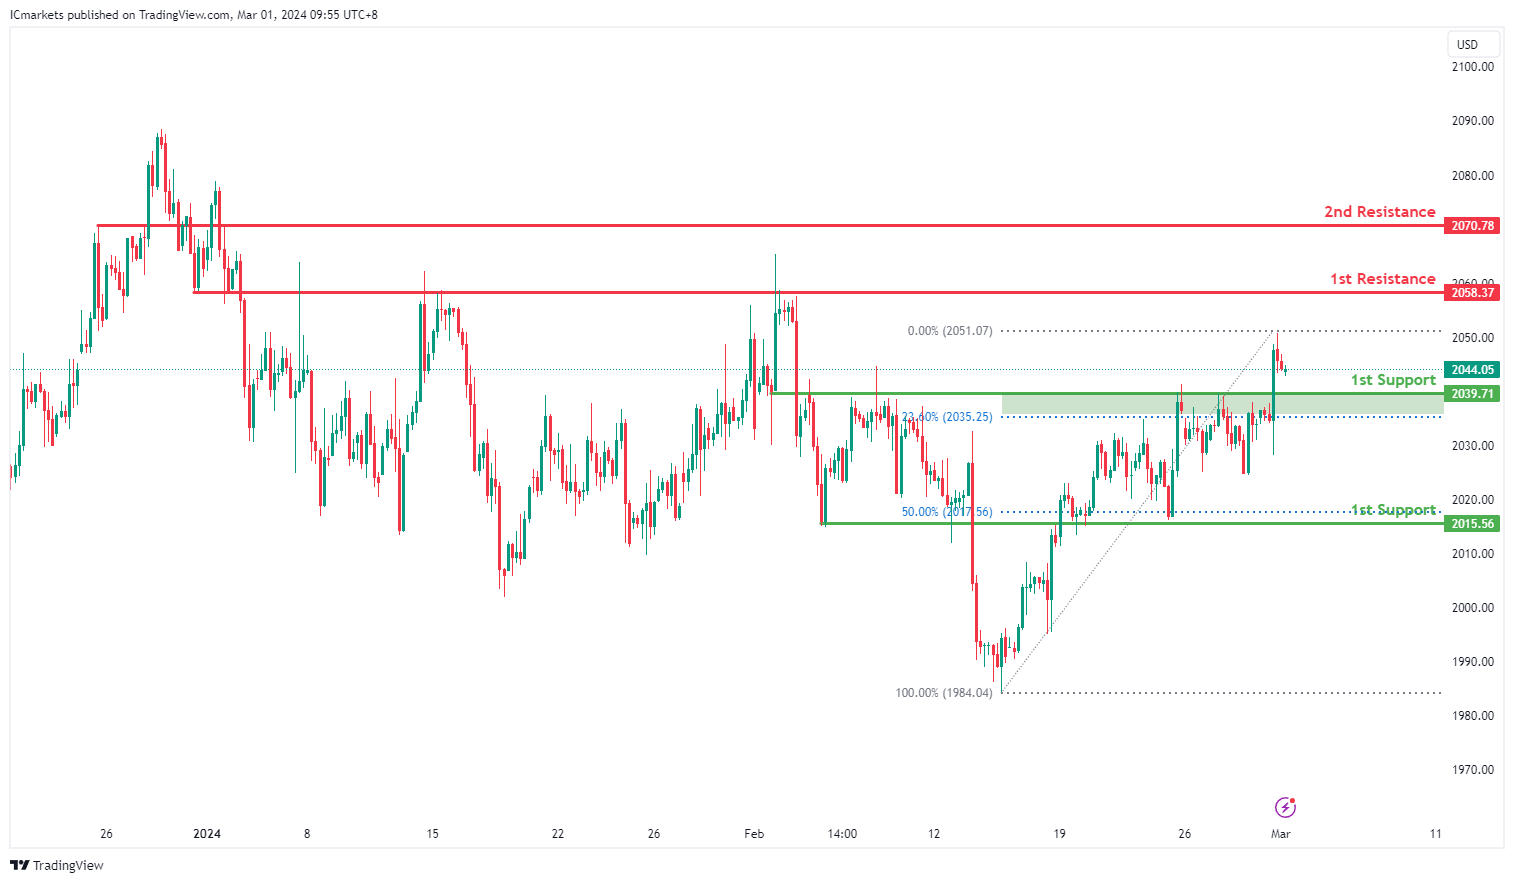
XAU/USD (GOLD):
The XAUUSD chart indicates bullish momentum, with a potential scenario of a short-term drop to the 1st support level before bouncing and rising towards the 1st resistance level.
The 1st support level at 2039.71 is considered a pullback support, aligning with the 23.60% Fibonacci Retracement. This level has historical significance as a point where buyers have previously entered the market, potentially providing support to the price.
Additionally, the 2nd support at 2015.56 is identified as an overlap support and coincides with the 50% Fibonacci Retracement. This further strengthens its potential as a significant level of support where buying interest may emerge.
On the resistance side, the 1st resistance level at 2058.37 is characterized as an overlap resistance, indicating its historical significance as a barrier where selling pressure may increase, potentially limiting upward movement in the short term.
Furthermore, the 2nd resistance at 2070.78 is also identified as an overlap resistance, suggesting its potential to act as a significant level where selling interest may intensify, potentially capping the upward movement of prices.


