
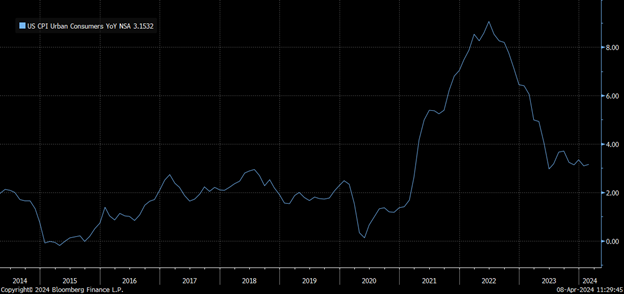
US Consumer Price Index – CPI
The US Consumer Price Index CPI Y/Y overall trend has been steadily declining after reaching its peak of 9.06% in June 2022. A drop in all CPI components, including Energy, Food, and Durable Goods Prices, mainly drove the decline. However, the decline stalled during the last quarter of 2023, and the index has been moving sideways since then as the changes in the Services sector remained almost unchanged throughout the entire time.
Core Services M/M peaked in January 2024 at a one-year high of 0.66%; however, it registered 0.457% for February 2024, a 30% decline. Core Services data M/M may be critical this week as investors will watch whether the declining trend will resume toward the pre-pandemic averages of 0.25%—0.35% or reverse and peak again. The index has been registering higher lows since June 2023. A change in the cost of services can be more meaningful if accompanied by a similar percentage change in other CPI components, such as Durable Goods prices. Oil prices have recently been rising, and it is logical to impact the overall production costs; although the increase in oil prices came slightly after the CPI reporting period, it may still have an impact. On the other hand, a stabilization for CPI data at its current levels can be seen as favorable by market participants as it should add another reason for the FED to consider interest rate cuts sooner rather than later.
CME FedWatch Tool
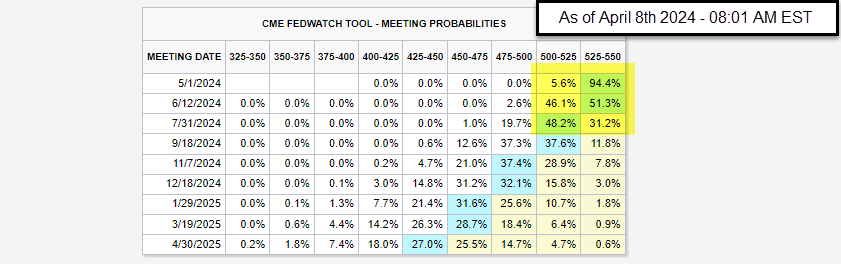
Source: CME Group – CME FedWatch Tool
According to the most recent review of the CME FedWatch tool, market participants anticipate two to three rate cuts between March 20th, 2024, and December 31st, 2024. The percentage of participants expecting rates to remain at their current 525-550 range for the meeting on May 1st, 2024, is 94.4%, down from 99.8%. The expectation for a 25-basis points rate cut for the May 1st meeting rose from 0.2% to 5.6%. As for the June 12th, 2024, Fed’s meeting, the percentage of a 25-basis points rate cut fell from 57.2% last week to 46.1%.
USDJPY Technical Analysis – 1 Hour Chart
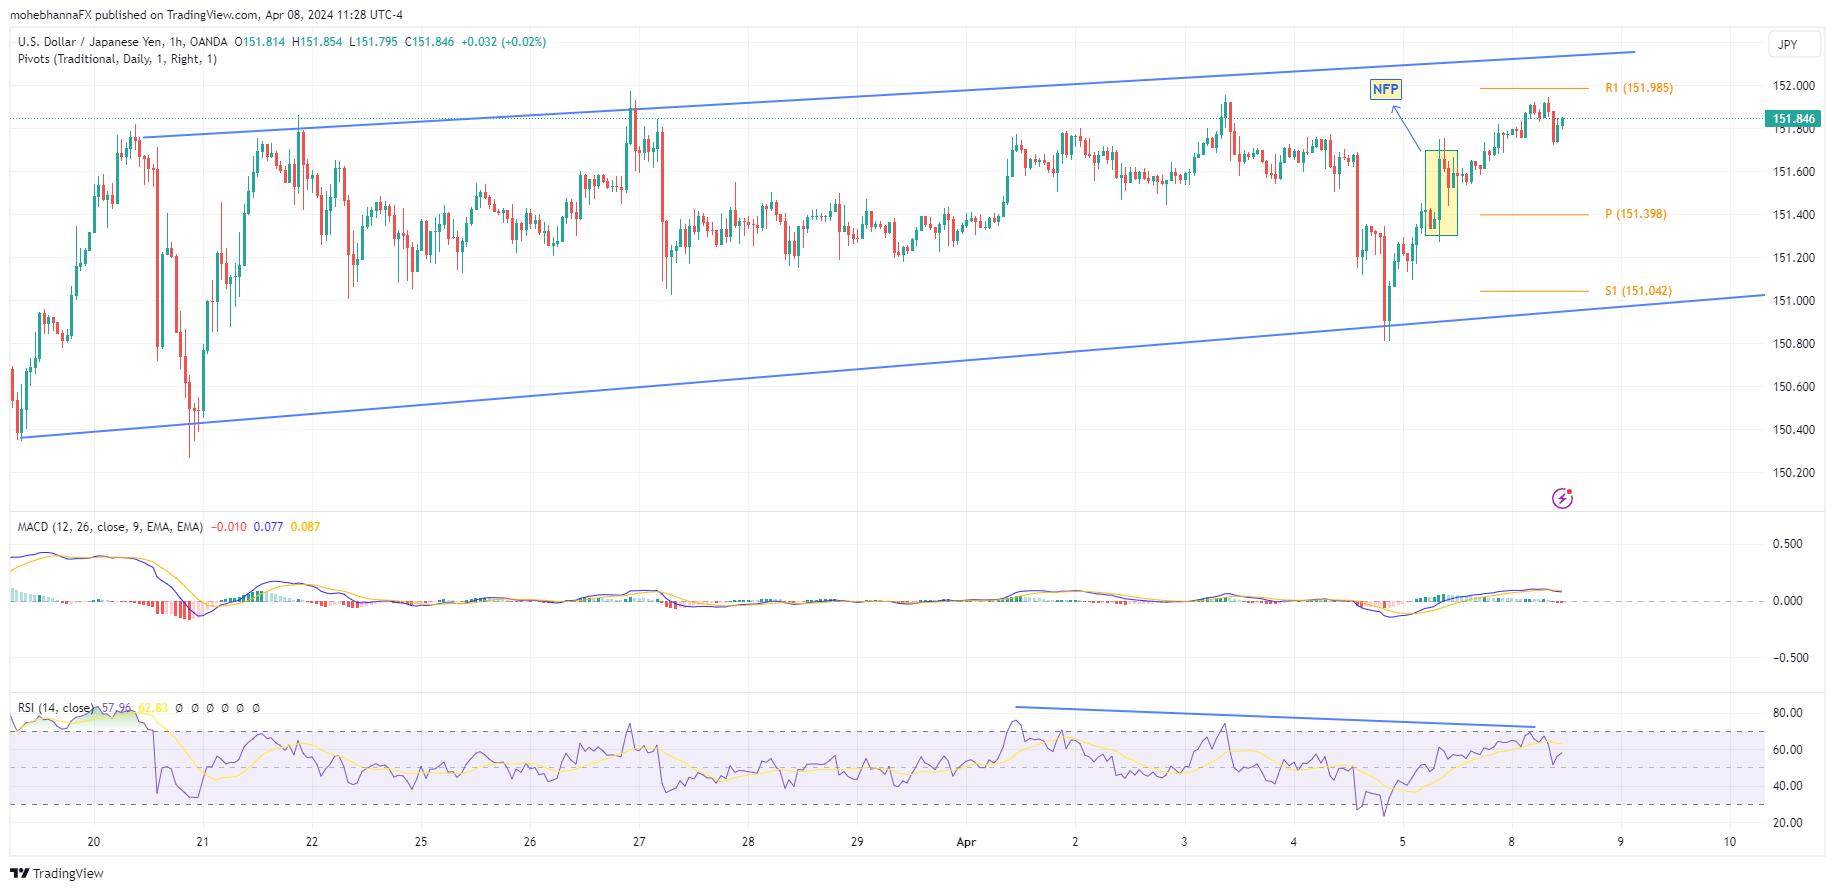
- Price action continues to trade within a trading range, which began in mid-March 2024.
- Multiple attempts to break above the range upper borders have failed so far; the upper range border intersects with R1 Standard calculations.
- The MACD line crossed below its signal line, and its histogram turned bearish after an extended coiling period.
- Market reaction for Friday, April 5th, 2024: NFP has faded for other currency pairs, such as EURUSD and USDAD; however, for USDJPY, this has not happened, thus adding more weight to the yellow highlighted candle, the candle low intersects with the daily pivot point forming a level of support to follow
- A slight negative divergence can be seen on RSI14 as price action makes higher highs while RSI makes lower highs.


