
- Stagflation risk has led to a softer US 10-year Treasury real yield below 2.38%.
- The 6% decline of Gold (XAU/USD) from its recent all-time high in April may have reached an inflection point to kickstart another potential medium-term impulsive bullish sequence.
- Watch the key short-term support of US$2,327 on Gold (XAU/USD).
Since our last publication, Gold (XAU/USD) has rallied by 2.5% and staged a bullish breakout above its 20-day moving average last Thursday, 9 May, and a positive follow-through at the start of this week as it inched higher today, 15 May with a current intraday high of $2,374 at this time of the writing.
Right now, it is just a whisker of 2.5% away from its current all-time high of US$2,431 printed recently on 12 April as market participants await another set of crucial economic data; US CPI and retail sales for April to gauge whether the odds have increase on the stagflation risk narrative that has been unfolding in the past three weeks.
Forward-looking survey-based economic data supports the risk of a stagflation
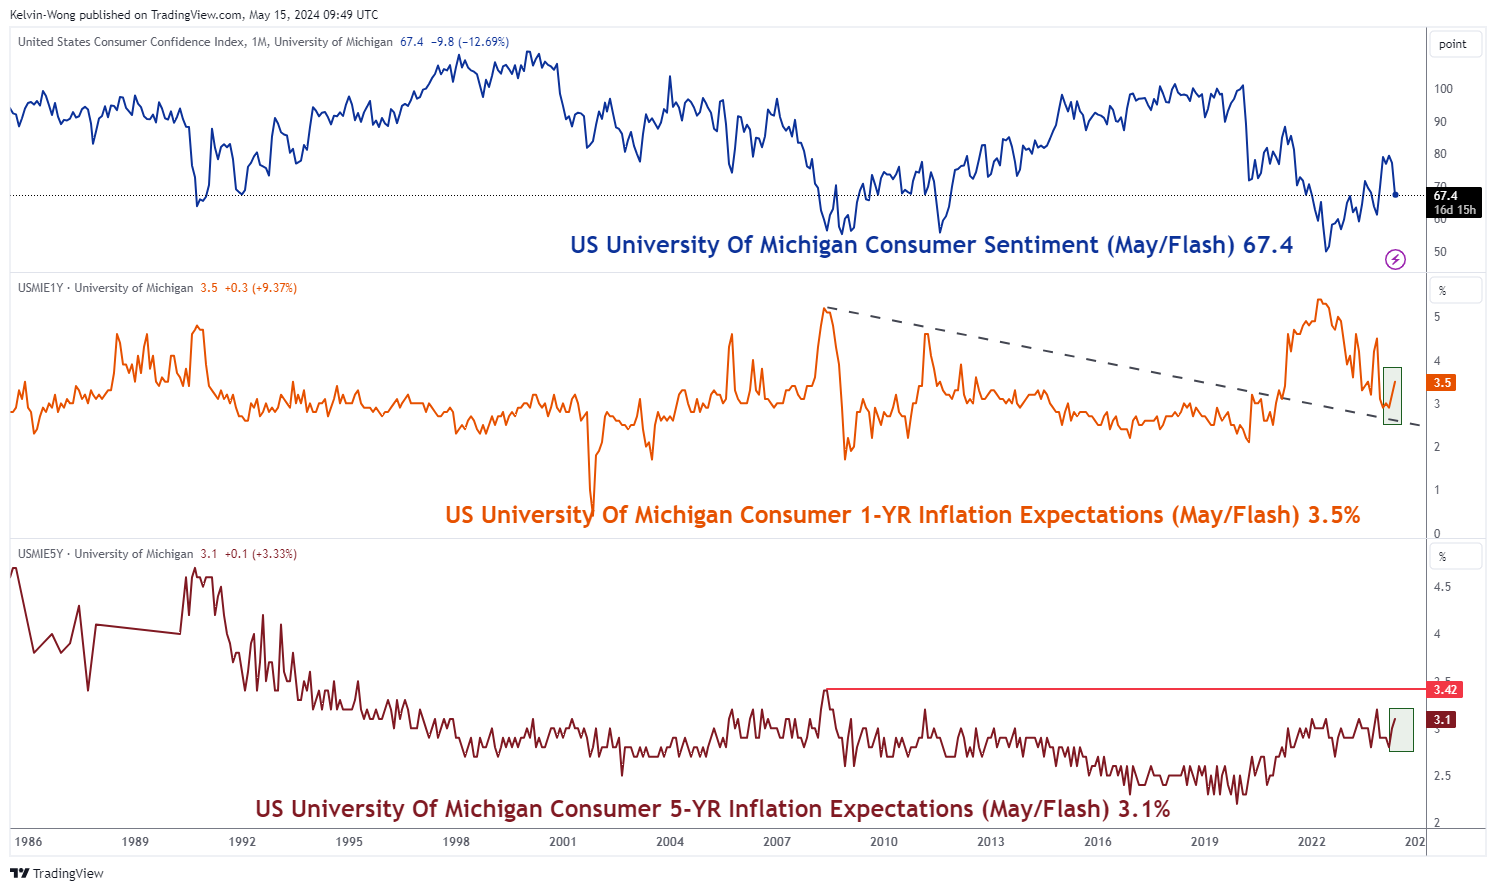
Fig 1: US University of Michigan Consumer Sentiment & Inflation Expectations data as of May 2024 (Source: TradingView, click to enlarge chart)
The latest preliminary US University of Michigan Consumer Survey for May released last Friday, 10 May has indicated a potential slowdown in consumer spending in the next few months as its consumer sentiment component has plunged to a six-month low of 67.4 from 77.2 recorded in April (see Fig 1).
Concurrently, the components of the 1-year and 5-year inflation expectations for May have risen to six-month highs of 3.5% y/y and 3.1% y/y respectively, lowering the chances of the consumer inflationary trend in the US to hit the Fed’s target of 2% in 2024.
This set of forward-looking survey-based economic data seems to foretell a potentially deadly concoction of stagflation.
A potential slow-down in consumer spending led to softness in longer-term US Treasury real yields
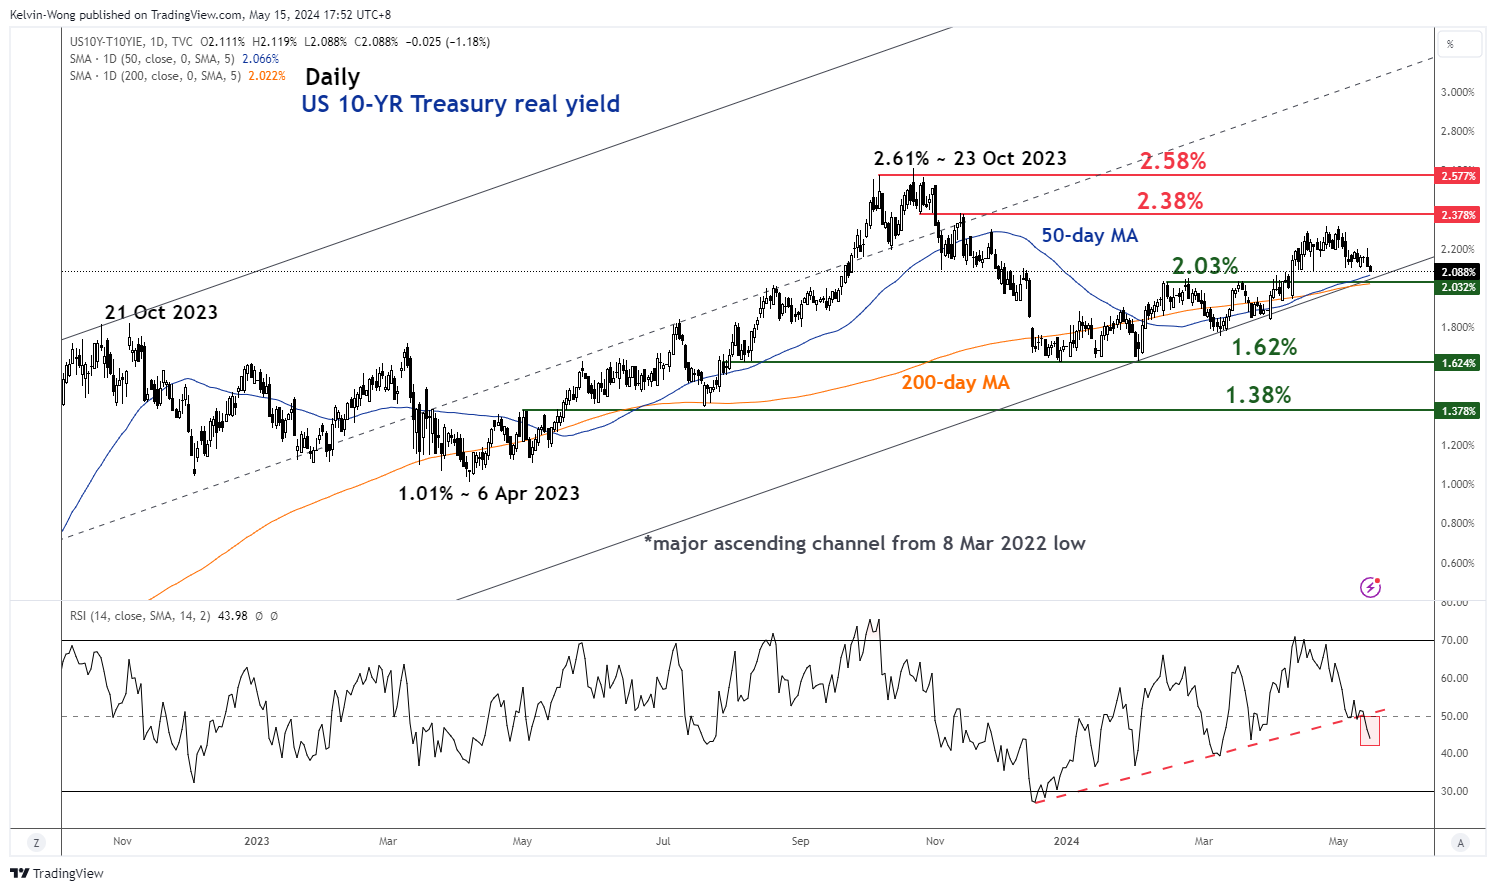
Fig 2: US 10-YR Treasury real yield major & medium-term trends as of 15 May 2024 (Source: TradingView, click to enlarge chart)
Since the release of the stagflation-liked University of Michigan Consumer Survey data, the US 10-year Treasury real yield has dropped lower; right now at this time of the writing, it is “dangerously” hoveringly above a key immediate support of 2.03% (the 200-day moving average & the lower boundary of a major ascending channel in place since 8 March 2022) (see Fig 2).
Also, its daily RSI momentum indicator has reflected a bearish momentum condition as it has just staged a breakdown below a parallel ascending support at the 50 level which suggests the odds are skewed towards a further fall in the US Treasury 10-year real yield rather than a recovery at this juncture.
Overall, a further softening of the US Treasury real yield implies a lower opportunity cost of holding non-interest-bearing assets such as Gold (XAU/USD) which in turn supports a potential positive feedback loop into its price actions.
Watch the US$ 2,327 key support on Gold (XAU/USD)
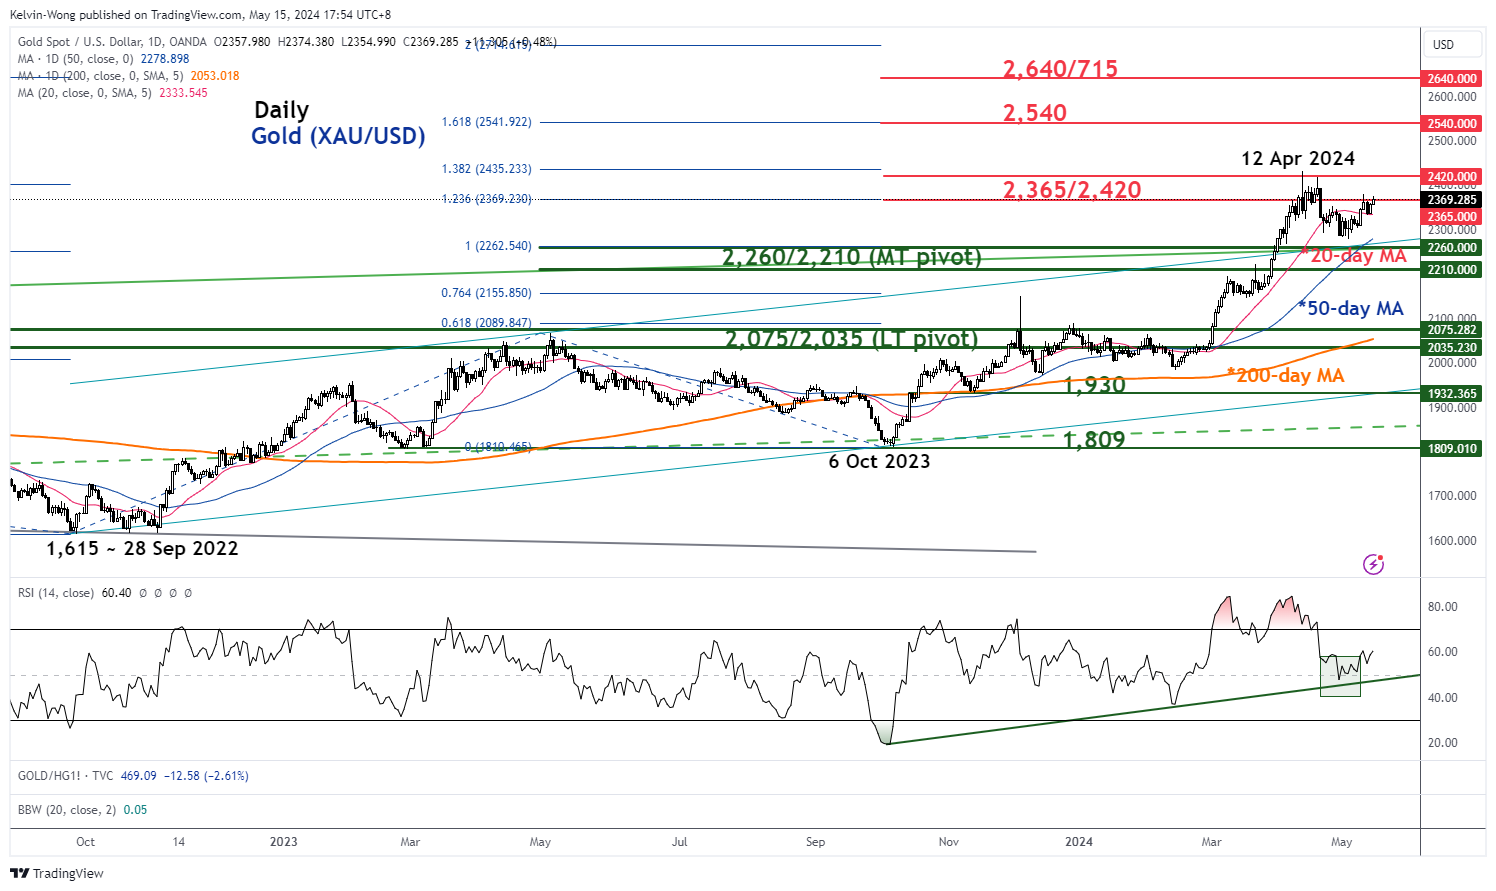
Fig 3: Gold (XAU/USD) major & medium-term trends as of 15 May 2024 (Source: TradingView, click to enlarge chart)
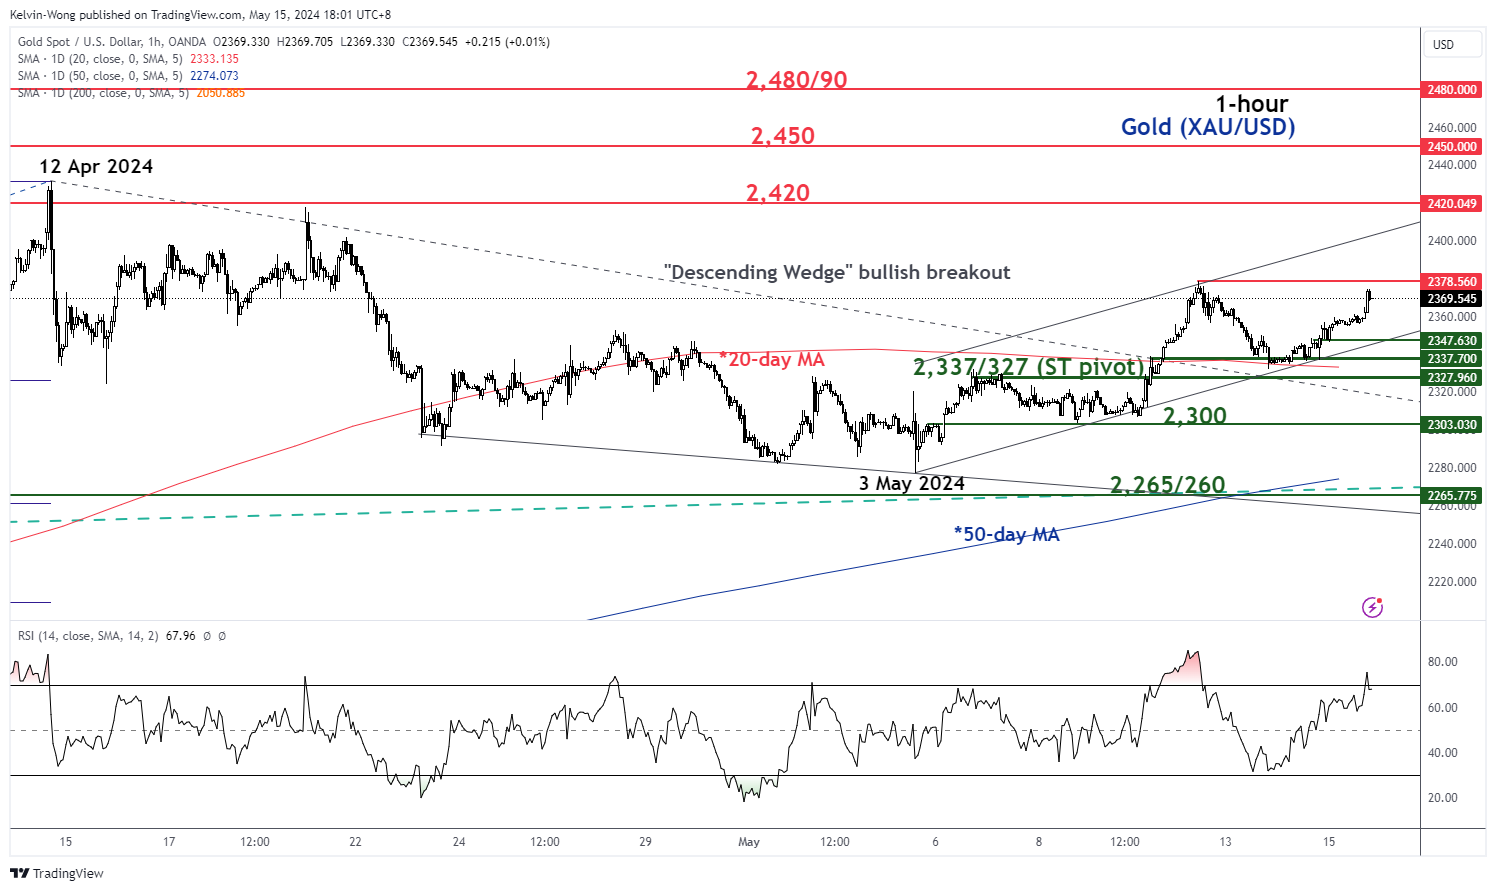
Fig 4: Gold (XAU/USD) short-term trend as of 15 May 2024 (Source: TradingView, click to enlarge chart)
Based on a technical analysis perspective, the recent bullish breakout above its 20-day moving average and the upper boundary of the minor “Descending Wedge” from its current all-time high of 12 April 2024 suggests the recent decline of 6.3% from 12 April to 3 May is likely a short-term corrective decline within a major uptrend phase that is still intact since 28 September 2022 (see Fig 3).
As seen on the hourly chart, Gold (XAU/USD) is now evolving in a short-term uptrend phase supported by its price actions that have oscillated within an ascending channel since the 3 May 2024 low (see Fig 4).
The key short-term pivotal support rests at US$2,327 and a break above US$2,378 sees the next intermediate resistances coming in at US$2,420 and US$2,450 in the first step.
However, a break below US$2,327 negates the bullish tone to expose the next support at US$2,300 with the key medium-term support zone coming right below it at US$2,265/260.


 has rallied by 2.5% and staged a bullish breakout above its 20-day moving average last Thursday, 9 May, and a positive follow-through at the start of this week as it inched higher today, 15 May with a current intraday high of $2,374 at this time of the writing.)