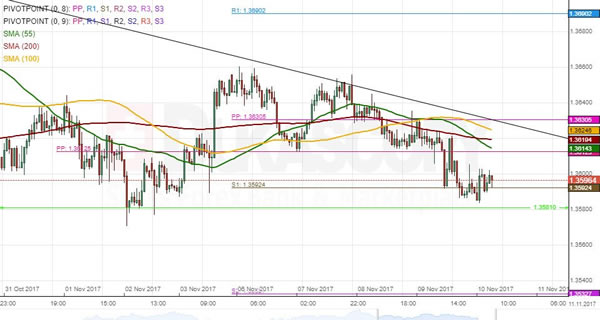
USD/SGD has been trading in a channel up since late August. This formation began when the rate reached a 2017 low at 1.3358 on September 8; the US Dollar has since moved up to the 1.36 mark. Another notable pattern that can be distinguished is a descending triangle. During its last wave down from the channel, the US Dollar was diminishing its trading range, but at the same time it failed to move below the 1.3580 mark, thus creating this aforementioned triangle. Technical indicators are in favour of a short-term recovery which is likely to hinder near a resistance cluster formed by the 55-, 100– and 200-hour SMAs circa 1.3625. In case this area is breached, the rate might push for the 1.3720 mark. Conversely, a failure to do so might strand the rate in a narrow trading range slightly above the 1.3580 mark. The Greenback should eventually break out to the downside and aim for the lower channel boundary near 1.3520.