published in members area of the website. As our members know, XAUUSD is forming a correction against the 2954.2 low. In the following text, we’ll explain the Elliott Wave analysis and outline the target areas.)
Hello fellow traders. In this technical article we’re going to look at the Elliott Wave charts of GOLD ($XAUUSD ) published in members area of the website. As our members know, XAUUSD is forming a correction against the 2954.2 low. In the following text, we’ll explain the Elliott Wave analysis and outline the target areas.
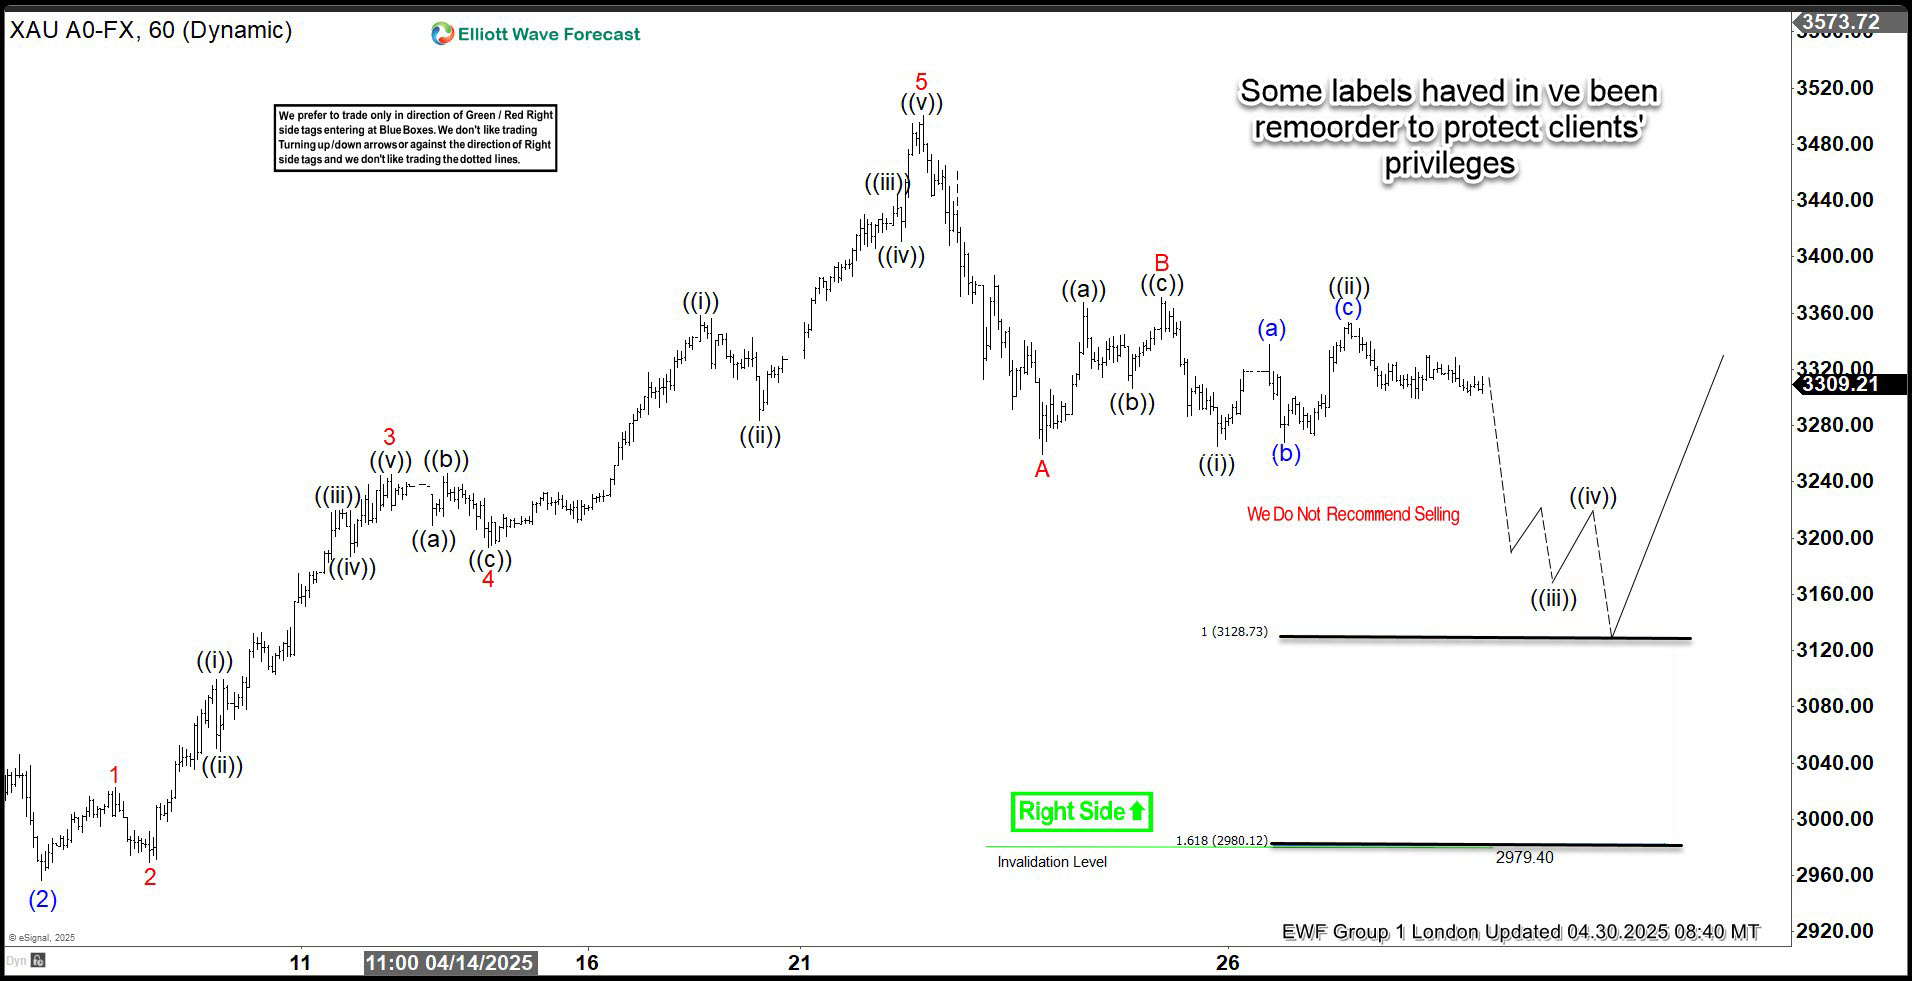
XAUUSD Elliott Wave 1 Hour Chart 04.30.2025
The price structure shows incomplete sequences from the April 22nd peak. The price broke below the 3260 level, confirming a potential extension to the downside.
As long as the price remains below the 3352.9 peak, we consider the intraday wave ((ii)) bounce completed and anticipate further decline in the near term.
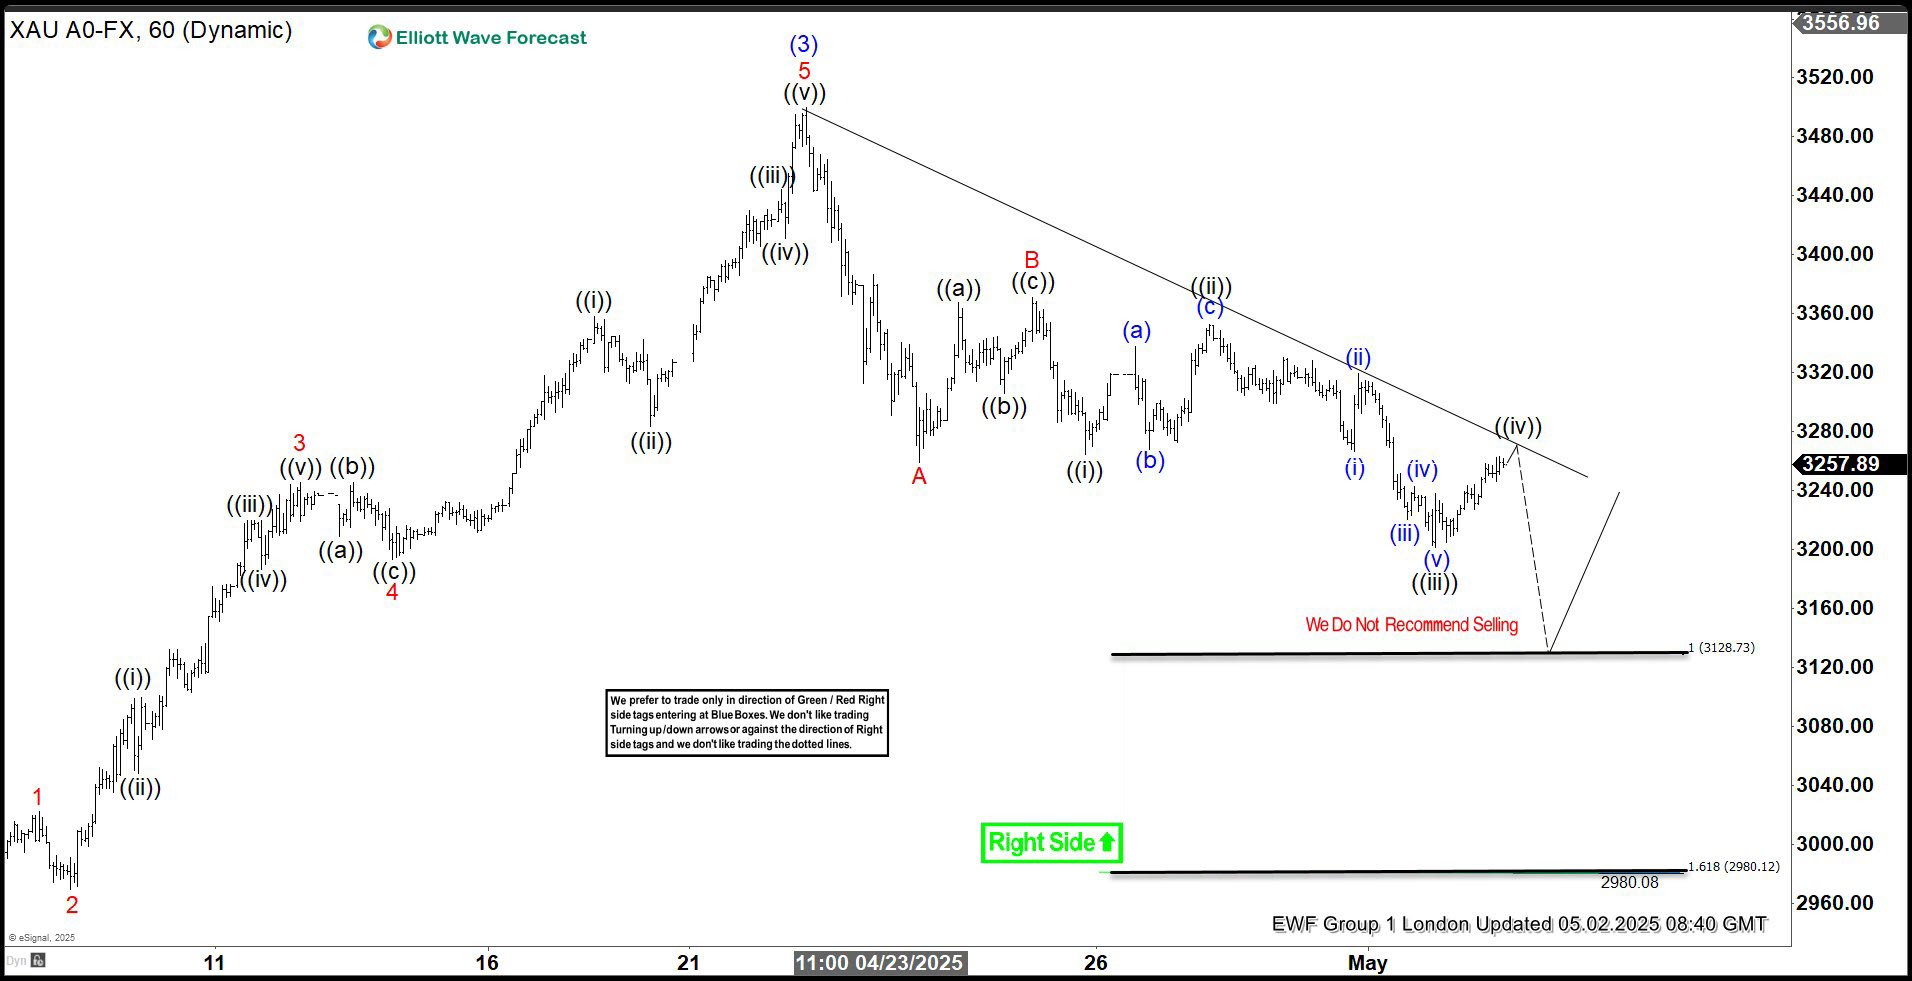
XAUUSD Elliott Wave 1 Hour Chart 05.02.2025
GOLD continued to drop as expected. The price broke to new lows, confirming the extension toward the 3128.7–2980.2 area.
We do not recommend selling at this point. If the marked extreme zone is reached, we will consider entering long positions again.