
As shown on the XAU/USD chart, the price of gold fell below $3,130 this morning – its lowest level since 10 April.
Since its peak in May, gold has lost more than 8% in value per ounce.
Why Is Gold Falling?
Bearish sentiment in the gold market may be fuelled by easing geopolitical tensions. According to media reports:
→ China and the US have already reported progress in reaching a trade agreement, while details of potential deals with India, Japan, and South Korea are currently being developed.
→ Iran is reportedly willing to sign a nuclear deal in exchange for the lifting of sanctions. In addition, Donald Trump may lift sanctions on Syria during his visit to the Middle East.
→ The situation between India and Pakistan has stabilised, and today, talks between Russia and Ukraine are expected to take place in Istanbul, with a potential ceasefire on the agenda.
These developments could be seen as reducing the appeal of gold as a safe-haven asset.
Technical Analysis of the XAU/USD Chart
In our 7 May gold price analysis, we:
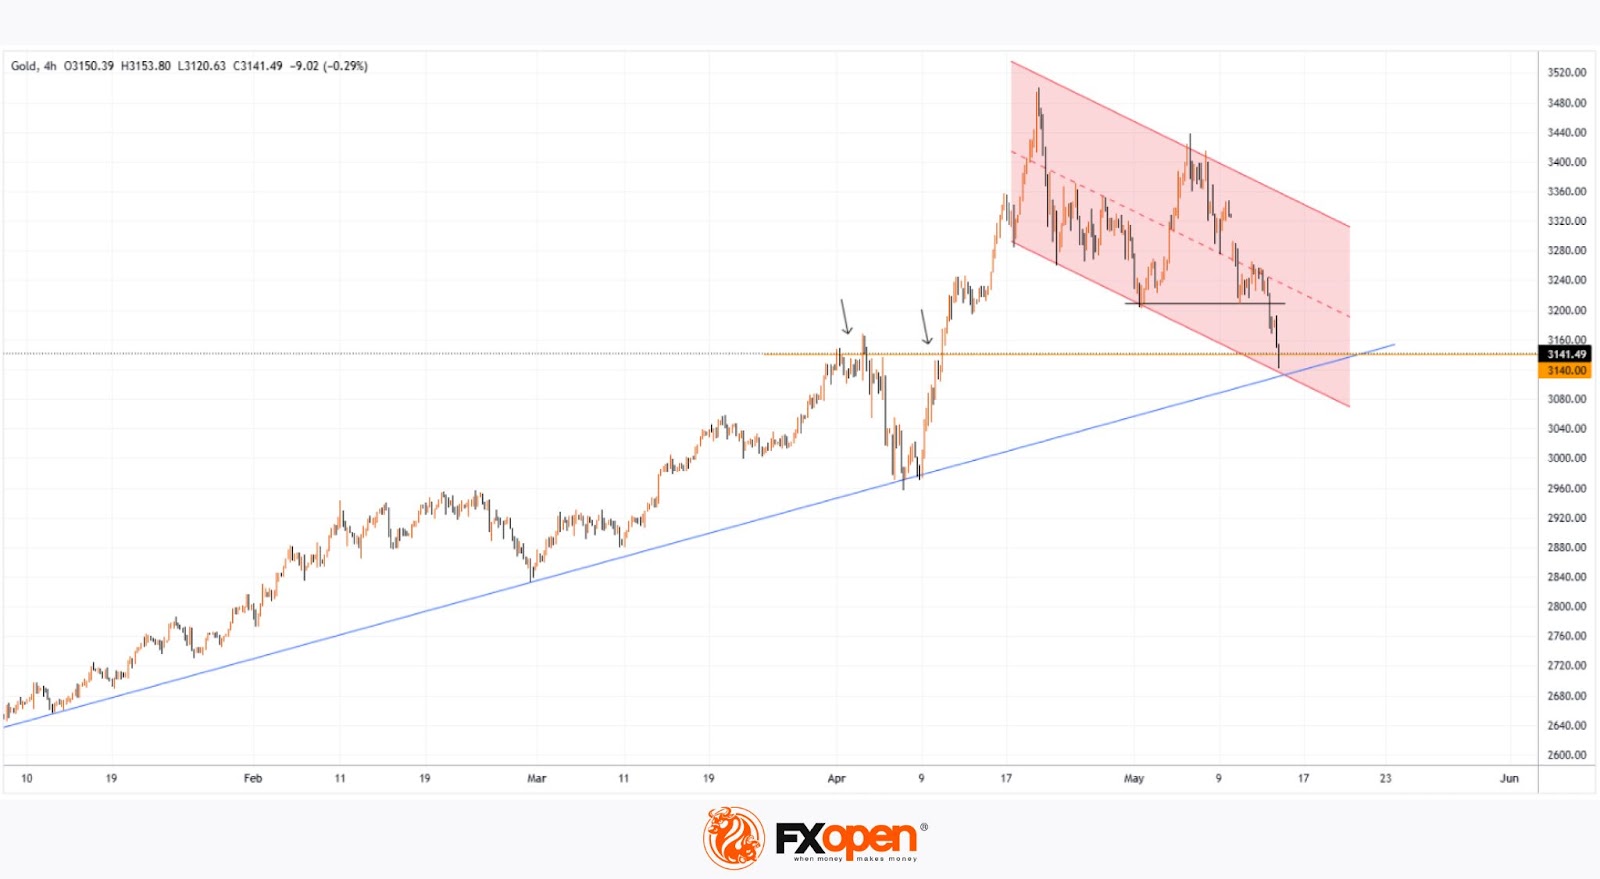
→ outlined a descending channel (marked in red);
→ noted that bearish pressure persisted above $3,400.
Since then, the gold (XAU/USD) price has continued to move within this channel, breaking support around the $3,200 level and approaching a key support zone formed by:
→ the lower boundary of the red channel;
→ a long-term trendline (marked in blue);
→ a former resistance level (highlighted with arrows) at $3,140.
Given these conditions, traders should consider a scenario in which a minor rebound may occur – for instance, towards the median line of the red channel.
Start trading commodity CFDs with tight spreads. Open your trading account now or learn more about trading commodity CFDs with FXOpen.
This article represents the opinion of the Companies operating under the FXOpen brand only. It is not to be construed as an offer, solicitation, or recommendation with respect to products and services provided by the Companies operating under the FXOpen brand, nor is it to be considered financial advice.