
The GBP/USD pair continues its upward trajectory, reaching 1.3429 by Thursday. It is now trading just below yesterday’s peak, its highest level since February 2022.
Key drivers behind GBP/USD’s rise
The rally follows the release of stronger-than-expected UK inflation data. The annual Consumer Price Index (CPI) accelerated to 3.5% in April, the highest reading since January 2024, exceeding both market forecasts (3.3%) and the Bank of England’s projection (3.4%). Contributing factors included:
- An increase in Ofgem’s energy price cap
- Higher vehicle tax rates
Notably, services sector inflation surged from 4.7% to 5.4%, signalling persistent underlying price pressures.
Market expectations for monetary policy easing have adjusted significantly. Investors now anticipate just one 25-basis-point rate cut by the end of 2025. The likelihood of a rate cut in August has fallen from 60% to 40%.
The Bank of England reduced interest rates by 25 basis points in May, although policymakers were divided on the decision.
Technical analysis: GBP/USD
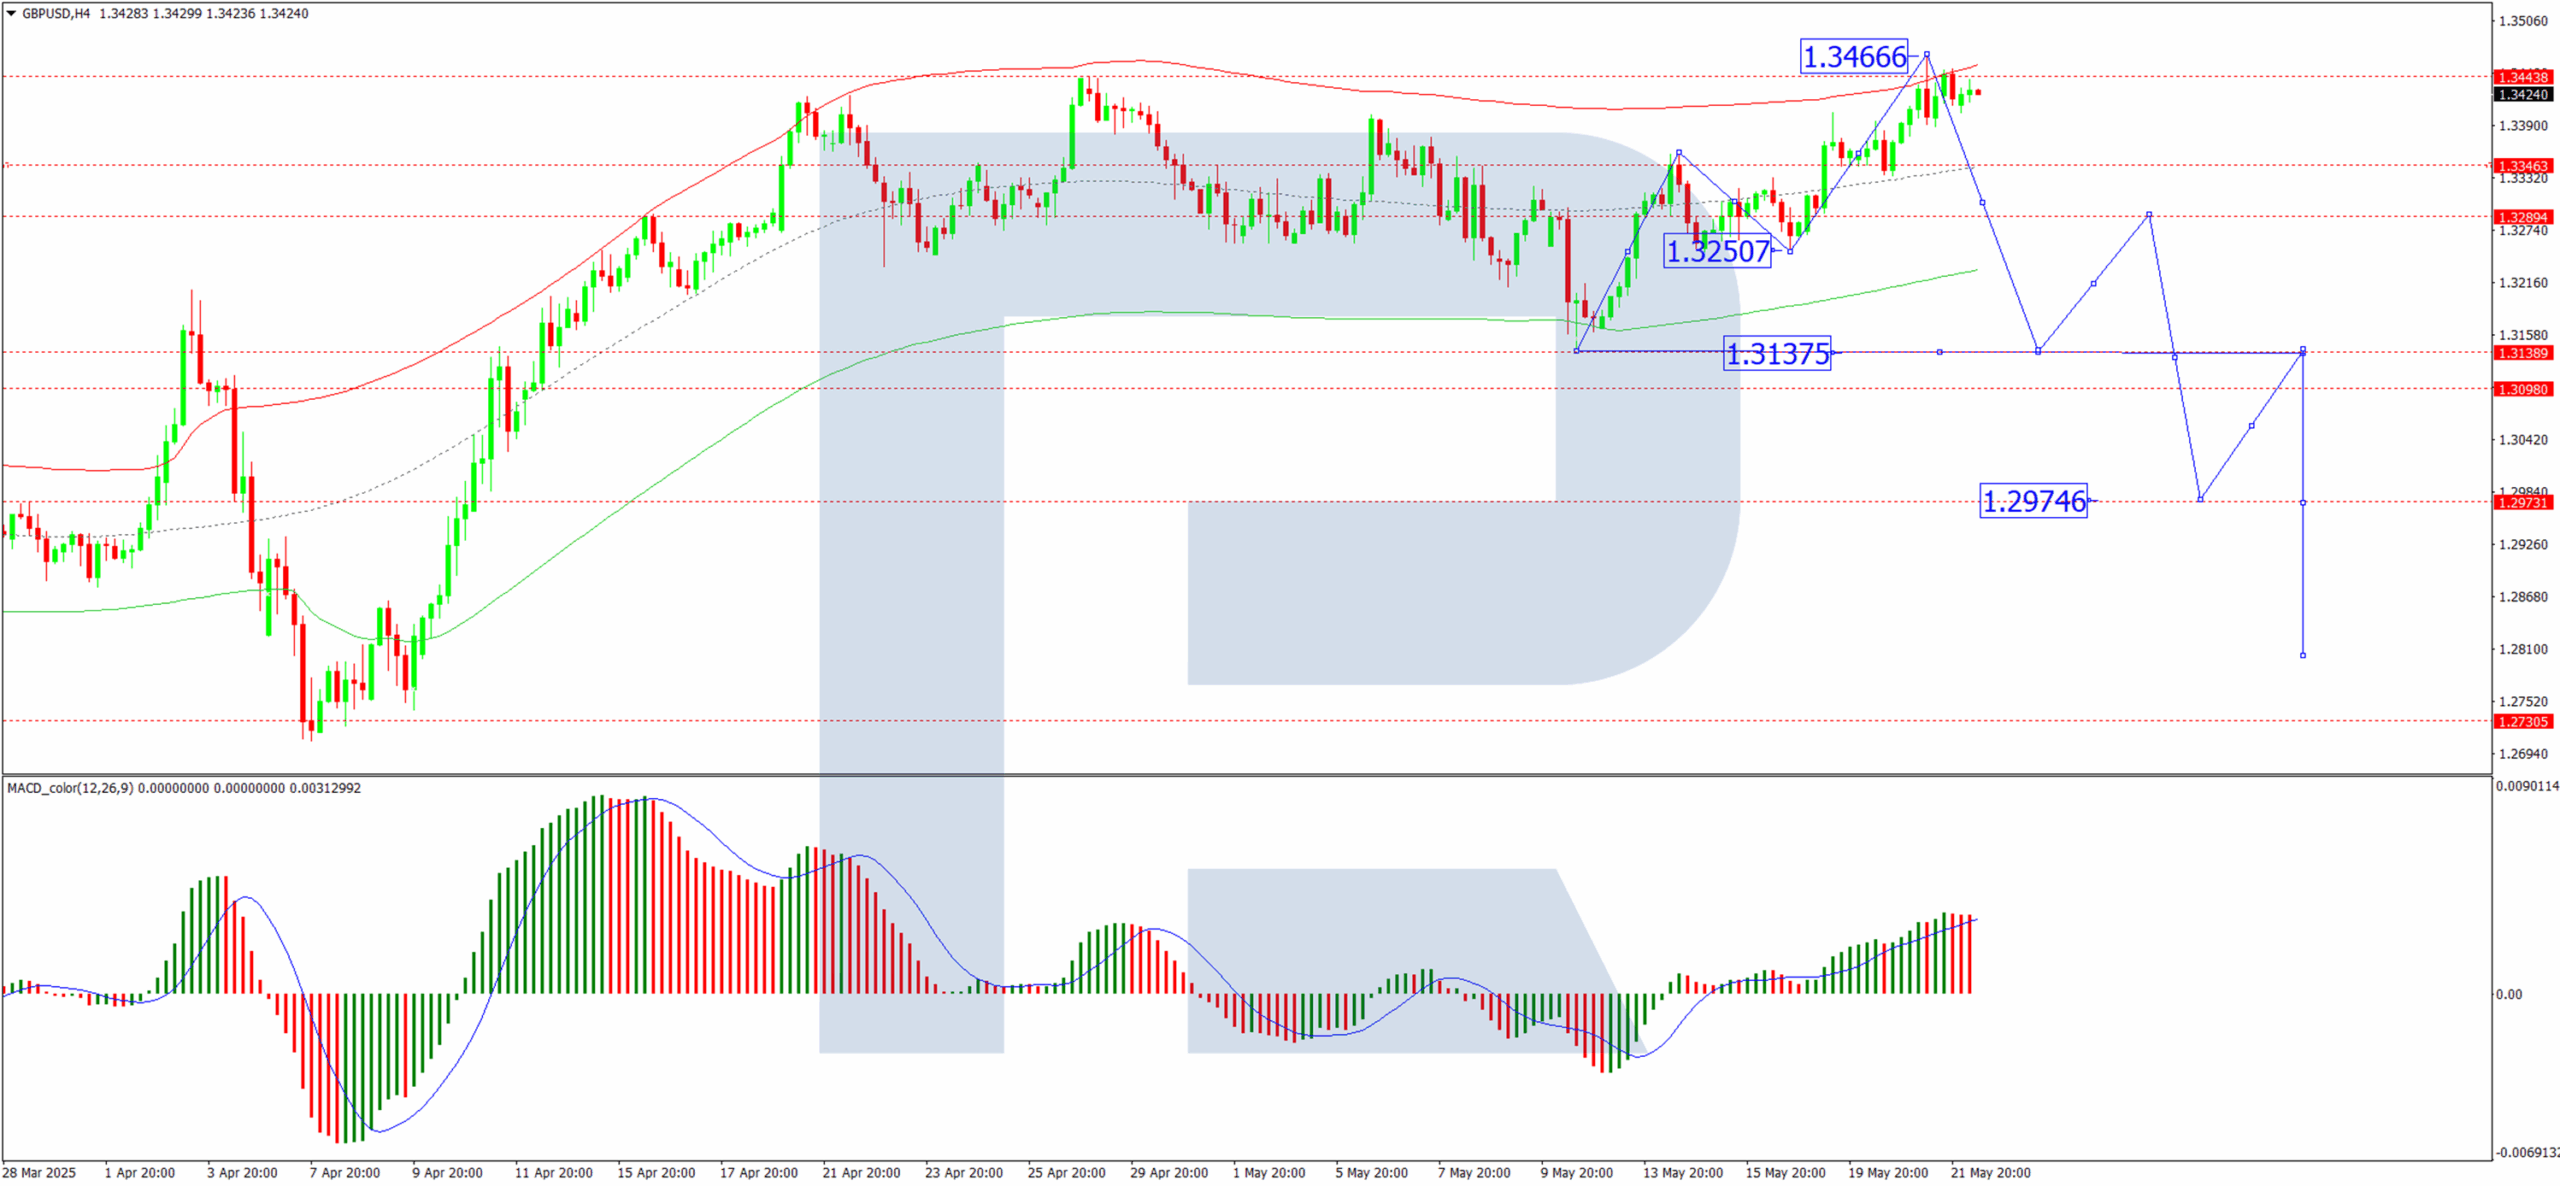
H4 Chart:
- The GBP/USD pair completed an upward wave, peaking at 1.3466
- Today, we expect consolidation below this level
- A downward breakout could initiate a decline towards 1.3131, with 1.3300 acting as the first target
- The MACD indicator supports this view, with its signal line exiting the histogram zone and trending lower
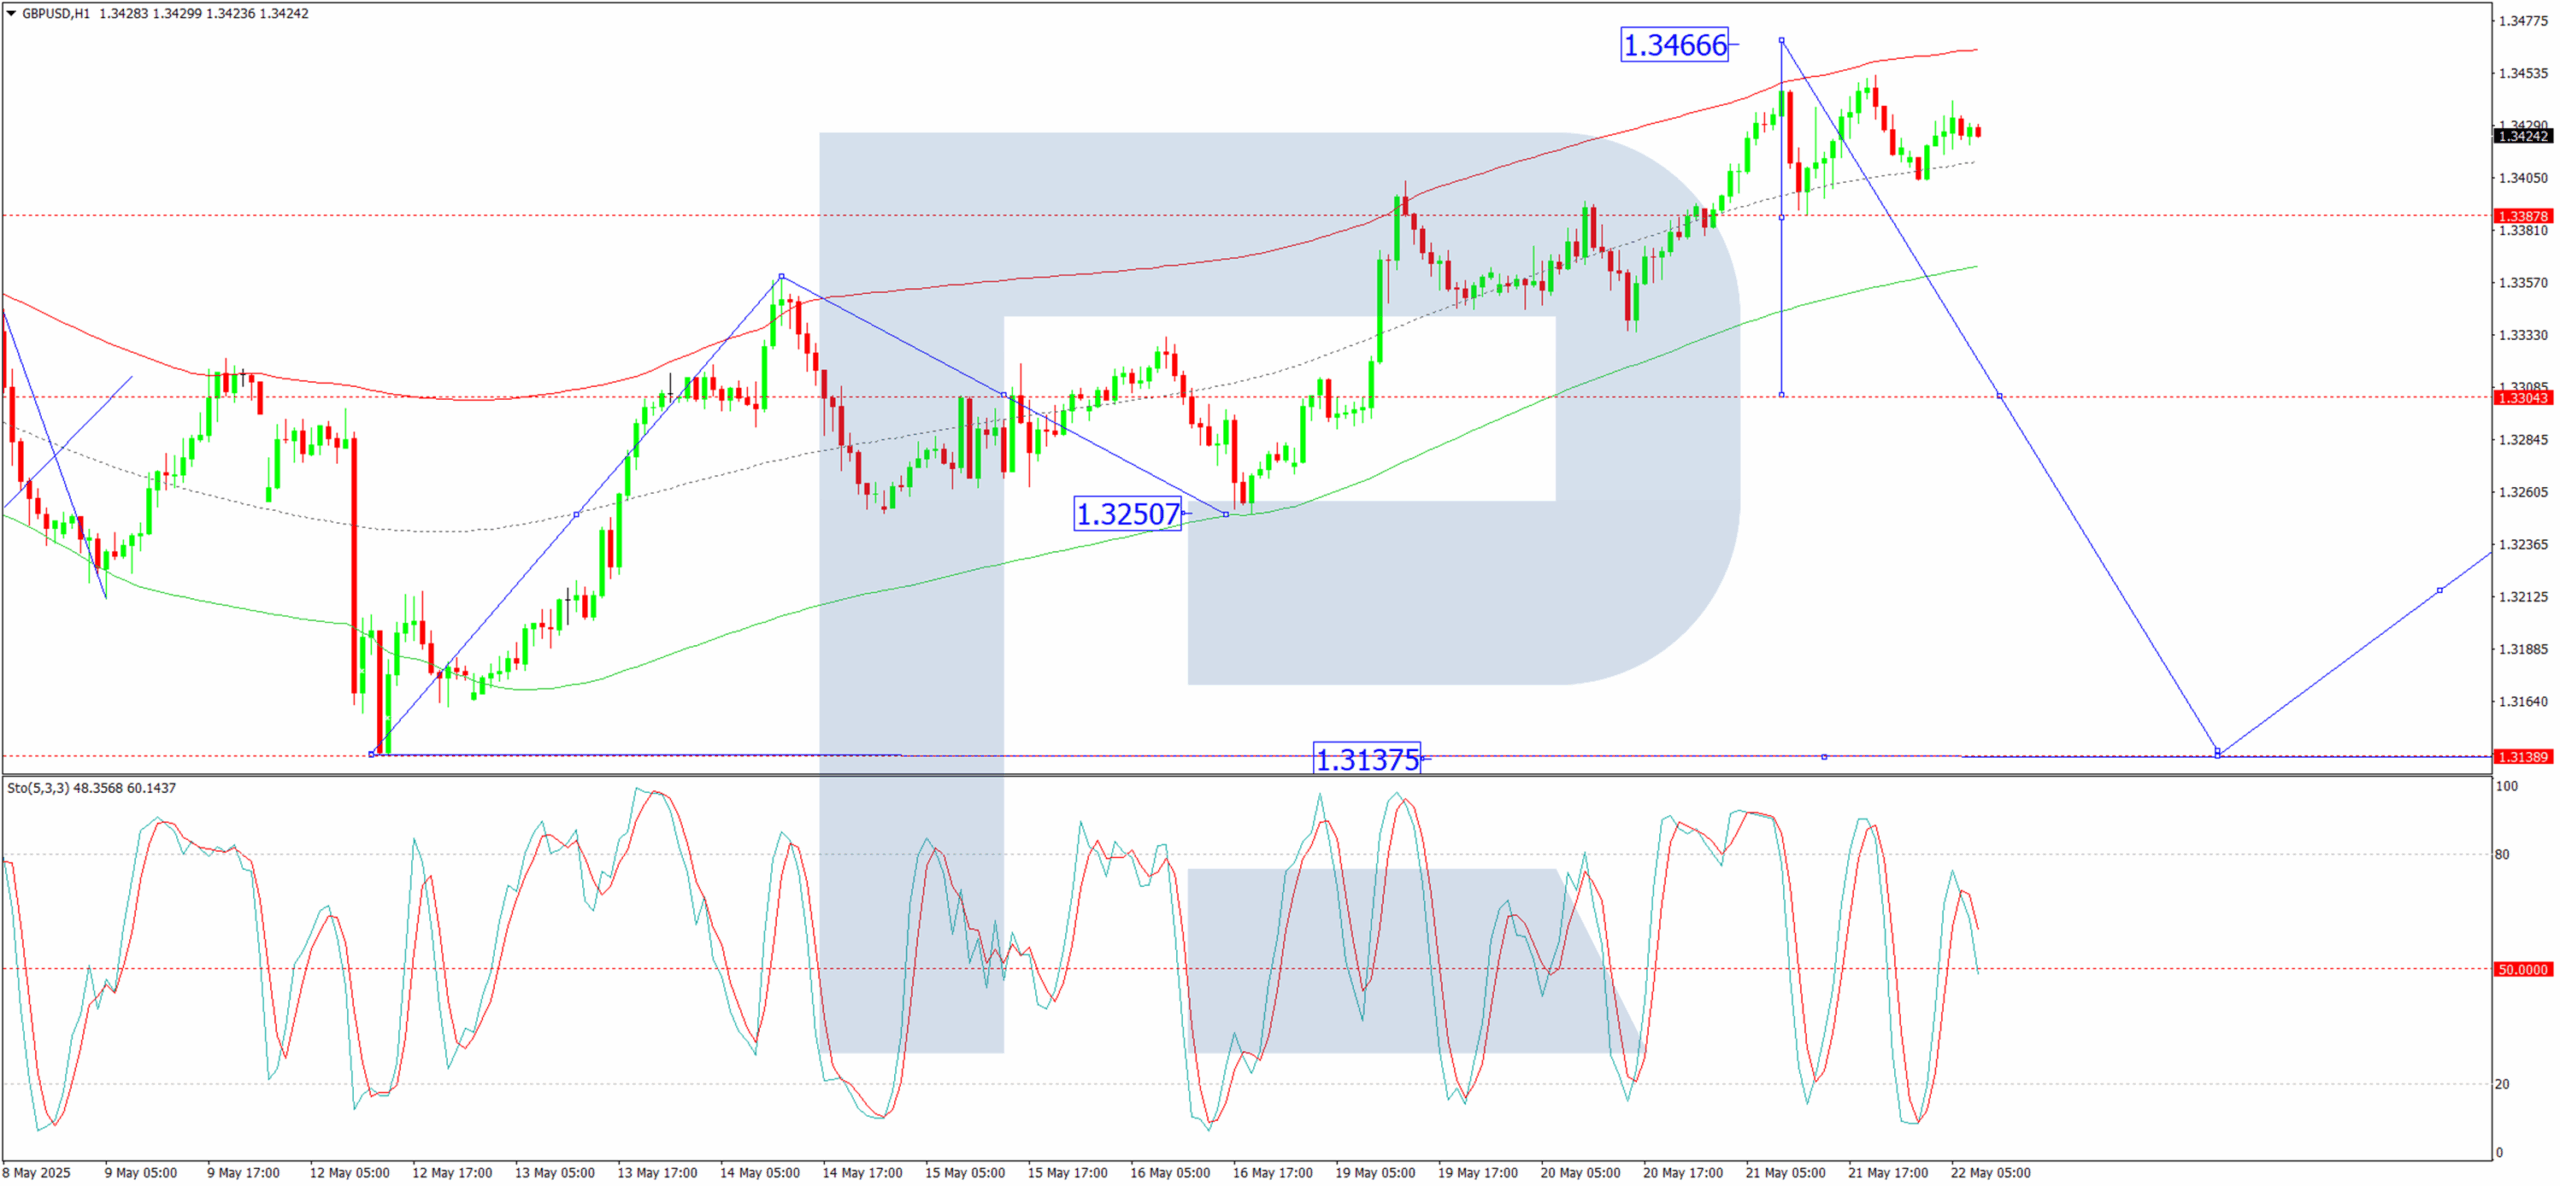
H1 Chart:
- The pair reached 1.3466 before correcting to 1.3388, establishing a consolidation range
- A downward breakout today could see a move towards 1.3300
- The Stochastic oscillator confirms this scenario, with its signal line below 80 and pointing decisively downward towards 20
Conclusion
Sterling’s strength persists amid weaker US dollar dynamics and persistent UK inflation. While technical indicators suggest a potential pullback, the broader trend remains influenced by monetary policy expectations and economic data.


