
US Indices continued their recovery throughout May with another decent start to the trading week. The Nasdaq 100 is up 2.15% since Friday’s close. They are up through broadly unchanged on the day.
Sentiment for this trading week has been broadly positive throughout the globe. Even as US cash markets were closed on Monday for Memorial Day, Equity Futures posted a rise without much retracement.
A swift move up was made in the index after Nvidia beat high expectations on its earnings after the session close with an EPS coming at $0.96 vs $0.93 expected. Revenues came in at $44.1B vs $43.3B expected.
More news came in with the “Taco Trump” headlines, as President Trump’s infamous trade tariff policies got denied by the US Federal Court, having deemed that he “overstepped his authority” on his import taxes plan. Markets rallied further before retracing back to yesterday’s close.
Let’s dive into a multi-timeframe technical analysis review of the NQ.
Nasdaq 100 Technical Analysis
Daily Timeframe
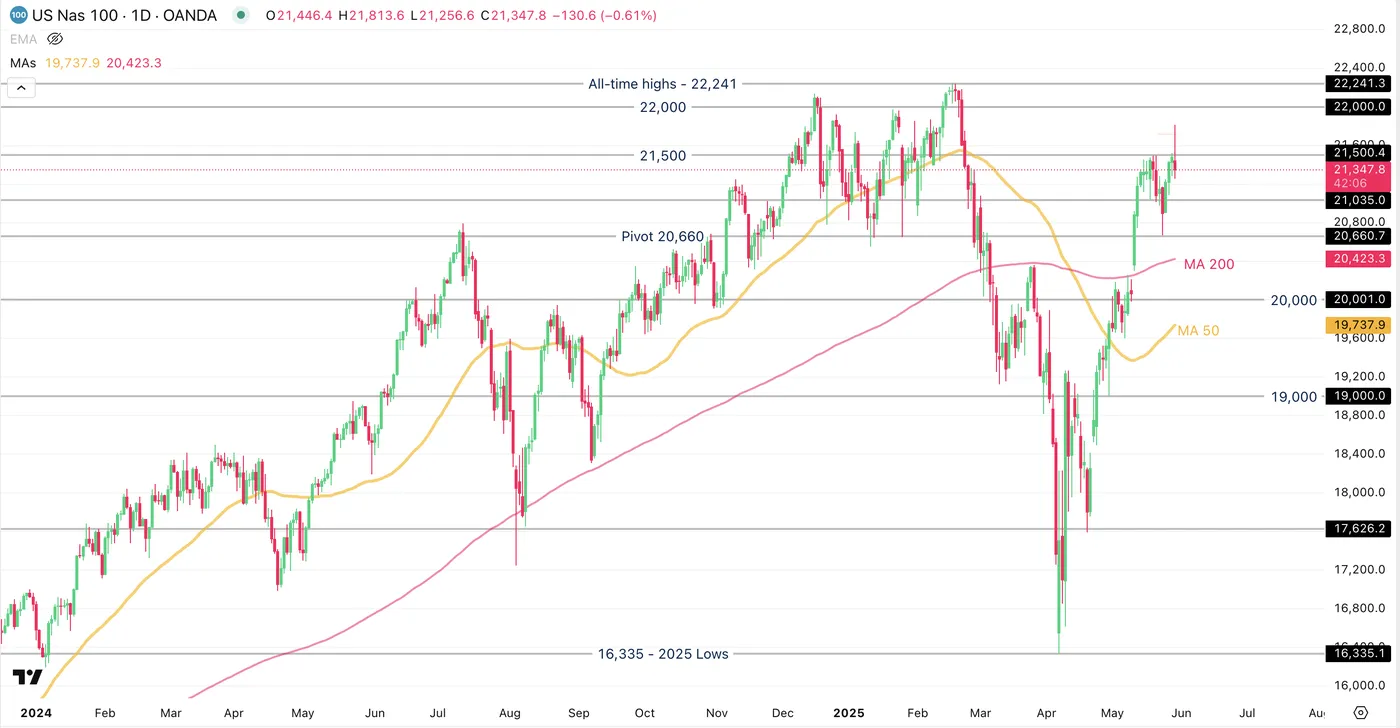
Nasdaq 100 Daily Chart, 2024 to May 28 2025. Source: TradingView
2025 has been volatile for all US Indices to say the least – as a matter of fact, it has been the same around the globe.
The Nasdaq has led on the way up, with Trump’s erratic policy fears abated throughout the past two months. The recovery has been stellar, as we are now largely above the MA 200 and a bit shy of 3% from the all-time highs.
The NQ is up more than 30% from its 4th of April Lows, marked at 16,335.
4H Timeframe
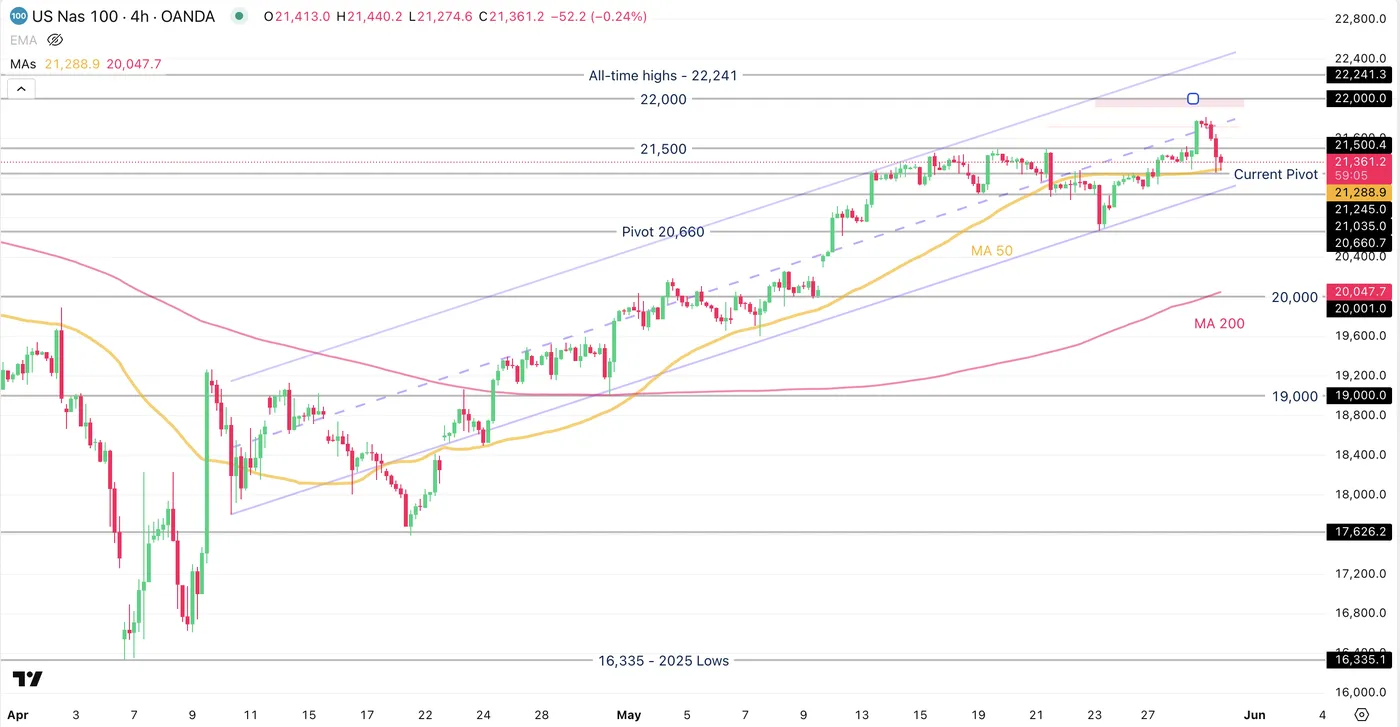
Nasdaq 100 4H Chart, May 28 2025. Source: TradingView
NQ has been in an upwards channel since April 20.
Momentum has been decent, with the MA 50 underpinning the consistent rise.
However, after Moody’s downgrade on the US Credit Rating on May 16th, US Indices went through a 3.70% correction, which calmed the rally.
The Nasdaq has to break above 21,800 to pursue it’s rise towards the all-time highs.
The MA 50 is showing immediate support, currently at 21,243.
Further support at the lows of the channel coincide with the 21,000 psychological level.
1H Timeframe
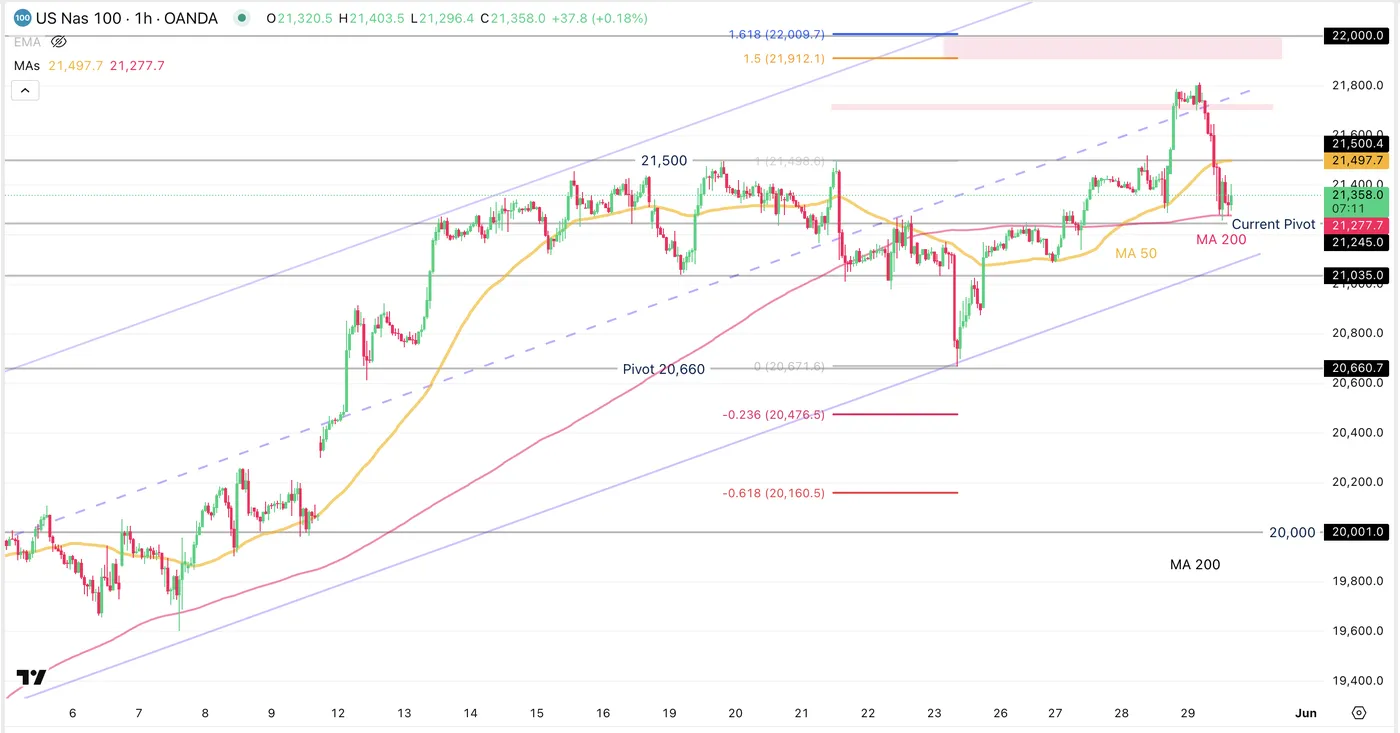
Nasdaq 100 1H Chart, May 28 2025. Source: TradingView
NQ has formed a range after last Friday’s lows. Prices have since retraced back up, made an extensive move then gave it back in today’s afternoon session. Momentum has since flattened.
The MA 200 is coinciding with the first support level, though being flat, confirms a flattening of momentum on the shorter timeframes.
Resistance Levels:
- 21,500 (immediate resistance)
- 21,700 to 21,730 – Fibonacci Extension 1.382
- 22,000 – Psychological Level + 1.618 Fib Extension Confluence
Support Levels:
- 21,245 (MA 200 + Support confluence)
- 21,035
- 20,660 (Friday 23 Pivot)
Safe Trades!