
On April 7, 2025, the Nasdaq (NQ), like other major global indices, marked a significant low, setting the stage for a potential bullish trend. From this low, the index has embarked on a five-wave impulsive rally. This a hallmark of bullish momentum in Elliott Wave theory. The initial advance, wave 1, peaked at 18,361.5. It was then followed by a corrective pullback in wave 2, which found support at 16,735. From there, the index resumed its upward trajectory in wave 3. The move up in wave 3 has an internal five-wave structure, signaling strong bullish momentum.
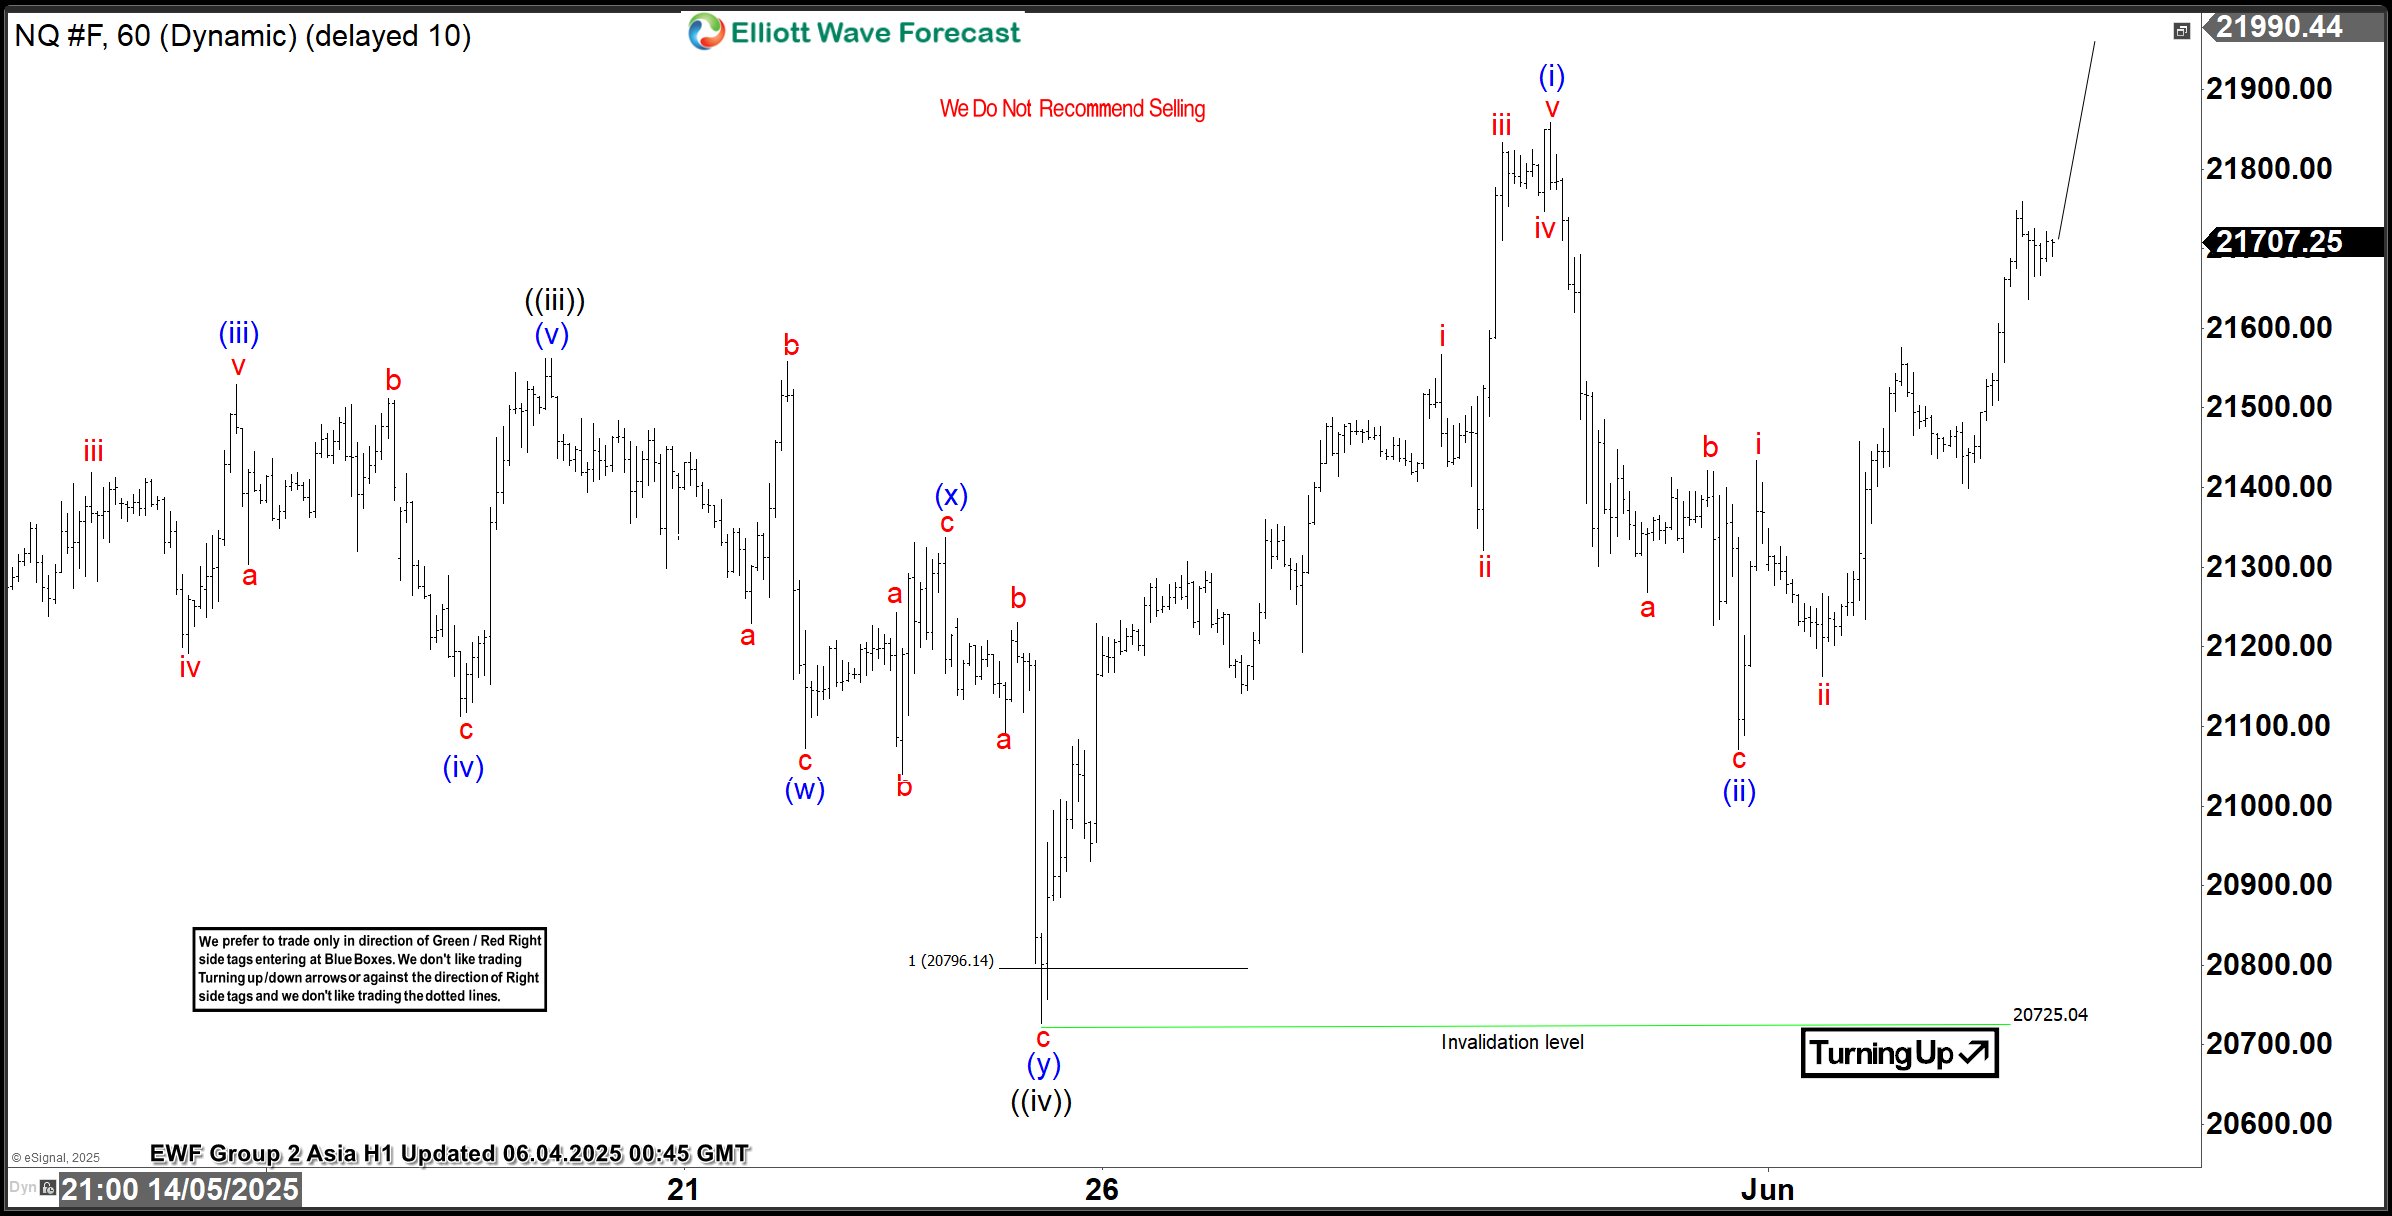
Within wave 3, the first sub-wave, ((i)), concluded at 19,386.75. Subsequent pullback in wave ((ii)) found support at 17,700. The index then surged higher in wave ((iii)), reaching 21,562. Afterwards, a corrective dip in wave ((iv)) ended at 20,725.04, as illustrated on the one-hour chart. This wave ((iv)) correction unfolded as a double-three Elliott Wave pattern. Wave (w) bottomed at 21,072.75 and wave (x) peaked at 21,337.5. The final leg, wave (y), concluded at 20,725.04, completing the correction.
The Nasdaq has since turned higher in wave ((v)). From the wave ((iv)) low, wave (i) advanced to 21,858.75, followed by a pullback in wave (ii) to 21,071.5. The index is now poised to extend higher in wave (iii) of ((v)), continuing the impulsive rally from the April 7 low. In the near term, as long as the pivotal low at 20,725.04 holds, any pullbacks are expected to find support in a 3, 7, or 11-swing pattern, paving the way for further upside. This technical setup suggests the Nasdaq is well-positioned to sustain its bullish momentum in the coming sessions, provided key support levels remain intact.
Nasdaq 60-Minute Elliott Wave Technical Chart
Nasdaq (NQ) Elliott Wave Technical Video
You are currently viewing a placeholder content from Default. To access the actual content, click the button below. Please note that doing so will share data with third-party providers.


, like other major global indices, marked a significant low, setting the stage for a potential bullish trend. From this low, the index has embarked on a five-wave impulsive rally. This a hallmark of bullish momentum in Elliott Wave theory. The initial advance, wave 1, peaked at 18,361.5. It was then followed by a corrective pullback in wave 2, which found support at 16,735. From there, the index resumed its upward trajectory in wave 3. The move up in wave 3 has an internal five-wave structure, signaling strong bullish momentum.)