
Key Highlights
- Ethereum started a fresh increase above the $2,500 resistance.
- ETH is following a short-term contracting triangle forming with resistance at $2,800 on the daily chart.
- Bitcoin price is facing hurdles near the $107,000 resistance.
- XRP is showing positive signs and might soon aim for a move above $2.35.
Ethereum Technical Analysis
Ethereum remained stable above $1,800 and started a fresh increase. ETH cleared a few key hurdles near $2,200 to start a fresh surge.
Looking at the daily chart, the price surpassed the 50% Fib retracement level of the downward wave from the $3,740 swing high to the $1,379 low. ETH settled above the 100-day simple moving average (red) and now approaches the 200-day simple moving average (green).
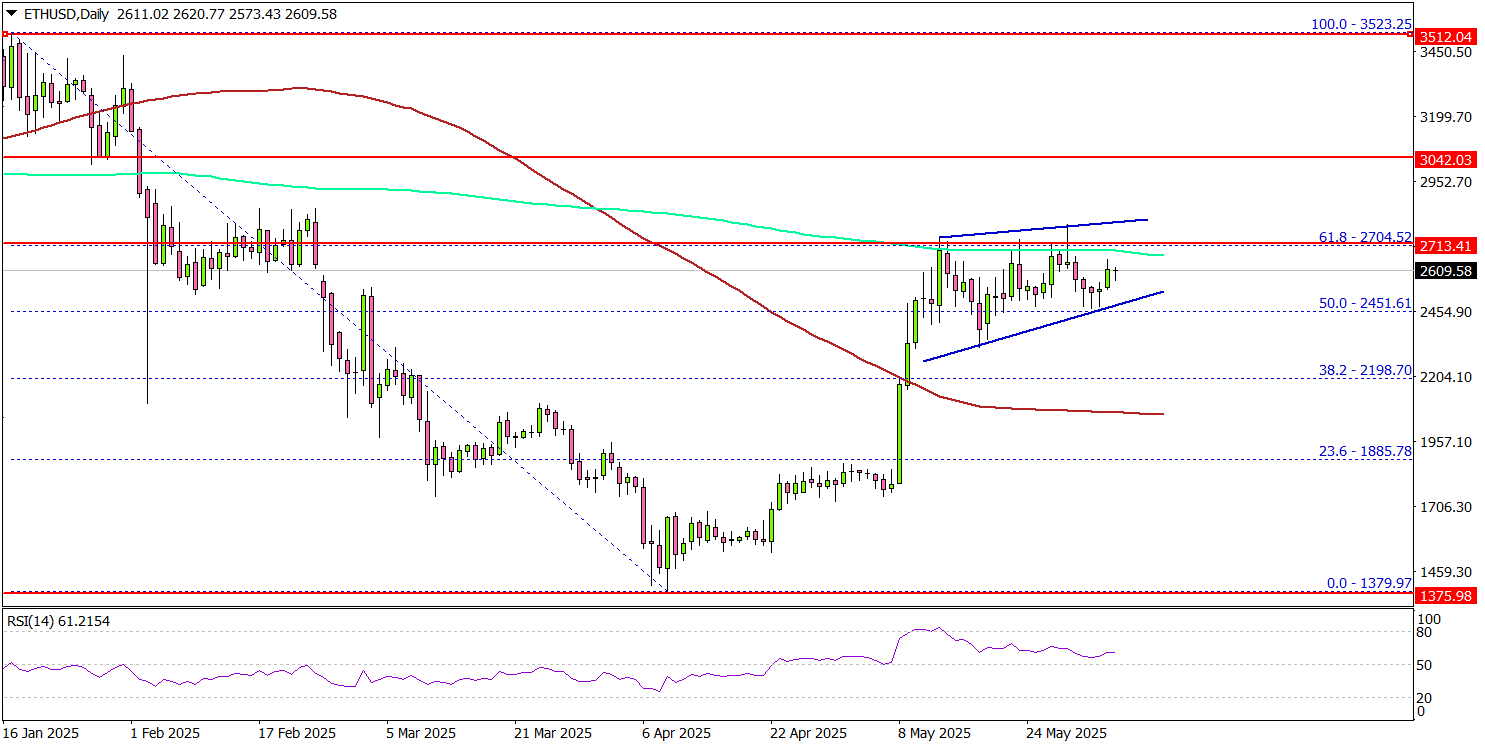
It is now facing resistance near the $2,700 zone and the 61.8% Fib retracement level of the downward wave from the $3,740 swing high to the $1,379 low.
The next major resistance is near the $2,800 level. There is also a short-term contracting triangle forming with resistance at $2,800 on the daily chart. A daily close above the $2,800 resistance zone could start another steady increase.
In the stated case, the price may perhaps rise toward the $3,000 level. The next stop for the bulls may perhaps be $3,120. On the downside, Ethereum might find support near the $2,450 level.
The next major support is $2,320, below which the price could slide toward $2,120. Any more losses might call for a move toward the $2,000 level.
Looking at Bitcoin, there was a steady increase above the $103,200 level, and the price is now facing hurdles near the $107,000 level.
Economic Releases
- Fed’s Bostic speech.
- Fed’s Cook speech.