
In our analysis of Brent crude oil six days ago, we identified a large contracting triangle and a local ascending channel. We also outlined a potential scenario involving a bullish breakout above the upper boundary of the triangle.
Although this was not the base-case scenario, the XBR/USD chart now suggests it has played out: yesterday, the price climbed to nearly $67 per barrel — its highest level since the end of April.
The main bullish catalyst appears to be ongoing trade talks between the United States and China, which have raised hopes of a resolution to tariff-related tensions between the world’s two largest economies.
At the same time, rising oil prices may exacerbate geopolitical tensions, particularly amid Israeli threats to strike ports in Yemen — a risk that could disrupt supply chains across the Middle East.
Technical Analysis of the XBR/USD Chart
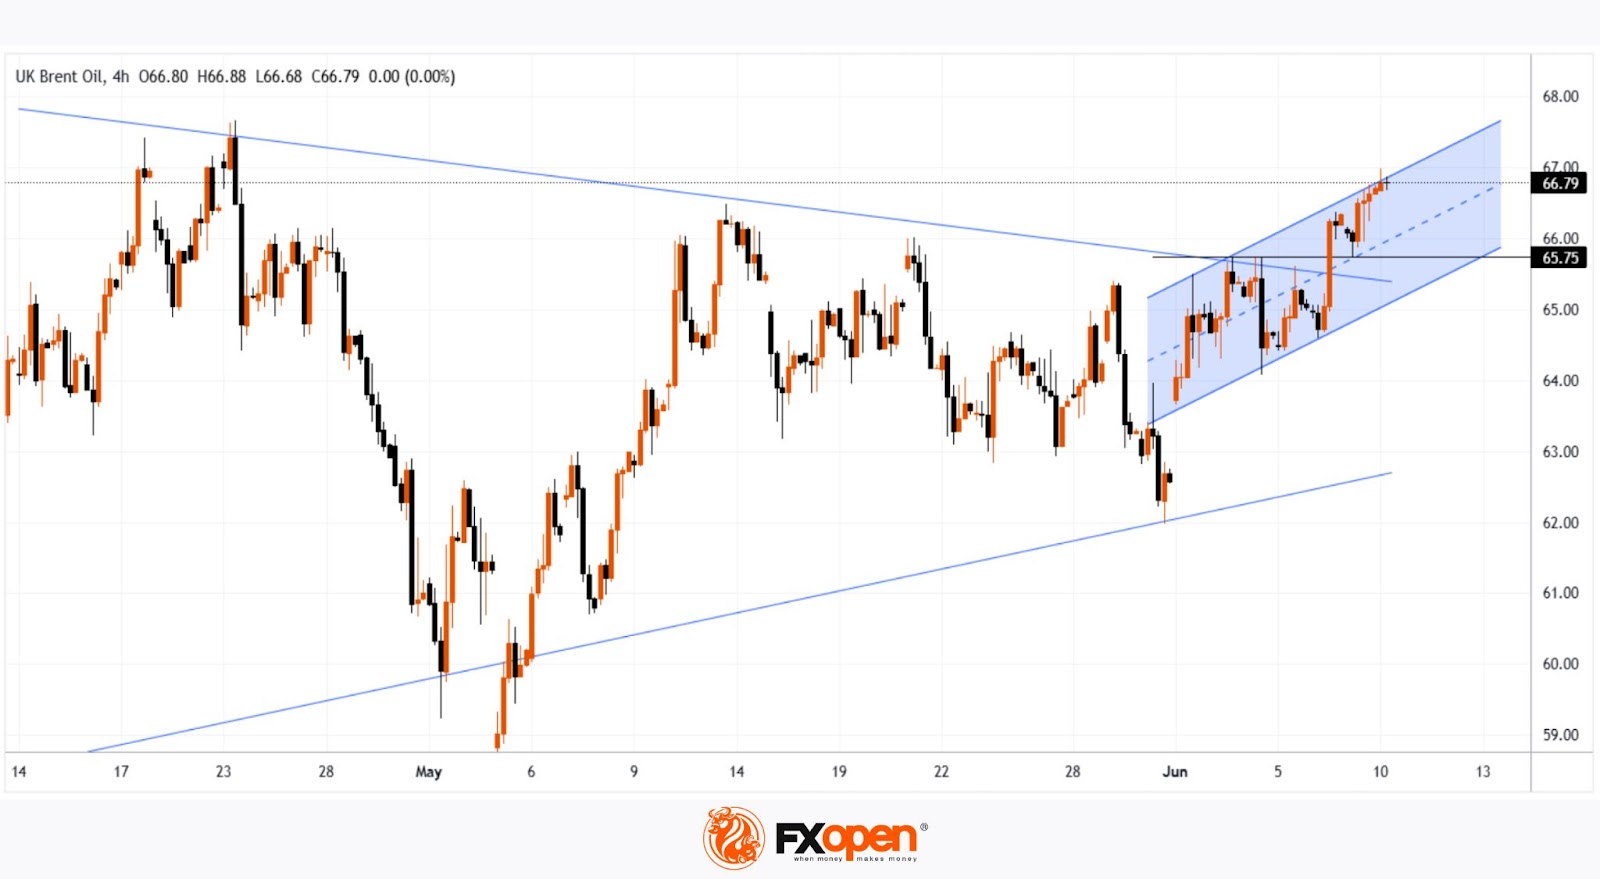
From a technical perspective:
→ Brent crude continues to move within an ascending channel (marked in blue);
→ the upper boundary may now act as a support level.
The fact that the price is holding in the upper half of the channel indicates strong demand-side pressure. Based on this, it is reasonable to assume that as long as Brent remains above the $65.75 level (the retest zone of the breakout), the technical outlook will remain predominantly bullish.
Start trading commodity CFDs with tight spreads. Open your trading account now or learn more about trading commodity CFDs with FXOpen.
This article represents the opinion of the Companies operating under the FXOpen brand only. It is not to be construed as an offer, solicitation, or recommendation with respect to products and services provided by the Companies operating under the FXOpen brand, nor is it to be considered financial advice.


