
Key Highlights
- Ethereum is facing heavy resistance near the $2,550 and $2,650 levels.
- ETH is still above a key bullish trend line with support at $2,300 on the daily chart.
- Bitcoin price failed to extend gains above the $108,800 resistance.
- XRP rallied toward the $2.35 resistance before trimming some gains.
Ethereum Technical Analysis
Ethereum failed to settle above $2,800 and corrected gains. ETH declined below the $2,720 and $2,500 support levels before the bulls emerged.
Looking at the daily chart, the price dived toward the $2,120 support and the 50% Fib retracement level of the upward move from the $1,379 swing low to the $2,876 high. The bulls also defended the 100-day simple moving average (red).
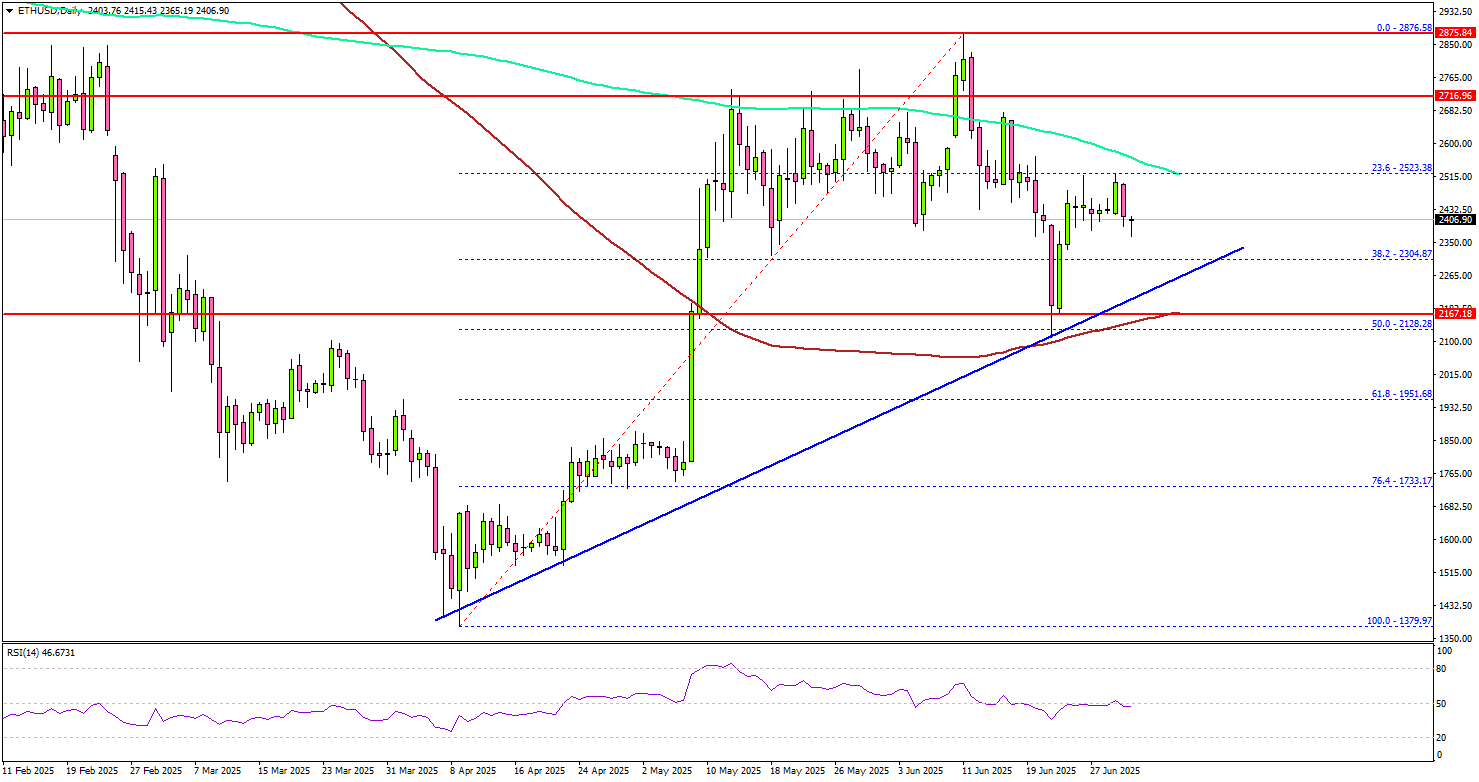
Besides, ETH is above a key bullish trend line with support at $2,300 on the same chart. On the upside, the price is facing hurdles near the 200-day simple moving average (green) and $2,550.
The next major resistance is near the $2,650 level. A daily close above the $2,650 resistance zone could start another steady increase. In the stated case, the price may perhaps rise toward the $2,880 level. The next stop for the bulls may perhaps be $3,000.
On the downside, Ethereum might find support near the $2,300 level and the trend line. The next major support is $2,120, below which the price could slide toward $2,000. Any more losses might call for a move toward the $1,740 level or the 76.4% Fib retracement level of the upward move from the $1,379 swing low to the $2,876 high.
Looking at Bitcoin, there was a steady increase above the $105,000 level but the bulls struggled to keep the price above the $108,500 level.
Economic Releases
- ECB’s President Lagarde speech.
- US ADP Employment Change for June 2025 – Forecast 95K, versus 37K previous.