and the upper daily Bollinger Band.)
Dow Jones: ⬇️ Sell
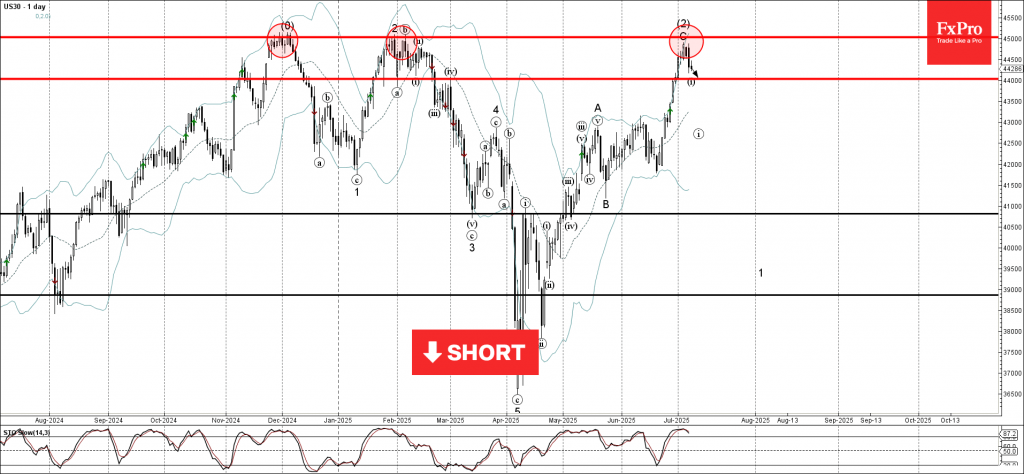
- Dow Jones reversed from long-term resistance level 45000.00
- Likely to fall to support level 44000.00
Dow Jones index recently reversed down from the resistance zone located between the long-term resistance level 45000.00 (which has been steadily reversing the price from the end of November) and the upper daily Bollinger Band.
The downward reversal from this resistance zone stopped the previous medium-term ABC correction (2) from the start of April.
Given the strength of the resistance level 45000.00 and the overbought daily Stochastic, Dow Jones index can be expected to fall to the next support level 44000.00 (target price for the completion of the active impulse wave i).