
Key Highlights
- Gold started a fresh decline from the $3,375 resistance.
- A key bearish trend line is forming with resistance at $3,350 on the 4-hour chart.
- WTI Crude Oil prices could struggle to climb above the $69.25 resistance.
- USD/JPY started a fresh increase above the 145.50 resistance.
Gold Price Technical Analysis
Gold prices failed to extend gains above $3,400 and reacted to the downside. There was a steady decline below the $3,380 and $3,360 support levels.
The 4-hour chart of XAU/USD indicates that the price settled below the $3,350 level, the 100 Simple Moving Average (red, 4 hours), and the 200 Simple Moving Average (green, 4 hours). Recently, there was a correction wave, but upsides were limited above $3,360.
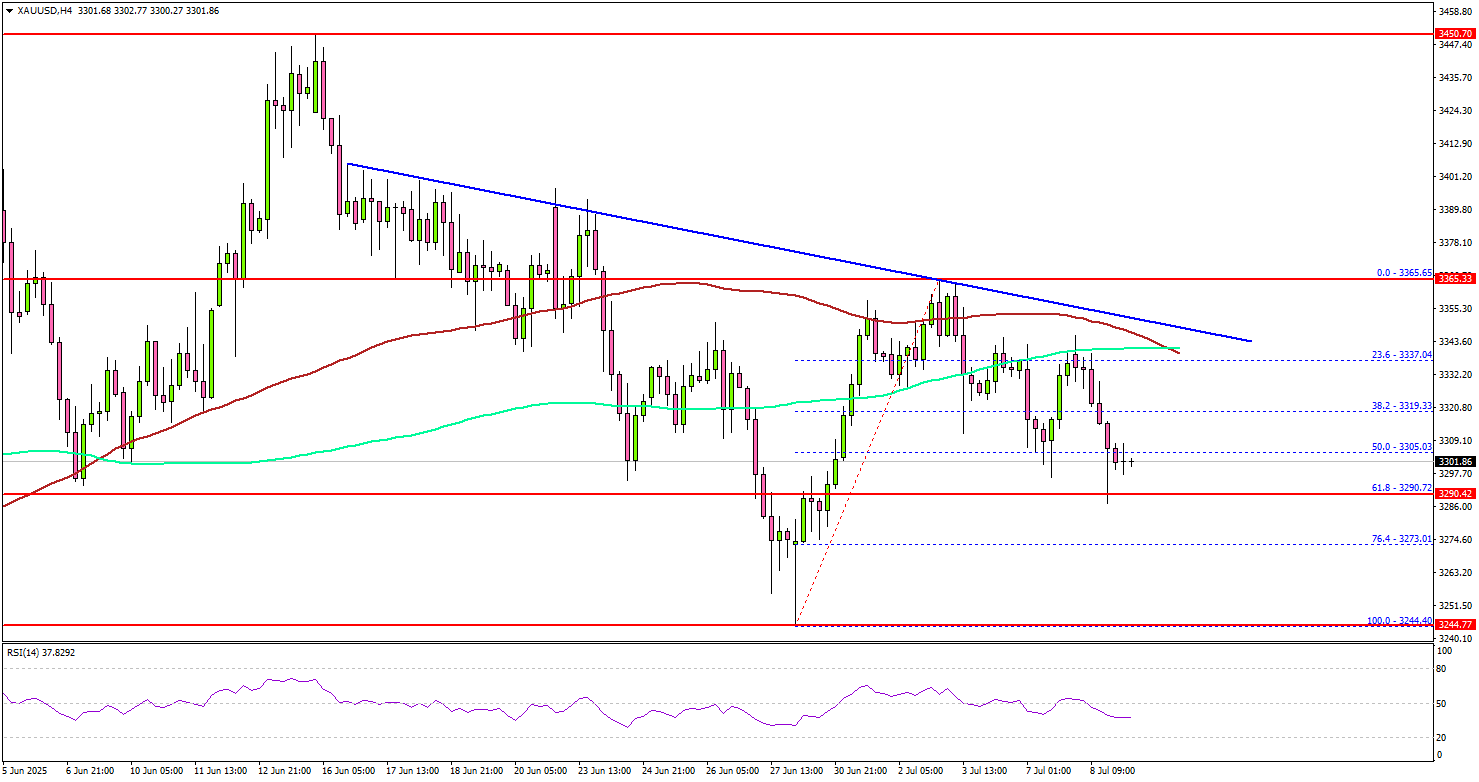
Besides, there is a key bearish trend line forming with resistance at $3,350 on the same chart. On the downside, initial support is near the $3,290 level.
The first key support is $3,280. The next major support is near the $3,272 level. The main support is now $3,245. A downside break below the $3,245 support might call for more downsides. The next major support is near the $3,220 level.
On the upside, immediate resistance is near the $3,350 level and the trend line. The next major resistance sits near the $3,360 level. The main barrier could be $3,380.
A clear move above the $3,380 resistance could open the doors for more upsides. The next major resistance could be $3,400, above which the price could rally toward the milestone level of $3,420.
Looking at WTI Crude Oil, the price is showing signs of a recovery wave but could face hurdles near the $69.25 zone.
Economic Releases to Watch Today
- FOMC Meeting Minutes.
- US Wholesale Inventories for May 2025 (preliminary) – Forecast -0.3%, versus -0.3% previous.


