published in members area of the website. As our members know, $NQ_F is forming impulsive bullish sequences in the cycle from the 16441.7 low. Recently, we forecasted the end of the short-term pull back and called for a further rally. In the following text, we’ll explain the Elliott Wave analysis and present target areas.)
Hello fellow traders. In this technical article we’re going to look at the Elliott Wave charts of NASDAQ (NQ_F) published in members area of the website. As our members know, $NQ_F is forming impulsive bullish sequences in the cycle from the 16441.7 low. Recently, we forecasted the end of the short-term pull back and called for a further rally. In the following text, we’ll explain the Elliott Wave analysis and present target areas.
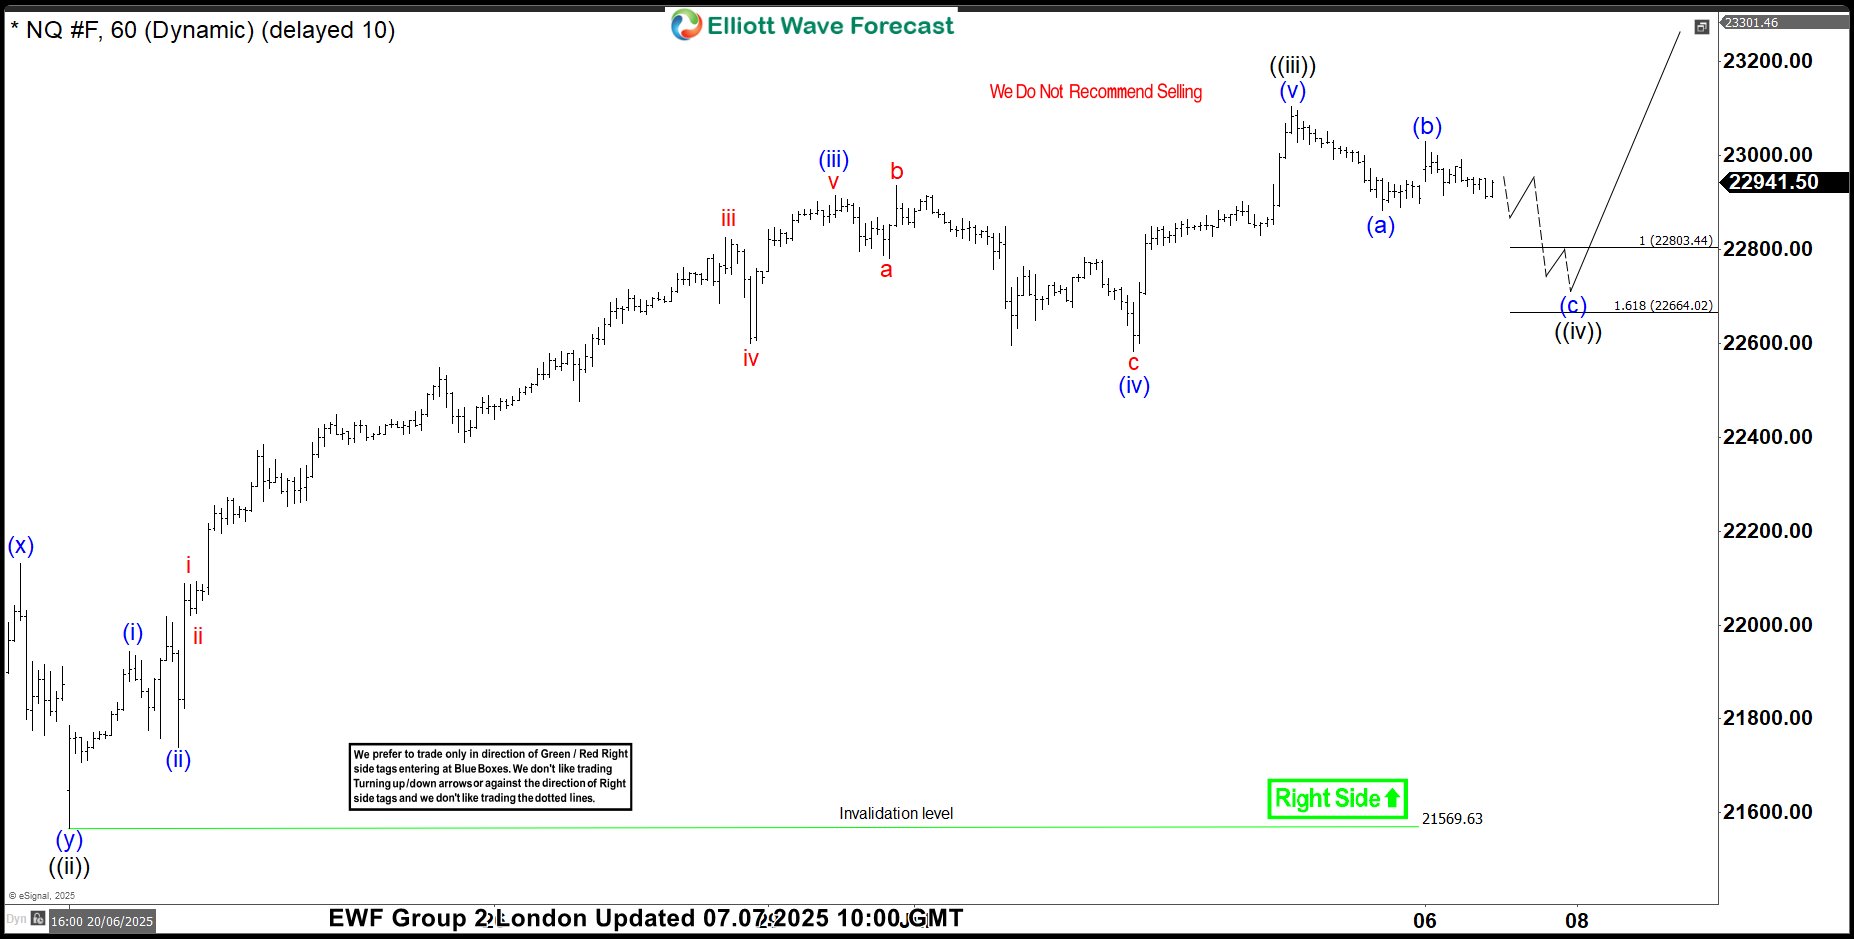
NQ_F Elliott Wave 1 Hour Chart 07.07.2025
NASDAQ is forming a three-wave pullback which still looks incomplete at the moment. Our members know that we can easily identify the reversal area by measuring the Equal Legs zone, (a) related (b), which comes in at the 22803.44-22664.02 area. We expect buyers to appear within the mentioned zone and to see a further rally in NASDAQ ($NQ_F) from there.
You can learn more about Elliott Wave Patterns at our Free Elliott Wave Educational Web Page
90% of traders fail because they don’t understand market patterns. Are you in the top 10%? Test yourself with this advanced Elliott Wave Test
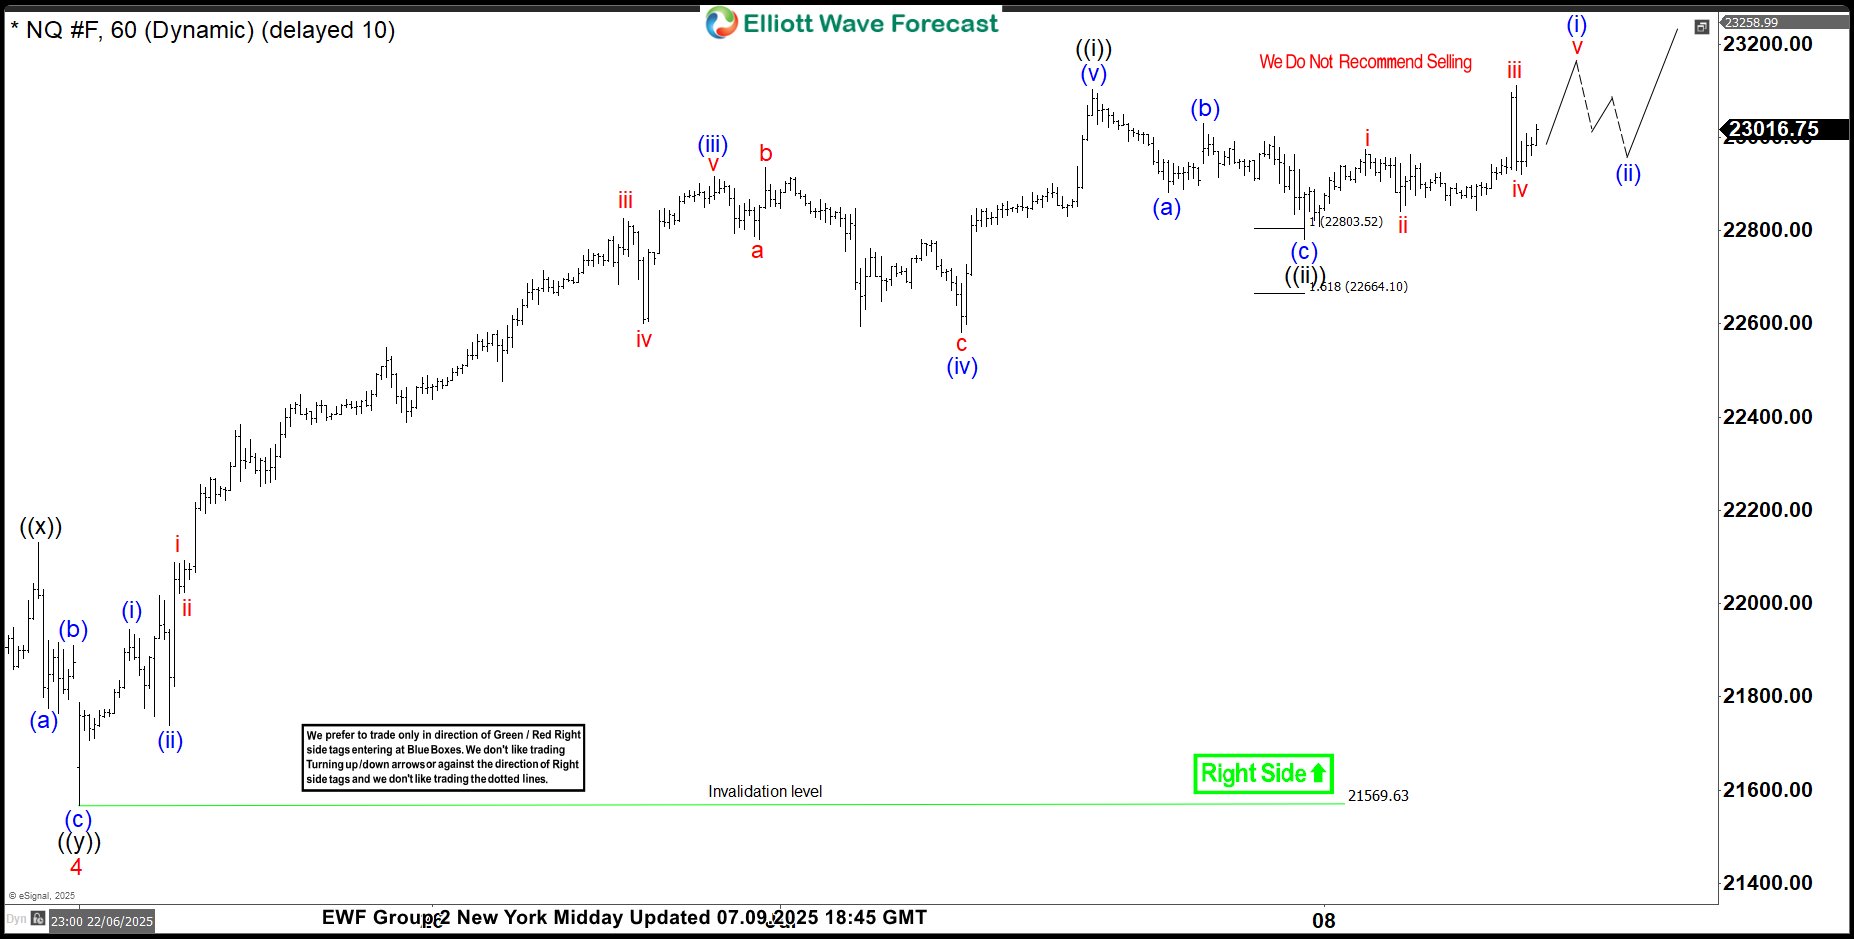
NQ_F Elliott Wave 1 Hour Chart 07.07.2025
NASDAQ found buyers as expected at the Equal Legs area and has delivered a decent rally so far. The price broke toward new highs, confirming the next leg is already in progress.