
 has recently achieved a new all-time high, signaling the onset of the next upward phase in its price trajectory. From the significant low recorded on June 22, 2025, at $98,240, Bitcoin has exhibited a robust five-wave advance, reinforcing the bullish outlook. This rally aligns with a classic five-wave impulse structure per Elliott Wave theory, a framework often used to forecast market trends. Starting from the June 22 low, wave ((i)) peaked at $102,647. It was then followed by a corrective pullback in wave ((ii)) to $99,865. The cryptocurrency then surged in wave ((iii)) to $108,358. Wave ((iv)) concluded at $106,351 after a brief dip. The final leg, wave ((v)), culminated at $108,800, completing wave 1 of a higher-degree impulse.)
Bitcoin (BTCUSD) has recently achieved a new all-time high, signaling the onset of the next upward phase in its price trajectory. From the significant low recorded on June 22, 2025, at $98,240, Bitcoin has exhibited a robust five-wave advance, reinforcing the bullish outlook. This rally aligns with a classic five-wave impulse structure per Elliott Wave theory, a framework often used to forecast market trends. Starting from the June 22 low, wave ((i)) peaked at $102,647. It was then followed by a corrective pullback in wave ((ii)) to $99,865. The cryptocurrency then surged in wave ((iii)) to $108,358. Wave ((iv)) concluded at $106,351 after a brief dip. The final leg, wave ((v)), culminated at $108,800, completing wave 1 of a higher-degree impulse.
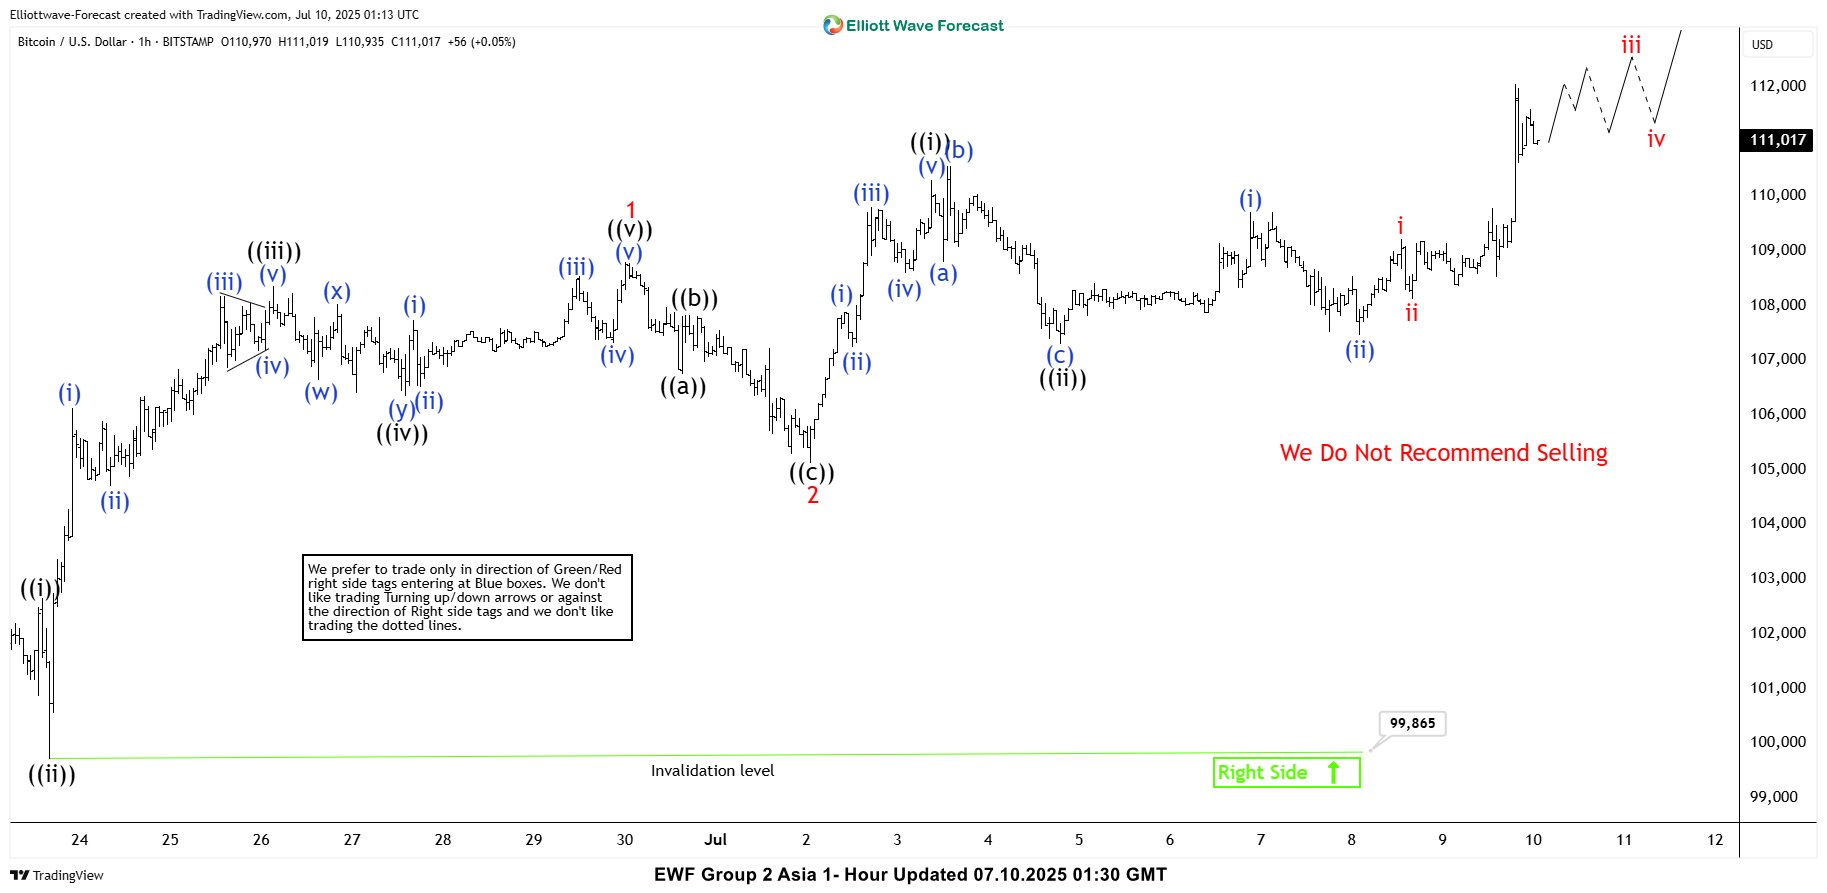
Subsequently, Bitcoin experienced a wave 2 correction, retreating to $105,130. From this level, it has begun nesting higher in wave 3. This is a phase often associated with strong momentum. Within this structure, wave ((i)) reached $110,292. Wave ((ii)) pullback followed to $107,303, forming an expanded flat pattern. Further subdividing, wave (i) peaked at $109,717, with wave (ii) dips concluding at $107,471. In the near term, as long as the pivotal low at $99,865 remains intact, any pullbacks are likely to attract buyers in a 3, 7, or 11-swing sequence, supporting further upside. This technical setup suggests Bitcoin’s bullish momentum is far from exhausted, with higher levels anticipated as the wave structure continues to unfold.
Bitcoin (BTCUSD) 60-Minute Elliott Wave Technical Chart
BTCUSD Elliott Wave Technical Video
You are currently viewing a placeholder content from Default. To access the actual content, click the button below. Please note that doing so will share data with third-party providers.