
The most traded Forex pair hasn’t disappointed traders in terms of trends and volatility throughout 2025.
Going from 1.02 to 1.18 highs in 7 months, there had been some decisive momentum to participate with as this strong buying took the Euro to highs unseen since 2021.
The geopolitical mishandles from the Trump Administration earlier this year had led to European leaders putting back the Euro unification back on the table. After some major deals were announced from Germany and other Euro Nations, the Euro started its ascent. to up 15% on the year at one point.
This theme got accompanied with general lack of confidence from the Trump Administration which led to some major US Dollar selling and financial flows rewiring.
But, it seems today that markets are taking profits on these trends, leading to some intermediate tops in the Pair currently – Let’s take a look at EURUSD Technicals to spot if there is any elements to help us see if the flows have really shifted or not.
EURUSD Multi-Timeframe analysis going from the Daily to 1H Charts
EURUSD Daily
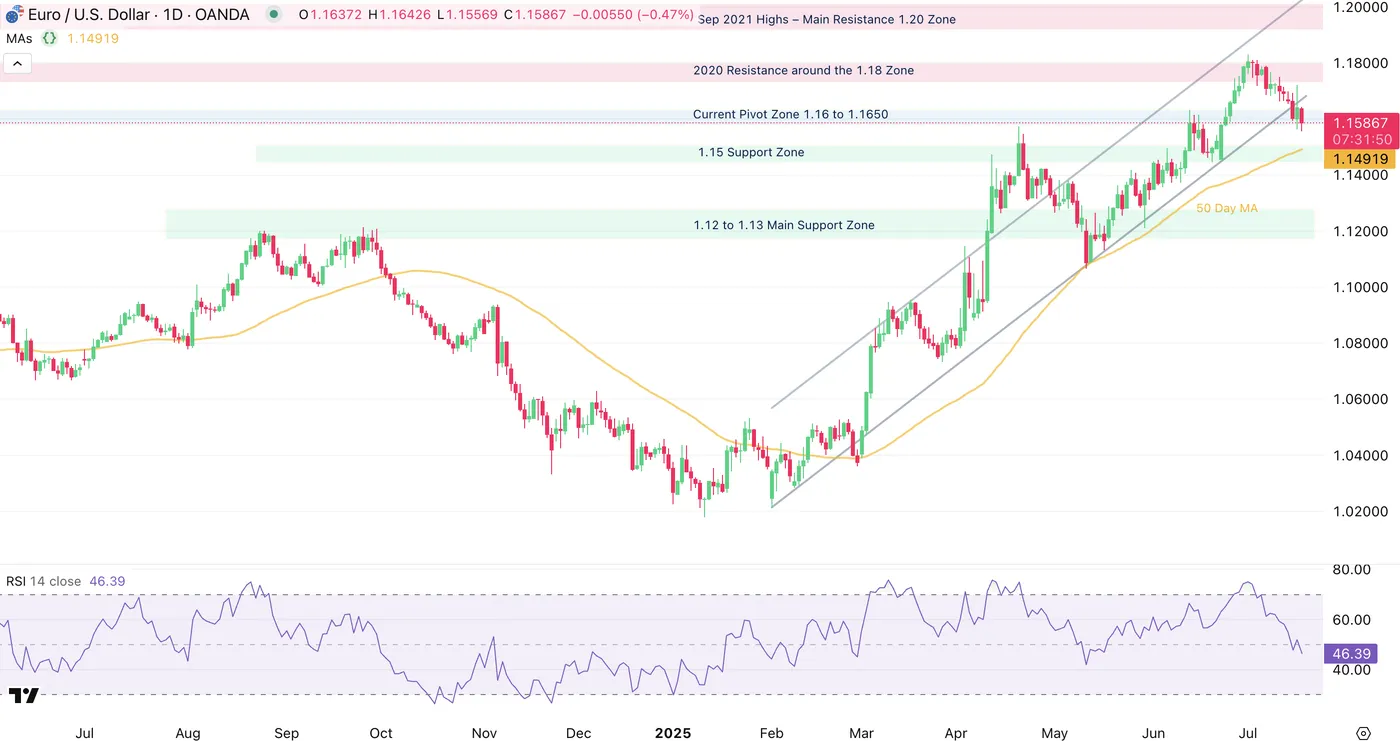
EUR/USD Daily Chart, July 17, 2025 – Source: TradingView
The Israel-Iranwar consolidation in the pair had led to a major relief rebound towards the 1.1830 2025 Highs in a strong fashion – from 1.1450 to the highs in 7 consecutive bull candles (Tight bull channel).
However, since July 1st, all currencies have found some of their strength against the US Dollar taken back and the Euro hasn’t been an exception.
Almost all daily candles have been red since that day and prices are close to back to pre-end-of-war levels – Momentum just fell below the mid-line, indicating some seller strength which will have to decisively breach below. the 50-Day Moving average to regain more control.
Higher timeframe levels to keep an eye on:
Resistance Levels:
- Current Pivot Zone 1.16 to 1.1650
- 2020 Resistance around the 1.18 Zone (2025 Highs)
- Sep 2021 Highs – Main Resistance 1.20 Zone
Support Levels:
- 1.15 Support Zone (Confluence with 50-Day MA)
- 1.12 to 1.13 Main Support Zone
- 1.10660 Last major pivot to the upside
EURUSD 4H
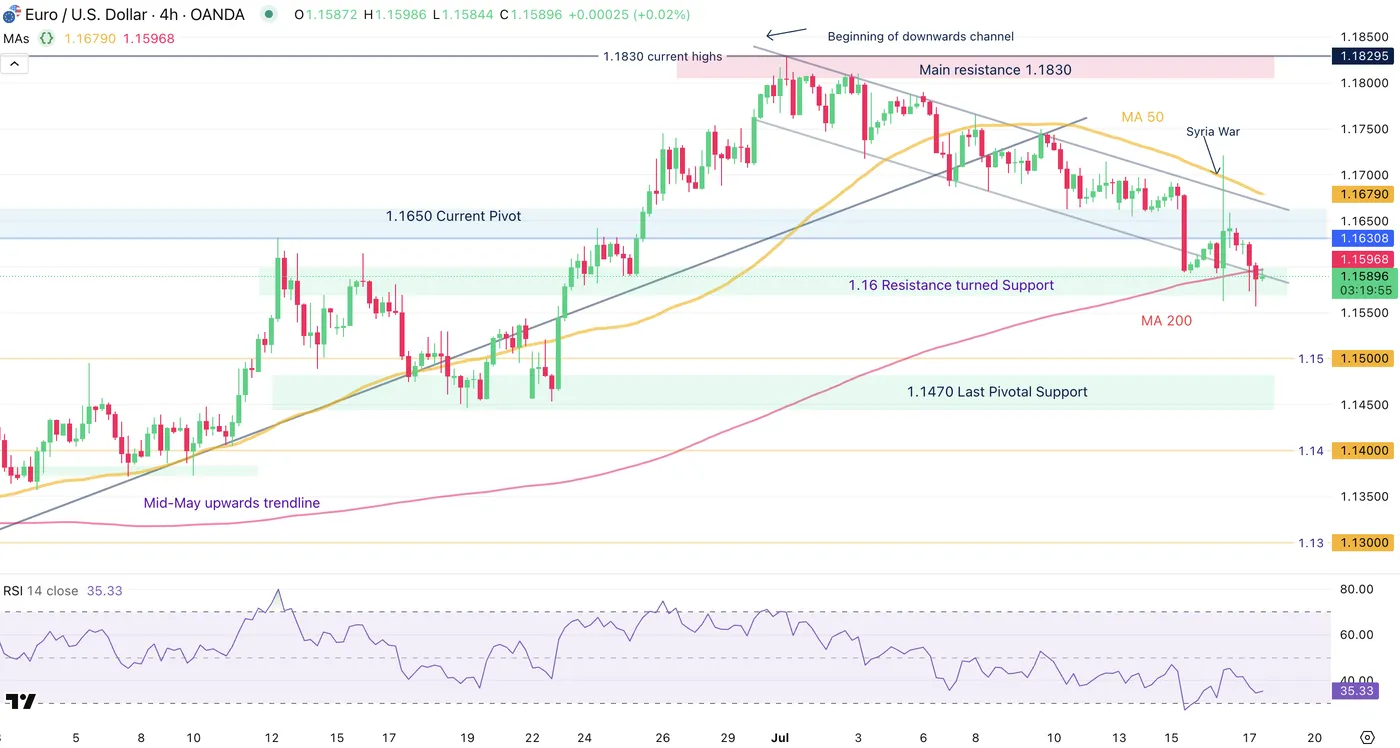
EUR/USD 4H Chart, July 17, 2025 – Source: TradingView
Looking closer allows to observe the current ongoing descending downwards channel were prices have trended down with some regularity but the move is currently stalling as markets approach oversold levels.
Prices are currently evolving between the 50 and 200 4H Moving Averages as buyers held the 1.16 Support Zone (smaller timeframe support) to bid the Pair during the past day Syria War headlines.
Monitor closely any decisive break below the 200 MA that is currently holding prices – We are currently trading just below that indicator but we would require a stronger move to assume more bearishness.
In the meantime, there is a somewhat high probability to retest the high of the range that revisits the 50 MA at the same time around 1.1678 but prices will first have to cross the 1.1620 to 1.1650 Pivot Zone.
EURUSD 1H
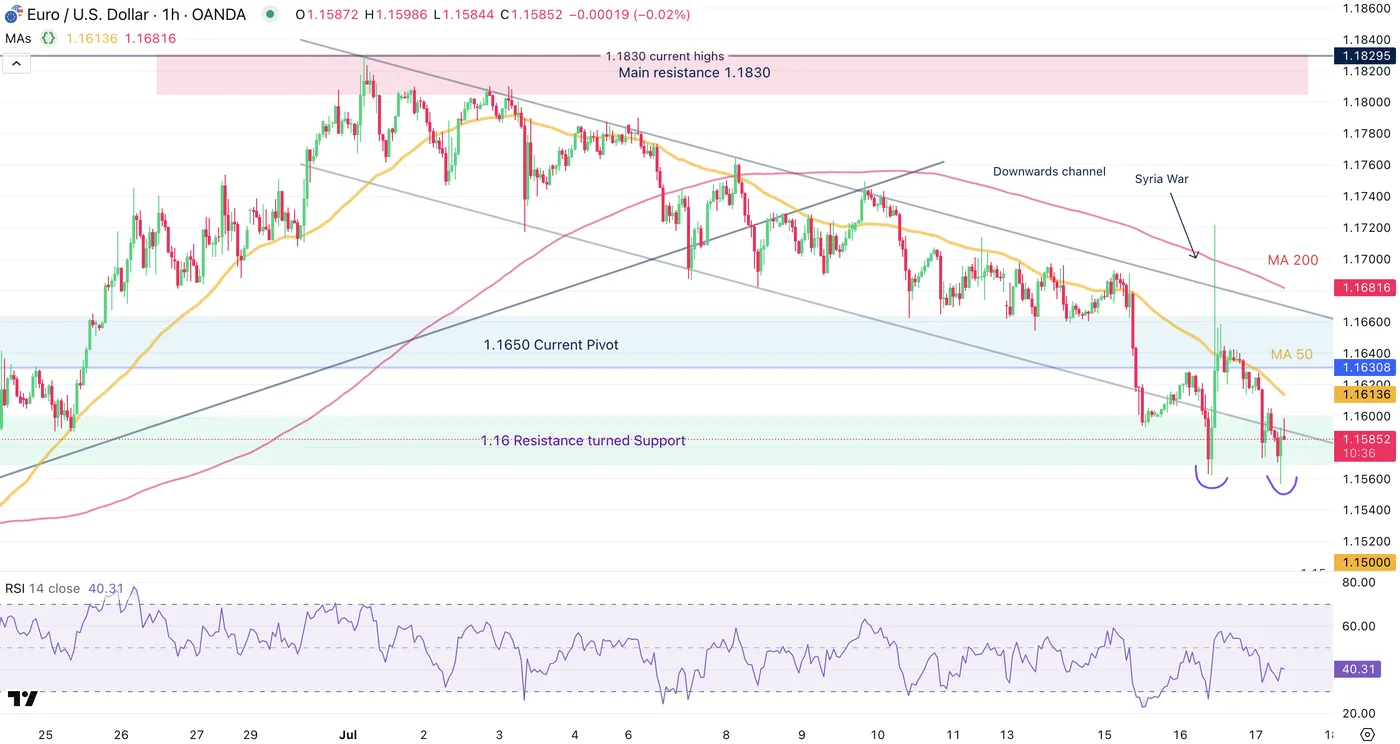
EUR/USD 1H Chart, July 17, 2025 – Source: TradingView
The ongoing session has begun with a double bottom right at the bottom of the 1.16 Support Zone (1.1560).
Anyways, buyers will still have to breach back into the downwards channel (which has been broken out overnight – coincides with the 1.16 psychological Level) to avoid a further bearish continuation.
Take a look at reactions at the low of the channel, the 1H MA 50 and the 1.1650 Pivot Zone if prices do get there.
Safe Trades!


