
.)
The week has been calm in terms of economic data releases and despite the ongoing Earnings season, Markets have been looking for headlines.
And headlines they received! Yesterday evening saw the announcement of a much anticipated US-Japan Trade Deal that would largely diminish announced tariffs from 25% and more to an actual of 15% on Auto Imports.
You can read more on the deal right here. – Except for wishy-washy trading in USDJPY, Equities have appreciated the news. The Nikkei closed the Asia session up around 4.50% and European stocks have also been lifted by the news.
In the US, the Indices have opened positive but the trend that started in the beginning of the week is currently continuing:
The Nasdaq is seeing some profit-taking and these flows are going towards the Dow Jones, with Futures and CFD prices still positive since the start of the day but the actual open is mixed, seeing some selling.
AT&T have released earnings beating EPS and Revenues by a decent margin, setting the stage for some more confidence in US Stocks.
The Industrial-focused Index has been strong within its ongoing range, and in the waiting of the Alphabet (Google) and Tesla earnings, the relative strength for the Dow is poised to continue.
Dow Jones vs Nasdaq Comparative weekly performance
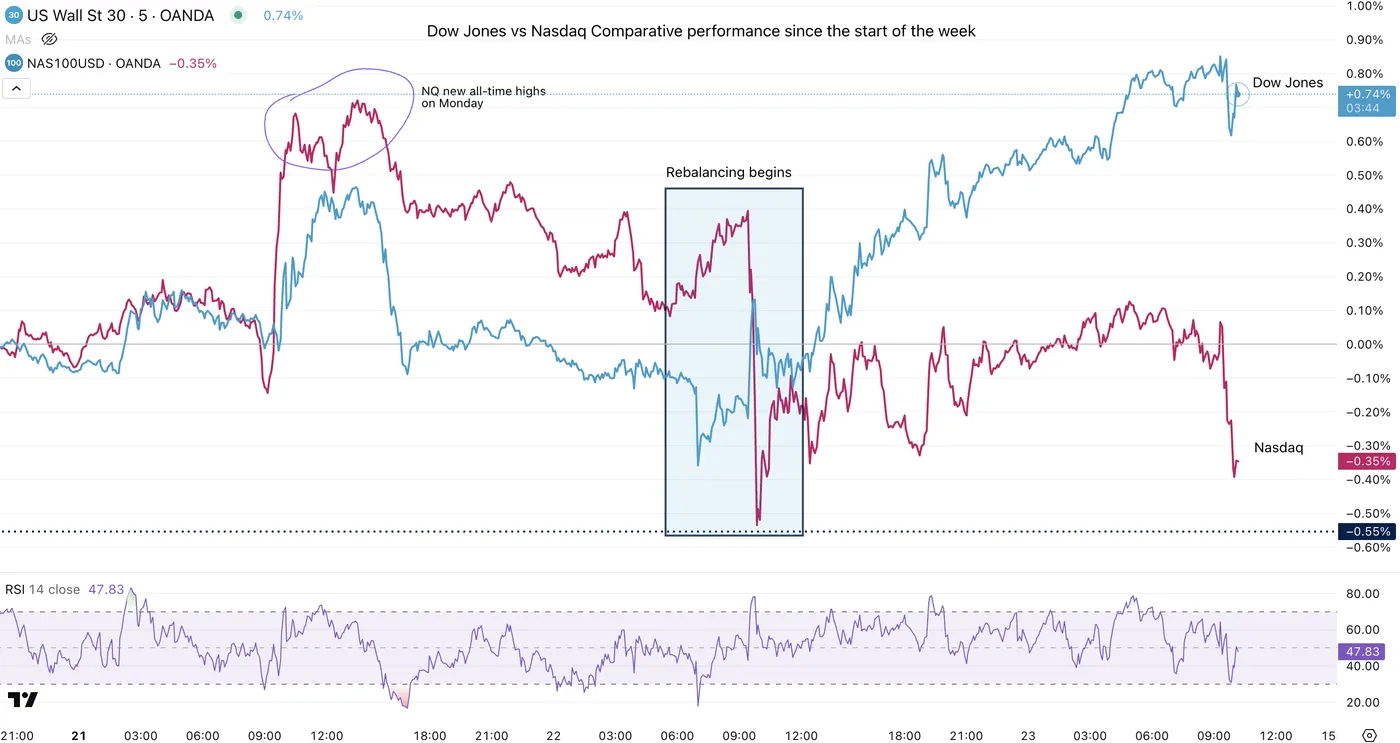
Dow Jones vs Nasdaq Relative Strength, July 23 2025 – Source: TradingView
Tech had started the week on a strong note but since the middle of yesterday’s session, there has been some powerful rewiring of positioning in the US Indices, with Tech struggling vs Healthcare, Banking Consumer Cyclical and Defensive stocks – A reverse of the prior year trend.
This is allowing the Dow to shine again in today’s session.
Dow Jones Intraday Technical Analysis
1H Timeframe
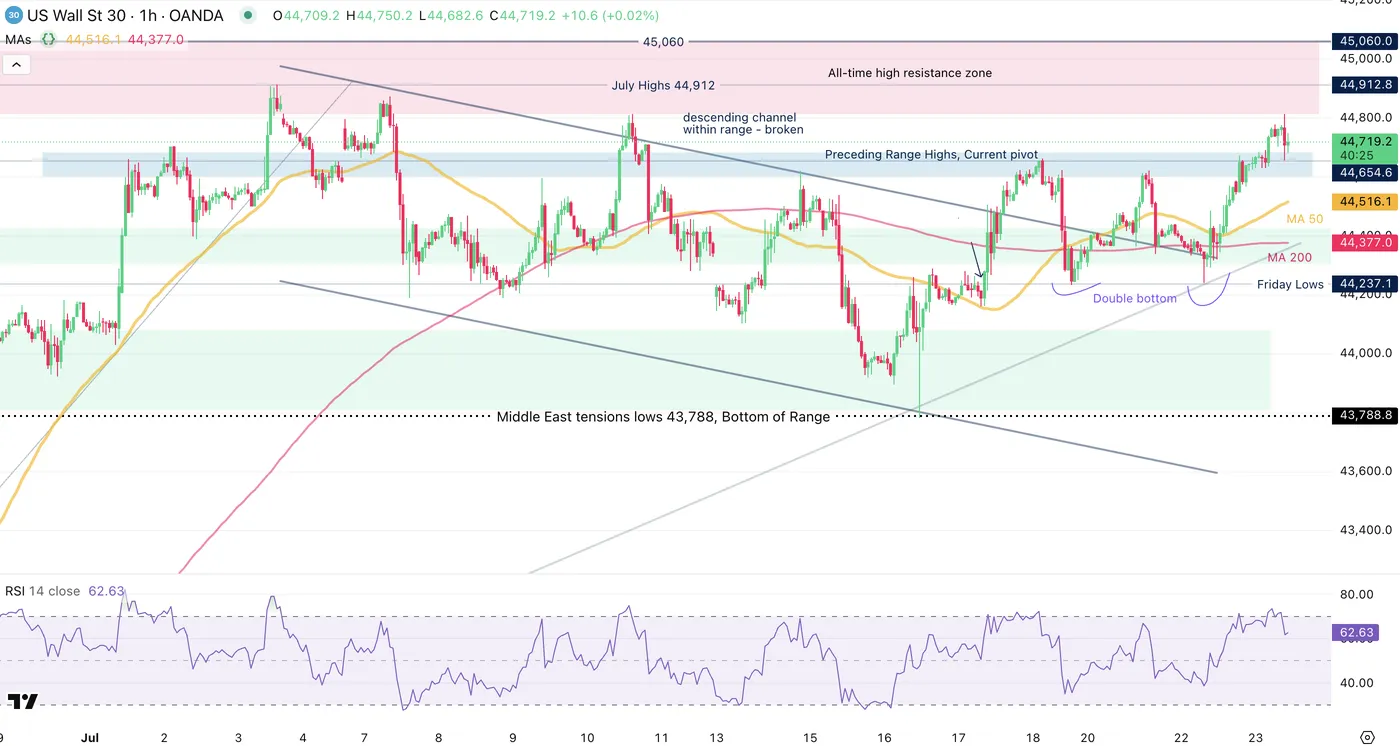
Dow Jones 1H Chart, July 23 2025 – Source: TradingView
The Dow has officially broken out of the descending channel that was occuring within the ongoing July Range (44,912 highs and 43,788 Lows).
With the ongoing relative strength in the US 30, bulls have broken above the 75% percentile of the range on a clear, lower timeframe double bottom and prices are currently consolidating just above this point that was precedently resistance, now pivot.
These levels are:
Support Levels:
- Immediate Pivot (preceding Resistance): 44,600 to 44,700
- 50-Period 1H MA 44,515
- Strong Support on Double Bottom and 200-H MA – 44,200 to 44,300
- 43,780 to 44,100 Major Support
Resistance Levels:
- 44,810 Daily Highs
- 44,912 July Highs
- 45,060 All-time Highs
15M Timeframe
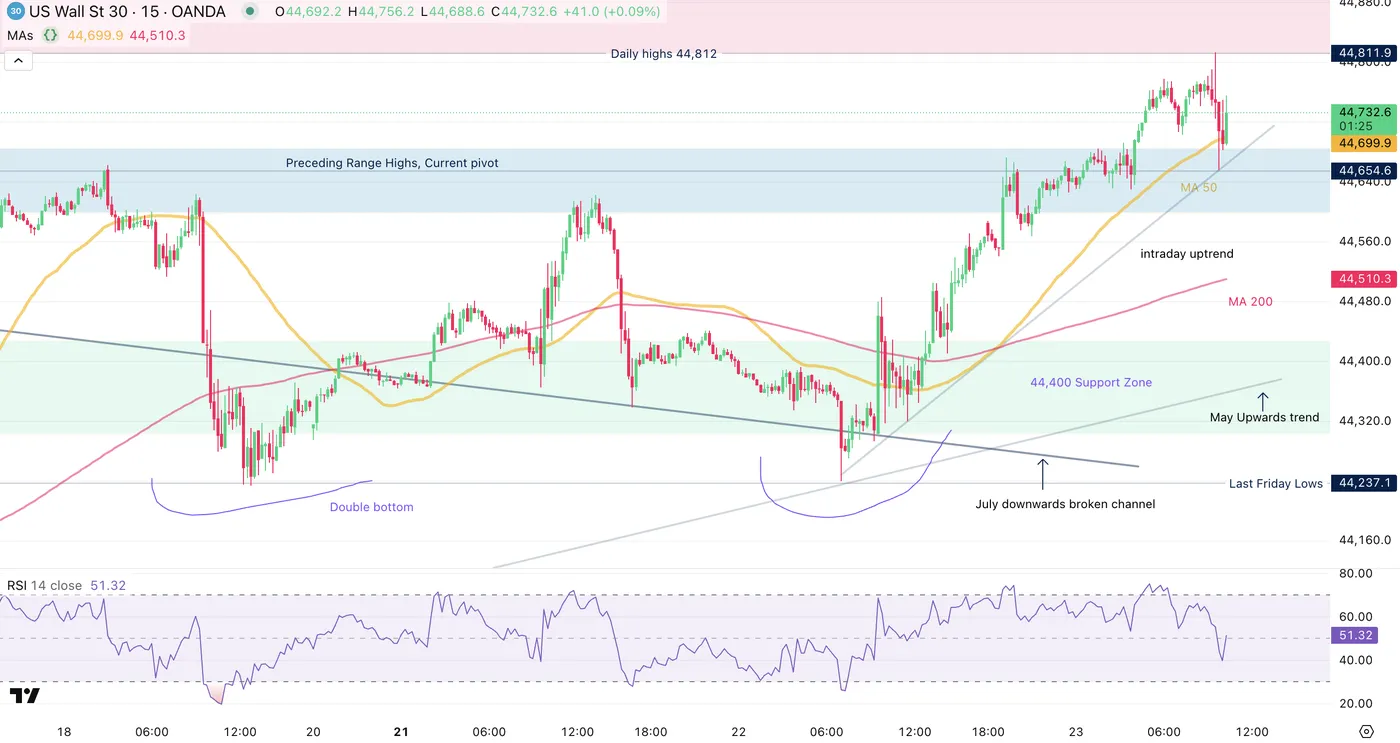
Dow Jones 15m Chart, July 23 2025 – Source: TradingView
Buyers have held a strong intraday uptrend that had formed yesterday afternoon.
RSI Momentum is currently neutral after coming back from overbought, with bulls having to maintain above the Pivot to keep their strong hands – Monitor momentum as the price action is mixed on the lower timeframe but the latest 15m bull candle is a strong one.
Breaking above 44,812 (Daily highs) will point towards the July highs, but after that, there won’t be much until the All-time highs.
Failing to hold above the 44,600 to 44,700 Pivot will re-affirm the preceding range and point to more balanced price action.
Safe Trades in the waiting of this afternoon’s key earnings!