
Gold price started a fresh decline below $3,380. WTI crude oil is also down and remains at risk of more losses below $64.60.
Important Takeaways for Gold and WTI Crude Oil Prices Analysis Today
- Gold price climbed higher toward the $3,430 zone before there was a sharp decline against the US Dollar.
- A key bearish trend line is forming with resistance near $3,350 on the hourly chart of gold at FXOpen.
- WTI crude oil price continued to decline below the $66.00 support zone.
- It traded below a connecting bullish trend line with support at $65.60 on the hourly chart of XTI/USD at FXOpen.
Gold Price Technical Analysis
On the hourly chart of gold at FXOpen, the price climbed above the $3,380 resistance. The price even spiked above $3,400 before the bears appeared.
A high was formed near $3,432 before there was a fresh decline. There was a move below the $3,380 support level. The bears even pushed the price below the $3,350 support and the 50-hour simple moving average.
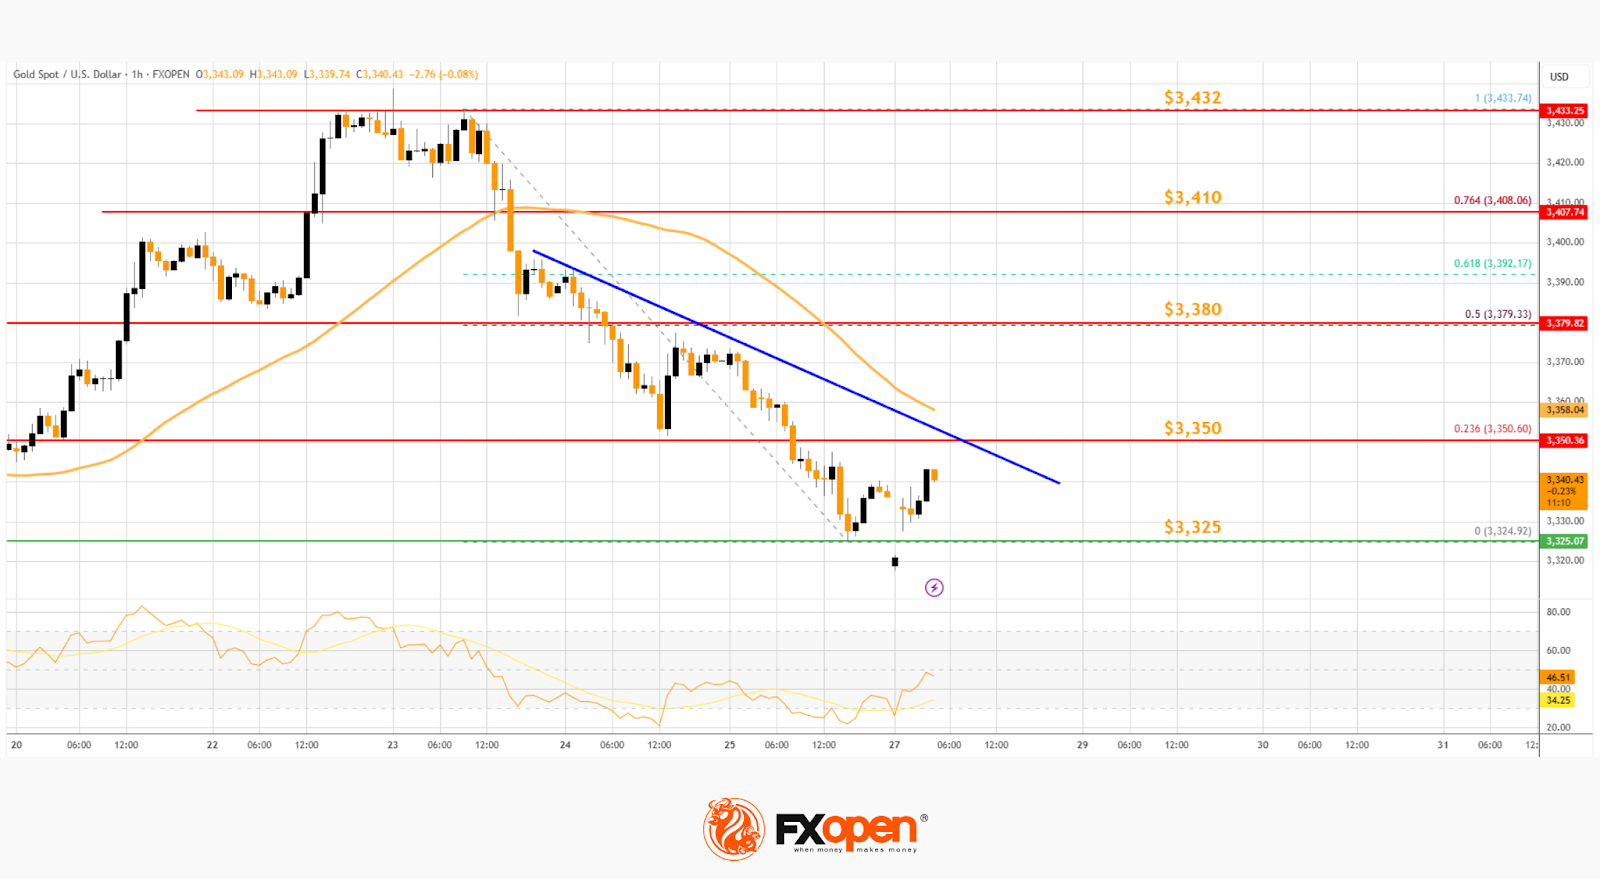
It tested the $3,325 zone. A low was formed near $3,325 and the price is now showing bearish signs. There was a minor recovery wave towards the 23.6% Fib retracement level of the downward move from the $3,433 swing high to the $3,325 low.
However, the bears are active below $3,342. Immediate resistance is near $3,350. There is also a key bearish trend line forming with resistance near $3,350.
The next major resistance is near the $3,380 zone. It is close to the 50% Fib retracement level of the downward move from the $3,433 swing high to the $3,325 low. The main resistance could be $3,410, above which the price could test $3,432. The next major resistance is $3,450.
An upside break above $3,450 could send the gold price towards $3,465. Any more gains may perhaps set the pace for an increase toward the $3,480 level.
Initial support on the downside is near the $3,325 level. The first major support is near the $3,310 level. If there is a downside break below it, the price might decline further. In the stated case, the price might drop towards the $3,265 support.
WTI Crude Oil Price Technical Analysis
On the hourly chart of WTI crude oil at FXOpen, the price struggled to continue higher above $67.50. The price formed a short-term top and started a fresh decline below $66.00.
There was a steady decline below the $65.80 pivot level. The bears even pushed the price below $65.00 and the 50-hour simple moving average. The price traded below a connecting bullish trend line with support at $65.60.
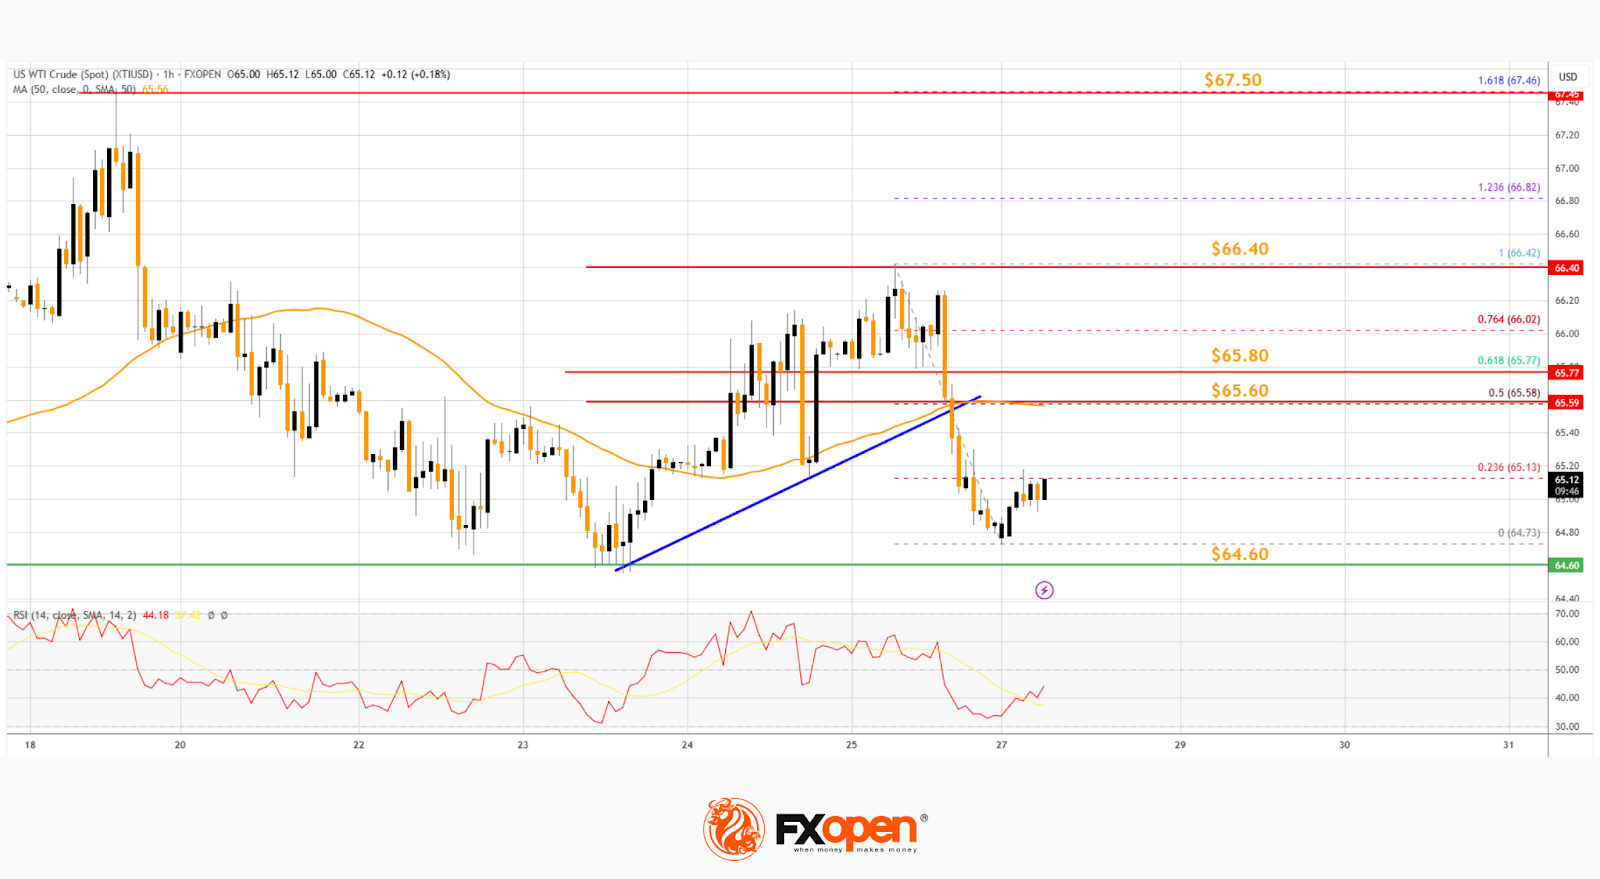
Finally, the price tested the $64.75 zone. The recent swing low was formed near $64.73, and the price is now consolidating losses. On the upside, immediate resistance is near the $65.60 zone. It is close to the 50% Fib retracement level of the downward move from the $66.42 swing high to the $64.73 low.
The main resistance is $65.80. A clear move above it could send the price towards $66.40. The next key resistance is near $67.50. If the price climbs further higher, it could face resistance near $70.00. Any more gains might send the price towards the $72.00 level.
Immediate support is near the $64.60 level. The next major support on the WTI crude oil chart is near $63.20. If there is a downside break, the price might decline towards $60.00. Any more losses may perhaps open the doors for a move toward the $55.00 support zone.
Start trading commodity CFDs with tight spreads. Open your trading account now or learn more about trading commodity CFDs with FXOpen.
This article represents the opinion of the Companies operating under the FXOpen brand only. It is not to be construed as an offer, solicitation, or recommendation with respect to products and services provided by the Companies operating under the FXOpen brand, nor is it to be considered financial advice.


