
The session is risk-on as market participants already seem to be moving on from the consequent miss and downwards revisions to the NFP data – and this was just Friday.
Some questions remain on the current state of affairs as safe-havens have also appreciated on the session, but the rally is still way more consequent in risk-assets.
Cryptos haven’t rejected the positive mood around markets as most digital assets are green today, and by a decent margin.
They were leading on the way down after starting to correct last Wednesday and most coins are now aiming to catch up to their recent highs.
Bitcoin wicked on its support zone at 112,000 and now trades around the $115,000 level – Sentiment will need to be watched closely to monitor potential bull traps, but for now the day is green.
Taking a look at the ongoing session for Cryptocurrencies
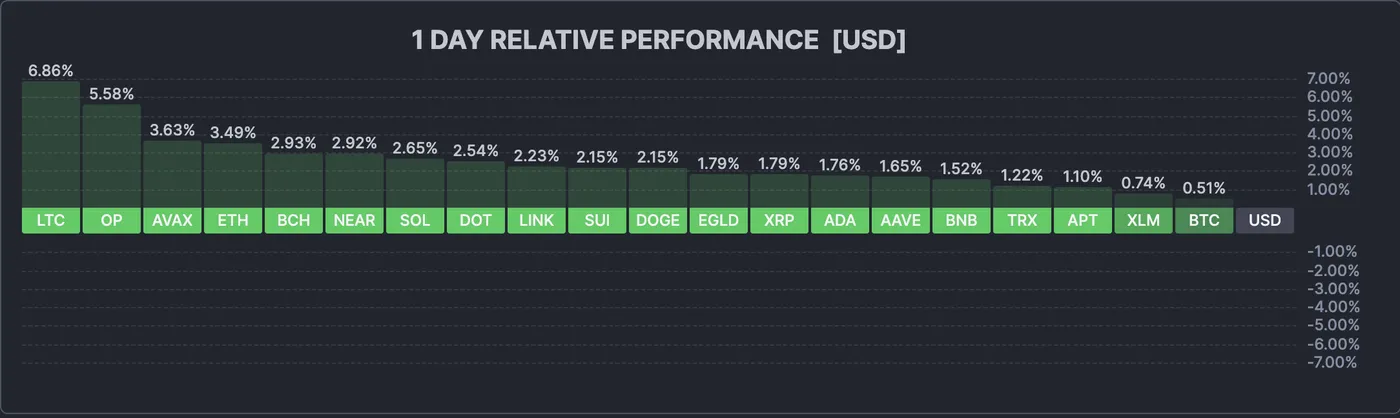
Current session in Cryptocurrencies, August 4, 2025 – Source: Finviz
The picture is very green for now, with cryptos up between 0.50% for BTC to 7% for Litecoin.
There has been some kind of small intraday top that has just formed though – let’s take a look at Bitcoin and Ethereum to see if it has there is some more potential to the current move.
Bitcoin 4H Chart
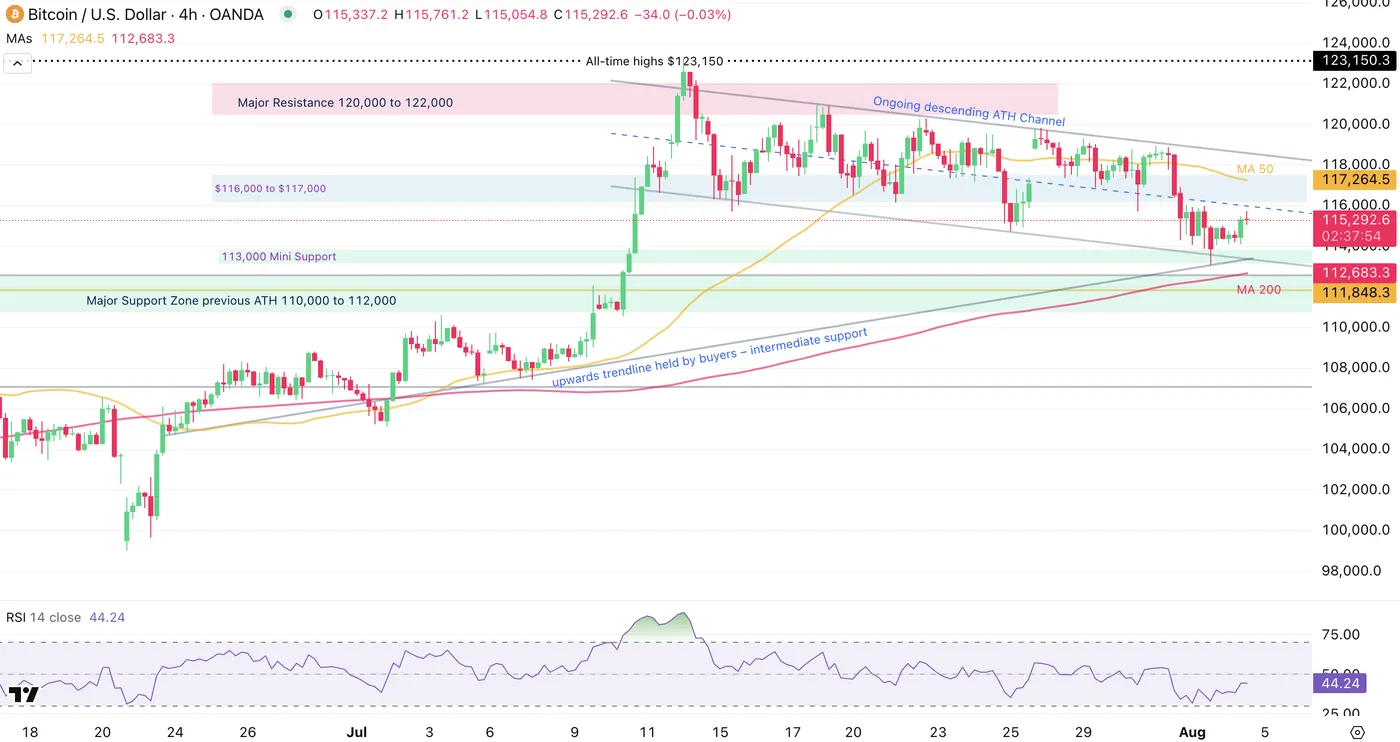
Bitcoin 4H Chart, August 4, 2025 – Source: TradingView
This weekend marked some touches to the $112,000 level serving as Main support which triggered some small buying.
Momentum is stalling a tid bit as the middle level of the downwards ATH descending channel is approaching.
Traders will need to be watch for the reactions at the current level:
Rejecting here shows a more bearish outlook (as prices would fail to breach the mid-line, a typical sign of buyer exhaustion) while consolidating here / breaking above would point to a test of the higher bounds of the channel around $118,500.
Levels to place on your charts:
Support Levels:
- lower bound of descending Channel $113,200
- Previous ATH Support $110,000 to $112,000
- $100,000 Major Support
Resistance Levels:
- $116,000 to 117,000 Pivot (confluence with 4H MA 50)
- $120,000 Resistance (+/- $300)
- Current ATH Resistance $121,000 to $123,000
Ethereum 4H Chart
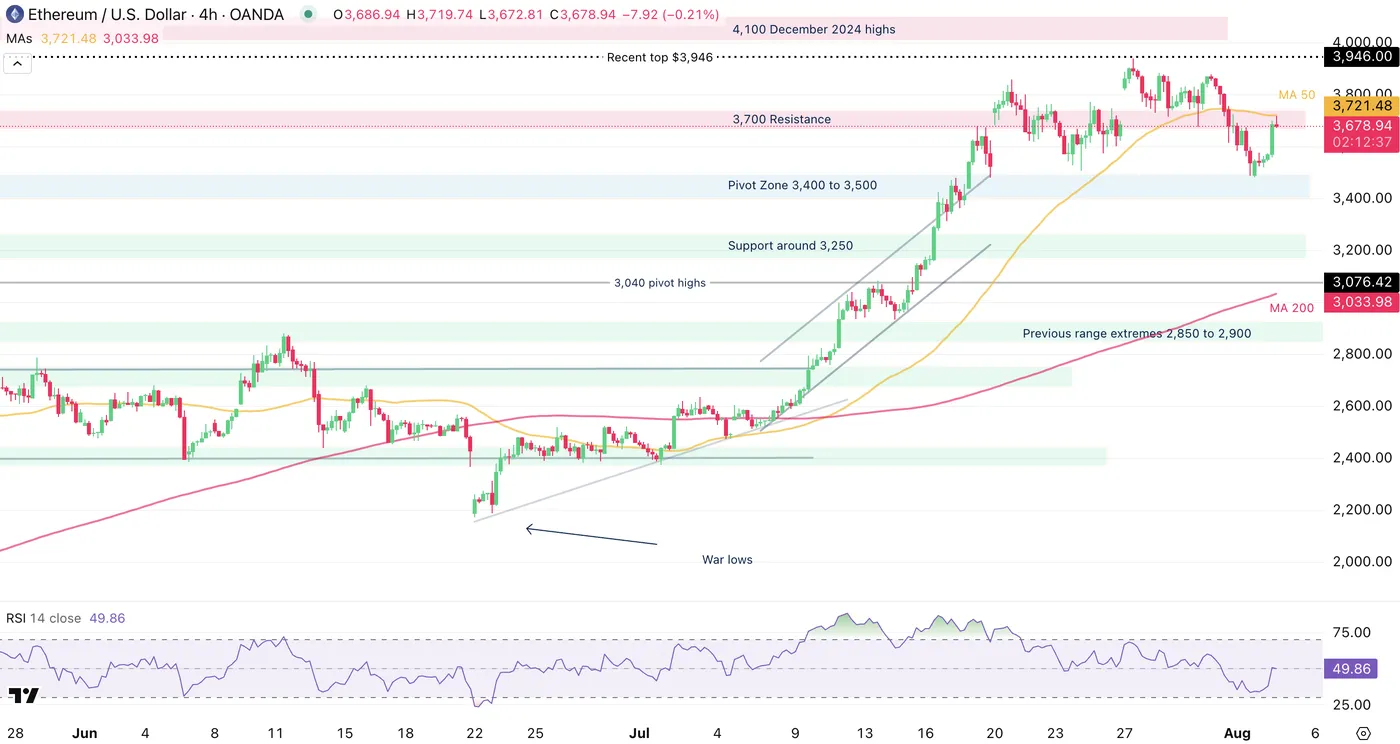
Ethereum 4H Chart, August 4, 2025 – Source: TradingView
Ethereum has rallied strongly in the session, up at one point 4.30%.
Some sellers seem to be appearing at the 4H MA 50 at a confluence with the $3,700 resistance zone.
RSI is back from bearish to neutral but the imminent action is essential as the momentum seems to be stalling around here – Failing to pass above the neutral line gives a more bearish tilt.
Levels to place on your charts:
Support Levels:
- Overnight lows $3,483
- Pivot Zone 3,400 to 3,500
- Support around 3,250
Resistance Levels:
Immediate resistance Between $3,700 to $3,750
- 4H MA 50 $3721
- $3,946 Intermediate highs
- $4,090 December 2024 highs
- $4,870 All-time highs
Safe Trades!


