
GBP/USD is attempting a recovery wave above the 1.3215 resistance. EUR/GBP is consolidating and might aim for a fresh increase above 0.8700.
Important Takeaways for GBP/USD and EUR/GBP Analysis Today
- The British Pound is attempting a fresh increase above 1.3265.
- There is a contracting triangle forming with resistance at 1.3375 on the hourly chart of GBP/USD at FXOpen.
- EUR/GBP is trading in a positive zone above the 0.8665 pivot level.
- There is a short-term declining channel forming with resistance near 0.8705 on the hourly chart at FXOpen.
GBP/USD Technical Analysis
On the hourly chart of GBP/USD at FXOpen, the pair declined after it failed to clear the 1.3600 resistance. As mentioned in the previous analysis, the British Pound even traded below the 1.3350 support against the US Dollar.
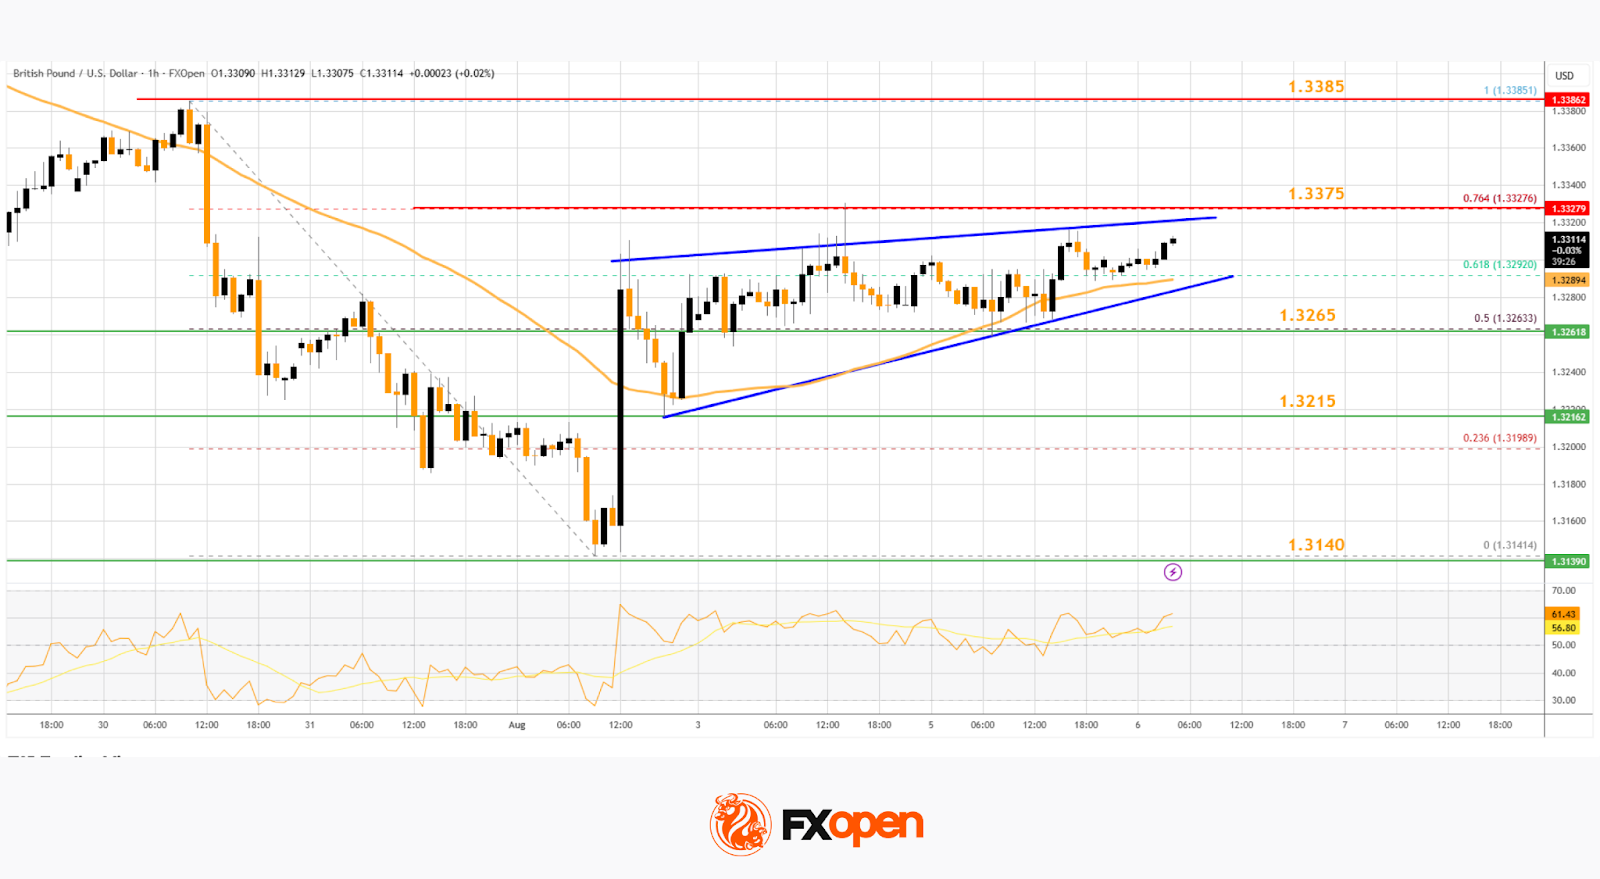
Finally, the pair tested the 1.3140 zone and is currently attempting a fresh increase. The bulls were able to push the pair above the 50-hour simple moving average and 1.3215. The pair even climbed above the 1.3265 level.
The bulls were able to push the pair above the 50% Fib retracement level of the downward move from the 1.3385 swing high to the 1.3141 low.
On the upside, the GBP/USD chart indicates that the pair is facing resistance near 1.3375. There is also a contracting triangle forming with resistance at 1.3375 and the 76.4% Fib retracement level of the downward move from the 1.3385 swing high to the 1.3141 low.
The next major resistance is near 1.3385. A close above the 1.3385 resistance zone could open the doors for a move toward 1.3450. Any more gains might send GBP/USD toward 1.3550.
On the downside, there is decent support forming at 1.3265. If there is a downside break below 1.3265, the pair could accelerate lower. The first major support is near the 1.3215 level. The next key support is seen near 1.3140, below which the pair could test 1.3050. Any more losses could lead the pair toward 1.3000.
EUR/GBP Technical Analysis
On the hourly chart of EUR/GBP at FXOpen, the pair started a consolidation phase after it failed to surpass 0.8730. The Euro traded below the 0.8710 and 0.8700 support levels against the British Pound.
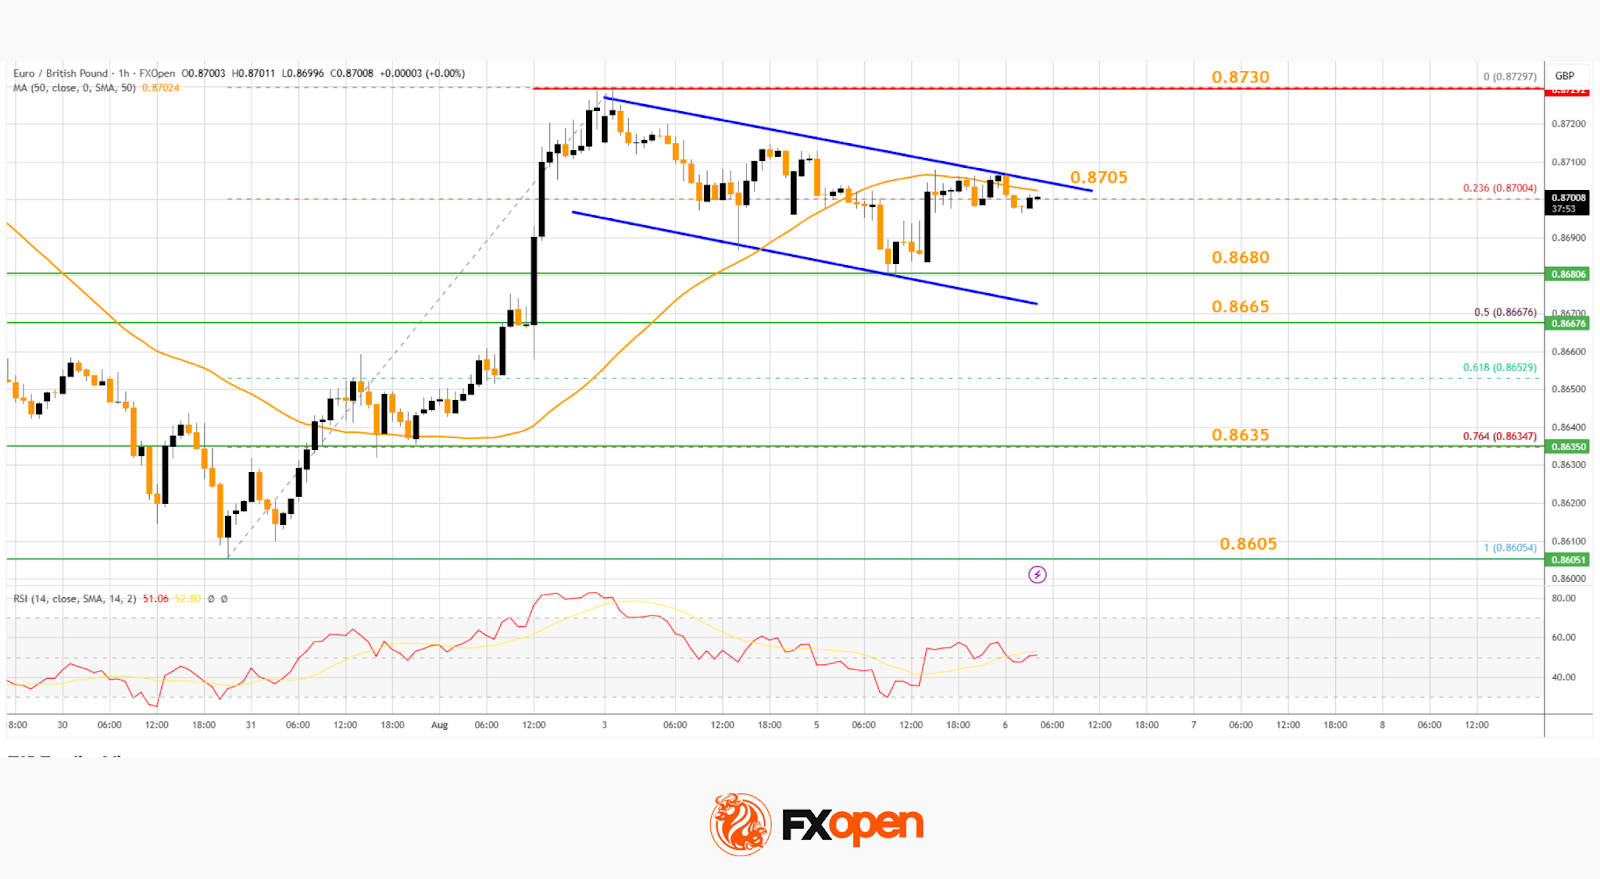
The EUR/GBP chart suggests that the pair even declined below the 23.6% Fib retracement level of the upward move from the 0.8605 swing low to the 0.8729 high. It is now consolidating losses and trading below the 50-hour simple moving average.
The pair is now facing resistance near the 0.8705 level. There is also a short-term declining channel forming with resistance near 0.8705.
The next major resistance could be 0.8730. The main resistance is near the 0.8750 zone. A close above the 0.8750 level might accelerate gains. In the stated case, the bulls may perhaps aim for a test of 0.8780. Any more gains might send the pair toward the 0.8800 level.
Immediate support sits near 0.8680. The next major support is near 0.8665 or the 50% Fib retracement level of the upward move from the 0.8605 swing low to the 0.8729 high.
A downside break below 0.8665 might call for more downsides. In the stated case, the pair could drop toward 0.8635.
Trade over 50 forex markets 24 hours a day with FXOpen. Take advantage of low commissions, deep liquidity, and spreads from 0.0 pips. Open your FXOpen account now or learn more about trading forex with FXOpen.
This article represents the opinion of the Companies operating under the FXOpen brand only. It is not to be construed as an offer, solicitation, or recommendation with respect to products and services provided by the Companies operating under the FXOpen brand, nor is it to be considered financial advice.


