
Dow Jones: ⬇️ Sell
- Dow Jones reversed from strong resistance level 45000.00
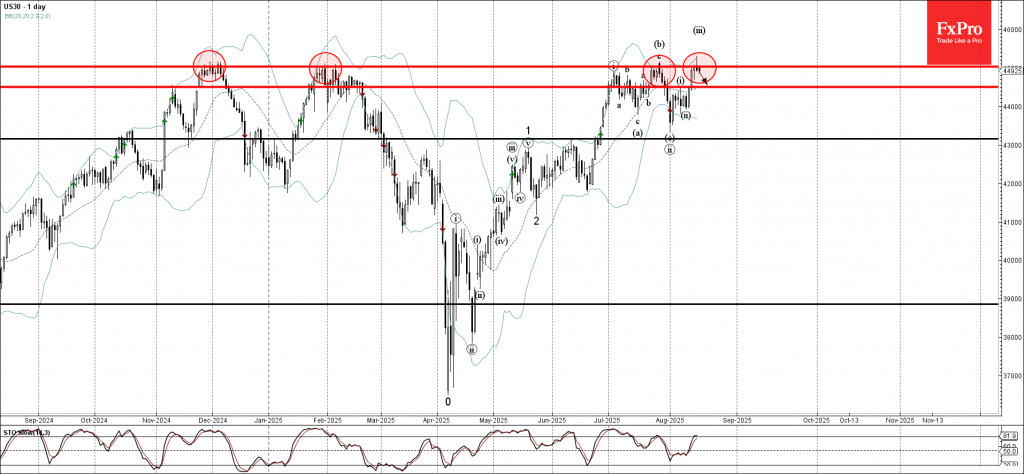
- Likely to fall to support level 44500.00
Dow Jones index recently reversed down from the resistance zone located between the strong resistance level 45000.00 (which has been reversing the price from the end of 2024) and the upper daily Bollinger Band.
The downward reversal from this resistance zone created the daily Japanese candlesticks reversal pattern Shooting Star.
Given the strength of the resistance level 45000.00 and the overbought daily Stochastic, Dow Jones index can be expected to fall to the next support level 44500.00.


 and the upper daily Bollinger Band.)