
GBPJPY is one of the most volatile FX pair available to trade including only major currencies – Yet, it’s been stuck in a huge range since August 2024.
As explained in our previous article on this currency pair, a continuous uptrend from 2020 lows (127.30!) to July 2024 highs (208.12) has been met with a sharp correction as carry trades saw a consequent slowdown amid a sudden market-breakdown which suddenly saw yen rebuying speed up.
At the same time, equities saw a huge correction, which got followed with the usual dip-buying.
Anyways, this time, a consistent shorter-range uptrend has built up momentum from April lows (184.50) to the higher bound of the year-long consolidation.
With buyers stepping in after a August retracement, a consequent bull-sequence took the pair to a wick at new yearly highs (201.27).
Let’s have a look at multi-timeframe charts to spot levels of interest and see if the most recent rejection below 200.00 can hold further or a breakout is due.
GBPJPY multi-timeframe analysis
GBPJPY daily timeframe
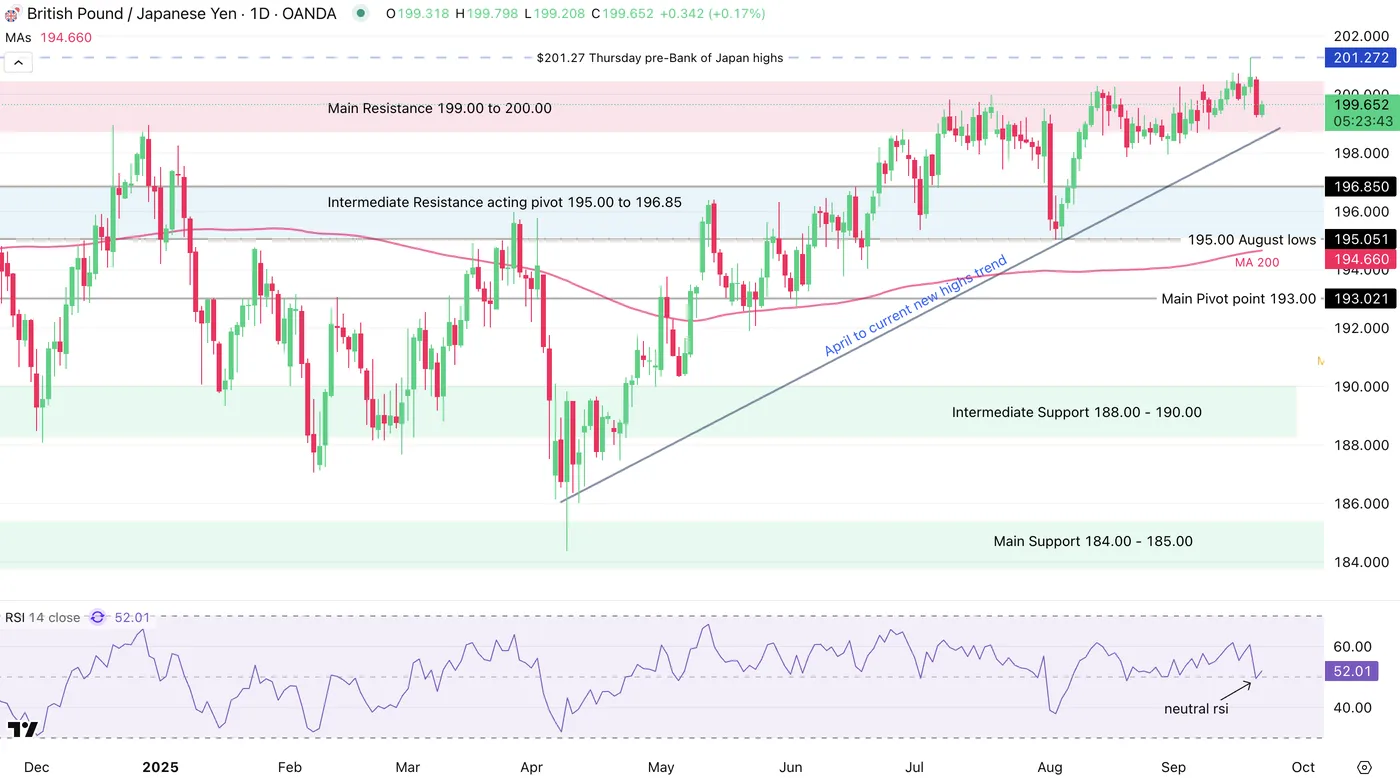
GBPJPY Daily Chart, September 22, 2025 – Source: TradingView
Markets have built towards higher levels in the pair throughout the past 5 months as weak fundamentals haven’t helped the Yen to find consequent buying.
However, some hawkishness as been denoted in last week’s Bank of Japan meeting and as the Bank of England just cut its rate to 4% at its last meeting, rates between Japan and the UK are still expected to converge through time.
The rest is for markets to spot when the BoJ will actually hike which should provide a further boost to the yen – a sign for sellers to step in further.
But markets react to such noise initially before being more patient and waiting for the actual news to drop – There is a bit less of a hike priced in the Japanese short-end curve for the rest of the year.
But increased hawkish talk may assist the selling in the pair and needs to be tracked closely, particularly after the most recent failed bullish-breakout.
GBPJPY 4H chart and levels
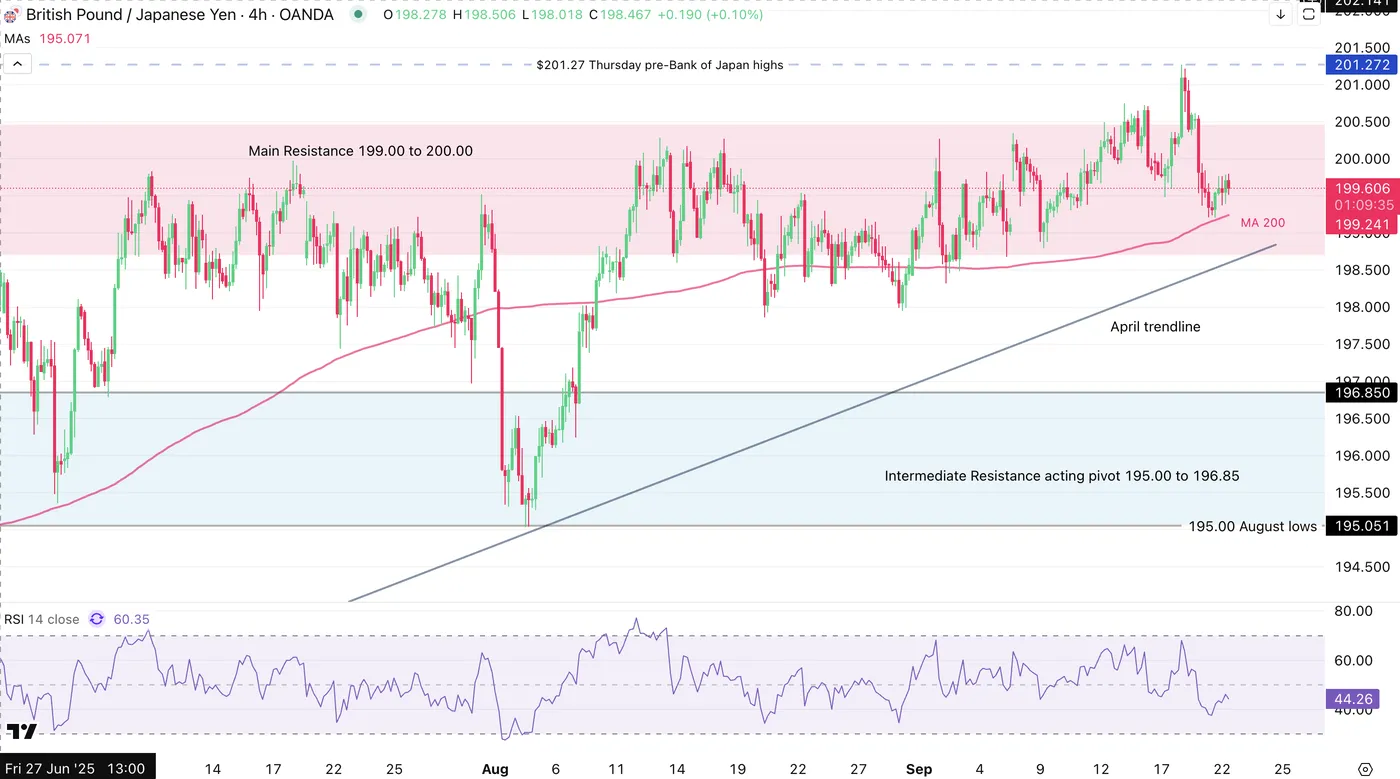
GBPJPY 4H Chart, September 22, 2025 – Source: TradingView
As can be observed on this 4H chart, the V-shaped return to the 199.00 to 200.00 resistance has built a consolidation level just above the 200-period MA which now serves as immediate momentum level for future action.
A break below should accelerate selling towards the April trendline, and further downside could be expected below (towards a retest of the August 5th lows).
A failure to break the low of the resistance should amplify the consolidation further – Keep a close eye on the 4H 200-period MA.
Levels to watch for GBPJPY trading:
Support Levels:
- Low of 199.00 to 200.00 resistance (198.70)
- Intermediate Range Resistance Zone turned pivot near 195.00 to 196.85
- Higher timeframe Main Pivot point 193.00
- Range Intermediate Support Zone around the 190.00 level
Resistance Levels:
- Resistance Zone extremes 199.00 to 200.00
- 201.27 Bank of England and pre-Bank of Japan highs
- 208.120 July 2024 highs
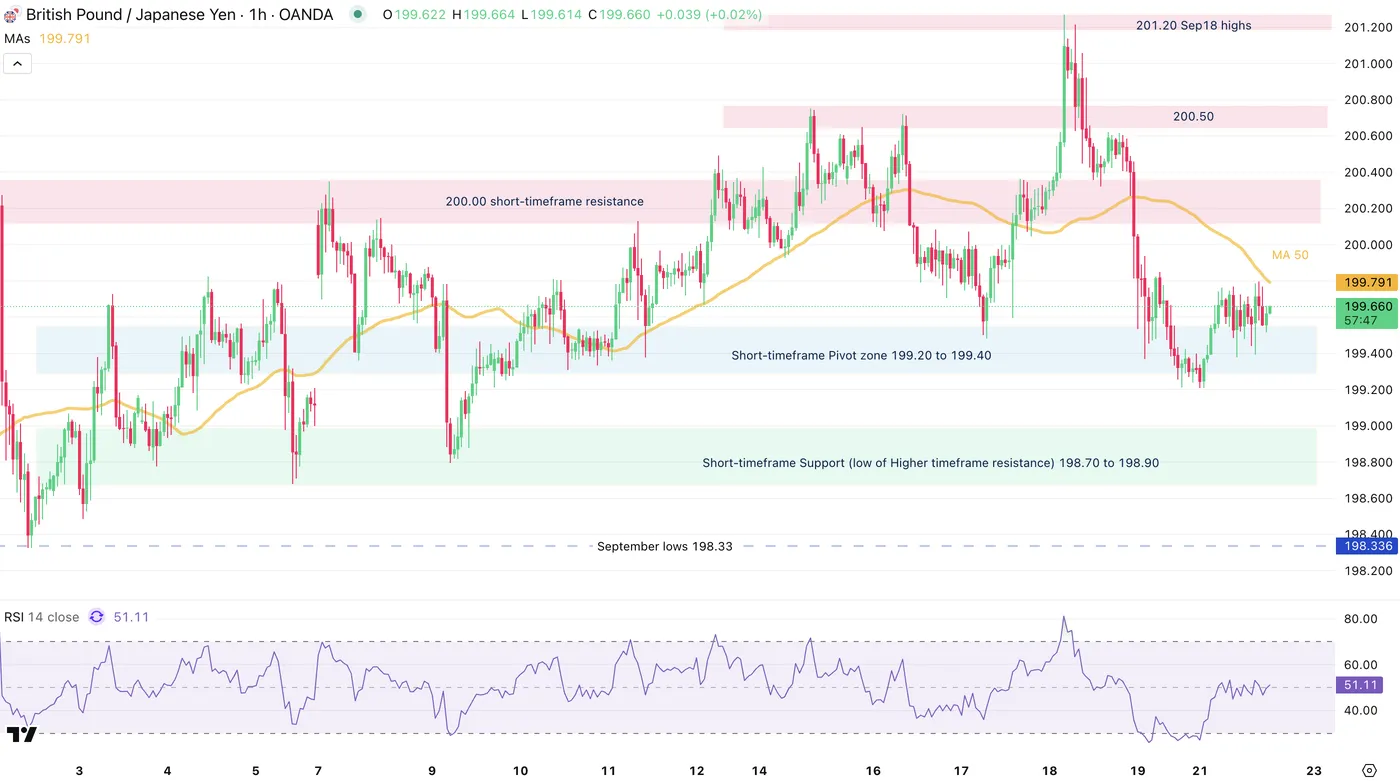
GBPJPY 1H Chart, September 22, 2025 – Source: TradingView
Bulls and bears are battling within the resistance of the range.
The 50-hour Moving average may act as immediate resistance but will only see confirmation if momentum breaches the pivot zone.
Not closing below the pivot on the daily would imply further consolidation within the range.
Safe Trades and Shana Tovah for those who celebrate!


